HAL Id: hal-00413444
https://hal.archives-ouvertes.fr/hal-00413444
Submitted on 4 Sep 2009HAL is a multi-disciplinary open access archive for the deposit and dissemination of sci-entific research documents, whether they are pub-lished or not. The documents may come from teaching and research institutions in France or
L’archive ouverte pluridisciplinaire HAL, est destinée au dépôt et à la diffusion de documents scientifiques de niveau recherche, publiés ou non, émanant des établissements d’enseignement et de recherche français ou étrangers, des laboratoires
on physicochemical properties of wheat, waxy and
standard maize starches
Zoulikha Maache-Rezzoug, Thierry Maugard, Ikbal Zarguili, Emmna Bezzine,
Mohammed-Nadjib El Marzouki, Catherine Loisel
To cite this version:
Zoulikha Maache-Rezzoug, Thierry Maugard, Ikbal Zarguili, Emmna Bezzine, Mohammed-Nadjib El Marzouki, et al.. Effect of instantaneous controlled pressure drop (DIC) on physicochemical properties of wheat, waxy and standard maize starches. Journal of Cereal Science, Elsevier, 2010, 49 (3), pp.346-353. �10.1016/j.jcs.2008.10.005�. �hal-00413444�
EFFECT OF HYDROTHERMAL TREATMENT ON PHYSICOCHEMICAL 1
PROPERTIES OF WHEAT, WAXY AND STANDARD MAIZE STARCHES 2
Authors: 3
Z. Maache-Rezzouga, T. Maugardb, I. Zarguilia, E. Bezzineb, C. Loiselc, M.N. Marzoukid 4
5
aLaboratoire LEPTIAB, Université de La Rochelle - Pôles Sciences et Technologie, 6
Bâtiment Marie Curie, Avenue Michel Crépeau, 17042 La Rochelle, France. 7
bUMR 6250 CNRS-ULR, LIENSS, Equipe Biotechnologie Environnementale, 8
Université de La Rochelle, Pôles Sciences et Technologie, Bâtiment Marie Curie, 9
Avenue Michel Crépeau, 17042 La Rochelle, France. 10
cLaboratoire GEPEA, ENITIAA rue de la Géraudière, BP 82225, 44322 Nantes Cedex 11
3, France. 12
dBioengineering Unit 99 UR 09-26, National Institute of Applied Sciences and 13
Technology (INSAT), BP 676 Tunis, Tunisia 14
*Corresponding author. 15
E-mail address: zrezzoug@univ-lr.fr 16
Tél : (33) 05 46 45 87 81; Fax : (33) 05 46 45 86 16 17
hal-00413444, version 1 - 4 Sep 2009
Author manuscript, published in "Journal of Cereal Science 49, 3 (2010) 346–353" DOI : 10.1016/j.jcs.2008.10.005
Standard maize (SMS), waxy maize (WMS) and wheat (WTS) starches were 19
hydrothermally treated at three pressure levels. Effects of D.I.C. processing conditions 20
on thermal characteristics, enzyme susceptibility, pasting and rheological properties 21
were investigated. For treated starches an increase of transition temperatures (To, TP), a 22
narrowing of width of gelatinization endotherms and a decrease of gelatinization 23
enthalpies (H), were observed. At 3 bar/10 min H decreased from 11.4 J.g-1 to 1.7 24
J.g-1, from 15.5 J.g-1 to 2.1 J.g-1 and from 9.4 J.g-1 to 0 J.g-1 for SMS, WMS and WTS, 25
respectively. At same conditions, starches showed a significant increase in enzymatic 26
hydrolysis, yield of saccharification increased from 19% to 44%, from 21% to 59% and 27
from 55% to 79% for SMS, WMS and WTS, respectively. The study suggested that 28
structural modifications influence in-vitro hydrolysis and the access to WMS 29
ultrastructure by enzymes seems to be easier than that of SMS. The rheological 30
behaviour was modified for treated starches: a decrease in the peak viscosity, measured 31
with a viscoamylograph Brabender, and in the apparent viscosity, measured with a 32
controlled stress rheometer, was observed. 33
Keywords: Starch; D.I.C. hydrothermal treatment; functional properties; Enzyme 34
hydrolysis 35
1. INTRODUCTION 36
Starch has many applications in food and non-food industries. For this reason, 37
modifications are often made to native starches to give them specific properties for 38
particular uses. Starch properties can be modified through controlled application of heat 39
and moisture which produces physical modifications within the granules. Annealing and 40
heat-moisture treatment (HMT) cause a physical modification of starches with respect 41
to size, shape or birefringence via controlled application of heat-moisture (Stute, 1992). 42
In the annealing, starch is suspended in excess water and heated below the gelatinisation 43
temperature, at relatively low values, (40–55 °C) (Stute, 1992). Annealing results in 44
perfection of the crystalline properties that narrow the gelatinization temperature 45
interval by shifting them towards higher values (Hublin, 1994). Annealing does not 46
increase or only moderately the enthalpy of gelatinization (Lawal, 2005). 47
In the HMT, starch is exposed to higher temperatures (120 °C), commonly above 48
gelatinization temperature, at very restricted moisture content (18-30%) during 16 h in 49
some cases (Hoover and Manuel, 1996) and shorter in others (Lim et al., 2001). HMT 50
has been shown to alter structure and physicochemical properties of standard maize, 51
waxy maize, amylomaize, potato, wheat (Stute, 1992; Hoover and Manuel, 1996; Lim et 52
al., 2001). The general effects of HMT on starch are the loss of the birefringence, the 53
increase of the gelatinization temperatures and the broadening of the gelatinization 54
temperature range, the increase of water bonding capacities and enzymes 55
susceptibilities, the decrease of swelling and the increase of solubility. These 56
modifications have consequences on functionality of treated starches: the viscograph hot 57
paste consistencies decrease and starch paste became short and shear-stable (Lorenz and 58
Kulp, 1982; Hoover and Manuel, 1996; Gunarante and Hoover, 2002). Hoover and 59
starch chain associations within amorphous regions and the degree of crystalline 61
order are altered during HMT of wheat, oat, normal maize, waxy maize, high amylose 62
maize, potato and lentil starches. The physical properties of heat moisture treated 63
starches depend on the starch origin and treatment conditions used (Hoover and 64
Vasanthan, 1994). Many authors showed that HMT increased the susceptibility of starch 65
to hydrolysis by -amylases (Kulp and Lorenz, 1982; Maruta et al., 1994; Gunaratne 66
and Hoover, 2002) and the extent of the susceptibility varies with botanical source 67
(Colonna and Buléon, 1992; Li et al., 2004; Srichuwong et al., 2005). According to 68
Lorenz and Kulp (1982) the considerable reduction in relative crystallinity of wheat 69
starch caused by HMT resulted in increased enzyme susceptibility. Planchot et al. 70
(1997) cited by Gunaratne and Hoover (2002), have postulated that the fraction of total 71
crystalline material is an important factor defining the rate and extent of -amylase 72
hydrolysis. 73
The D.I.C. (Détente Instantanée Contôlée: “Instantaneous Controlled pressure Drop”) 74
hydrothermal process, developed in our laboratory some years ago (Zarguili, 2006) is 75
more close to HMT. The major effects observed are almost similar except the 76
gelatinization range temperature where the D.I.C. treatment caused its narrowing 77
(Zarguili, 2006) as observed with annealing (Hublin, 1994). Preliminary studies on 78
SMS and WMS starches (Loisel et al., 2006, Zarguili et al., 2006) showed a partial or 79
total gelatinization of by D.I.C. treated starch, according to processing conditions. The 80
increase of processing time and pressure level induced the narrowing of the 81
gelatinization temperature range, the shift of the characteristics temperatures to higher 82
values and the decrease of gelatinization enthalpy. The occurrence of gelatinization of 83
84
treated starches was clearly attested by the increase of median volume diameter in cold 85
water and a loss of birefringence under polarized light. Maruta et al. (1994) observed for 86
HMT treatment that the pressure is often required to ensure a sufficient heating, but it is 87
not easy to achieve a uniform distribution and penetration of heat into the starch layer. 88
These authors improved the conventional method by the introduction of reduced 89
pressure in order to satisfy practical requirements for industrial production. They 90
observed that the combination of reduced pressure during HMT of starch allows 91
homogeneous diffusion of steam and an effective heat transfer to the starch granules. 92
During D.I.C. treatment, an initial vacuum of 50 mbar was established before 93
introducing steam in processing vessel. As demonstrated by Zarguili et al. (2006), this 94
initial vacuum allows to reduce the resistance of the air and thus to facilitate the 95
diffusion of steam into the product. Consequently, the time necessary to reach the steam 96
equilibrium temperature is reduced (Zarguili, 2006). The originality of D.I.C. method 97
compared to other physical treatments is that the starches are treated at residual 98
moisture content of 13% (dry basis) no hydration step is then used. The conventional 99
methods require previous hydration of starch before the physical treatment. During the 100
D.I.C. treatment, the starch heating is obtained by the absorption of latent heat of steam 101
condensation which causes an increase in the moisture content as the processing time 102
and pressure level increase. Changes of the moisture distribution were measured during 103
the treatment and modelled by Zarguili et al. (2007). 104
The objective of this study is to understand the physicochemical changes produced on 105
native starches after D.I.C. hydrothermal treatment. Under identical conditions 106
(processing pressure and time), the effects of D.I.C. process on the changes of thermal 107
transition characteristics, enzyme digestibility, pasting and rheological properties were 109
evaluated on SMS, WMS and WTS starches. 110
111
2. MATERIALS AND METHODS 112
2.1. MATERIALS
113
SMS, WMS (Waxilys 200) and WTS starches were supplied by Roquette Frères 114
(Lestrem, France). The amylose content was of 27-28% for SMS and WTS and lower 115
than 1% for WMS. The moisture content of these starches was about 12% wet basis. 116
Fungamyl 800 L, a -amylase from Aspergillus oryzae was used for starch liquefaction. 117
The enzyme activity was 800 FAU/g (1 Fungal -amylase FAU is the amount of 118
enzyme which breaks down 5.26 g of starch per hour according Novozyme’s standard 119
method for the determination of -amylase). AMG 300 L, a glucoamylase from 120
Aspergillus niger was used for saccharification. The enzyme activity was 300 AGU/ml
121
(1 Novo Amyloglucosidase Unit (AGU) is defined as the amount of enzyme which 122
hydrolyzes 1 micromoles maltose per minute under standardized conditions according 123
Novozymes. The enzymes were gift from Novozymes, Denmark. 124
2.2. METHODS
125
2.2.1. Moisture content
126
The starch moisture content was determined by air oven at 105 °C during 24 h, 127
according to the A.F.N.OR standard method. 128
2.2.2. D.I.C. hydrothermal treatment
129
The equipment and procedure of D.I.C. hydrothermal treatment were largely described 130
in previous studies (Loisel et al., 2006; Zarguili et al., 2006). During the treatment, 22 g 131
of starch (13% dry basis) disposed in circular containers (diameter: 20 cm; height: 5 132
cm) were placed in the treatment reactor. An initial vacuum of 50 mbar was established. 134
Saturated steam was introduced into the vessel at fixed pressure and maintained for a 135
predetermined time. In this study the processing pressure was fixed at 1 bar (100 °C), 2 136
bar (122 °C) and 3 bar (135 °C). The pressurisation is followed by an abrupt 137
decompression towards vacuum (50 mbar). After the vacuum phase, atmospheric air is 138
injected to return to atmospheric pressure for sample recovery. During the treatment, 139
starch is heated by the absorption of latent heat of vapour condensation that causes an 140
increase in the moisture content. 141
2.2.3. Differential Scanning Calorimetry (DSC)
142
Thermal characteristics of treated starch were studied by using a Micro DSC III 143
(SETERAM, France). Starch samples (800 mg) were placed in a stainless pan; distilled 144
water was added to get a ratio of 1:9 (w/w) starch:water, mix, and then the sample pan 145
was sealed. Sample pan was heated at a rate of 1.2 °C/min from 30 to 110 °C. Thermal 146
transition of starch samples were defined as To (onset temperature), TP (peak 147
temperature) and H was referred to as the gelatinization enthalpy. The gelatinization 148
temperature range (R) was calculated as 2 (Tp – To) as described by Krueger et al. 149
(1987). The degree of gelatinization of treated starch was calculated by the following 150
equation (Marshall et al., 1993). x 100 raw ΔH t ΔH 1 DG(%)
, where DG is the degree 151
of gelatinization of D.I.C. treated starch, Ht and Hraw the gelatinization enthalpy of 152
treated and native starch, respectively. 153
154
2.2.4. Enzyme hydrolysis
155
The dried samples (300 mg) were mixed with 3 ml of citrate phosphate buffer (pH 4.6) 156
in a 5 ml tube. The mixture was treated with enzymes in two steps (a), liquefaction and 157
saccharification, or only in one step of saccharification (b). The first step, liquefaction, 158
was performed at 50 °C with 32 U/l (10 g/l) of Fungamyl 800 L for 120 min. The 159
second step, saccharification, was performed at 65 °C with 1.5 U/l (7 ml/l) of AMG 300 160
L for 60 min. The saccharification was performed at 65 °C with 1.5 U/l (7 ml/l) of 161
AMG 300 L for 120 min. 162
2.2.5. Determination of reducing equivalents
163
During the starch hydrolysis samples were withdrawn for analysis of reducing sugars 164
content using 3, 5-dinitrosalicylic acid method (DNS). In all samples, the reaction was 165
stopped by adding 1 volume of water and by heating at 100 °C for 5 min. After 166
centrifugation of the solution at 3000 rpm for 10 min, a 0.5 ml of a diluted supernatant 167
was transferred to a test tube and 0.5 ml of DNS reagent (10 g dinitrosalicylic acid + 200 168
ml NaOH 2M + 300 g potassium sodium tartrate + qsp 1l distilled water) was added. The 169
tubes were allowed to stand for 10 min in boiling water and cooled to room temperature 170
in ice water. The absorbance of the samples was measured at 550 nm using a 171
spectrophotometer (Shimadzu mini UV 1240). Amount of reducing equivalents was 172
calculated using a glucose standard curve. The starch hydrolysis yield of samples was 173 calculated by: 174 100 x g/l sample in starch dried of weight g/l sample in glucose as expressed sugar Reducing (%) hydrolyse Starch 175
2.2.6. Pasting properties using Viscograph Brabender
177
The processed samples are powdery products that have to be rehydrated for analytical 178
purpose. This was performed using the Brabender Viscograph to obtain a starch paste 179
under repeatable conditions. The starch concentrations were chosen in order to lie 180
within the sensitivity range of the Viscograph: i.e. 6% (w/w) for SMS, 4% (w/w) for 181
WMS and 7% (w/w) for WTS. Starch was slurried in demineralized water at room 182
temperature, and then submitted to gradual heating (1.5 °C/min) from 30 to 96 °C; this 183
temperature was maintained for 10 min and was followed by a cooling step (1.5 °C/min) 184
down to 70 °C before sampling. The moisture content was determined directly after the 185
pasting procedure, to check the starch concentration before rheological measurements. 186
The relevant values obtained from the pasting profile were: onset of the pasting 187
temperature (To), temperature of peak viscosity (Tp) and peak viscosity (PV) in 188
Brabender units (100 BU for 25 cmg). 189
2.2.7. Rheological measurements
190
Flow behaviour of starch pastes were measured using a controlled stress rheometer (TA 191
Instrument AR1000) with the cone/plate geometry (6 cm/2°). An aliquot of the starch 192
dispersion pasted at 60 °C in the Viscograph Brabender was poured onto the plate of the 193
rheometer preheated at 60 °C, then covered by a layer of paraffin oil to avoid 194
evaporation. For flow measurements, two up-down shear scans from 0.01 to 660 s-1 (4 195
min each) were linearly applied, followed by a logarithmic stepwise decrease from 660 196
to 0.01 s-1, after equilibrium for each shear rate, as described by Nayouf et al., 2003. 197
Rheological properties were obtained using Herschel-Bulkley model, according to 198
equation n 0 k
τ
τ , where o is the yield stress (Pa), k the consistency index 199
(Pa.sn) and n the flow behaviour index (dimensionless). The Herschel-Bulkley model 200
fitted the data satisfactorily (R2 = 0.98). 201
2.2.8. Polarised light microscopy
202
Dilute native and D.I.C. treated standard starch suspensions (1:20) were viewed under 203
polarised light (magnifying 400 X) using a phase contrast microscope equipped with a 204
CCD camera. 205
3.1. Thermal properties
207
The effect of D.I.C. hydrothermal treatment on gelatinization temperatures [onset (To), 208
peak (Tp), and temperature range (R)] and gelatinization enthalpy (H) of treated 209
starches (SMS, WMS and WTS) were studied. The obtained values were compared with 210
those of native starches. The native starches displayed differences in gelatinization 211
temperatures and enthalpy changes, as indicated by DSC analysis (Table 1). To, Tp, R 212
and H of SMS and SWS were higher than corresponding values for wheat. To, Tp and 213
H of the native starches followed the order: WMS>SMS>WTS. To and Tp were of 214
65.4 and 71.3.4 °C for WMS, of 63.1 and 69.6 °C for SMS, of 50.4 and 56.6 °C for 215
WTS. According to Gunaratne and Hoover (2002), the differences in gelatinization 216
temperatures among starches can be attributed to the interplay of three factors: 217
molecular structure of amylopectin (unit chain length, extent of branching), starch 218
composition (amylose to amylopectin ratio, amount of lipid complexed, amylose chains, 219
phosphorous content) and granular architecture (crystalline to amorphous ratio). 220
Amylopectin plays a major role in starch granule crystallinity, the presence of amylose 221
lowers the melting temperature of crystalline regions and the energy for starting 222
gelatinization (Flipse et al., 1996). That explains the high gelatinization temperatures 223
and enthalpy values of WMS, which contains mainly amylopectin. Whereas Noda et al. 224
(1998) attributed the influenced of DSC parameters to the molecular architecture of 225
crystalline region, which corresponds to the distribution of amylopectin short chains and 226
not to the proportion of crystalline region which corresponds to the amylose to 227
amylopectin ratio. The gelatinization temperatures ranges (R) of native starches (Table 228
respectively. Fredriksson et al. (1998) reported that wide temperature range 230
implied a large amount of crystals with varied stability. Cooke and Gidley (1992) 231
have shown that H is due mainly to the disruption of the double helices rather than the 232
longer range disruption of crystallinity. Gunaratne and Hoover (2002) postulated that 233
the higher H values could be attributed to the presence of higher number of double 234
helices and/or weaker interaction between adjacent amylopectin double helices within 235
the crystalline domains of the native granules. The higher gelatinization parameters of 236
WMS suggest that the chains forming the doubles helices are longer with greater 237
interchain association than those of WTS. 238
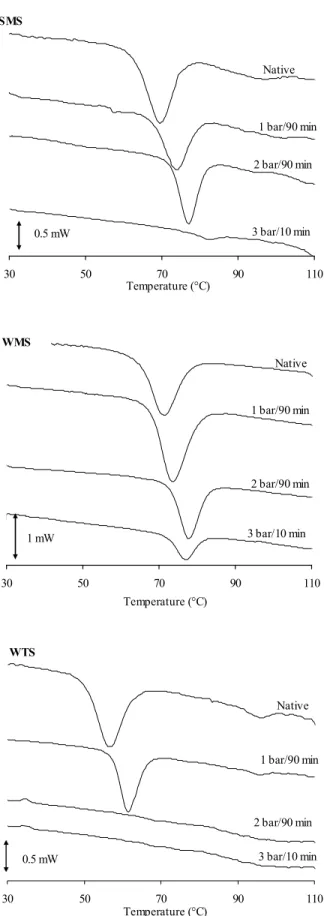
For all starches, D.I.C. hydrothermal treatment increased To and Tp, but decreased R and 239
H (Table 1). To and Tp increased with increasing pressure level and processing time 240
and shifted to higher values (Fig. 1). At 2 bar (122 °C) and processing time of 90 min, 241
To- Tp shifted from 63.1 - 69.6 °C (native SMS) to 72.9 - 77.5 °C, from 65.4 – 71.3 °C 242
(native WMS) to 73.1 - 77.8 °C and from 50.4 - 56.6 °C (native WTS) to 65.2 - 68.0 °C. 243
At the same D.I.C. conditions (1 bar/90 min), the increase in To (6.5 °C) and Tp (5.8 °C) 244
for SMS was equivalent to that observed for WTS [To (7.2 °C) and Tp (4.9 °C)], 245
whereas this increase was lower for WMS [To (2.6 °C) and Tp (2.4 °C)]. Similar 246
increases have been reported on HMT of cereal starches (Lim et al., 2001; Hoover and 247
Manuel, 1996; Hoover and Vasanthan, 1994). Lim et al. (2001) observed an increase in 248
To and TP from 62.6 and 66.9 °C for native maize to 63.4 and 76.7 °C, after HMT 249
(120°C during 1 hour and 30% of water content). Hoover and Manuel (1996) observed a 250
large increase in To, Tp and Tc for standard maize and amylomaize V starches, but a 251
small increase in waxy and Dull waxy maize starches. According to these authors, the 252
change in transition temperature following HMT is probably influenced by the decrease 253
melt, due to the formation of amylose-lipid complexes and interactions between 255
and among amylose chains. 256
As discussed previously, the gelatinization temperature range (R) gives an indication of 257
the quality and heterogeneity of crystallites (Fredriksson et al., 1998; Gunaratne and 258
Hoover, 2002), R reflects the size and crystallites perfection. Many researchers have 259
already showed the broadening of the gelatinization temperature of starches after HMT 260
treatment (Hoover and Manuel, 1996; Lim et al., 2001; Adebowal et al., 2005), and this 261
broadening depends on botanical source. An inverse tendency was observed with D.I.C. 262
treated starches, a narrowing of the gelatinization temperature range for the three 263
starches, as observed with annealed starches (Hublin, 1994). A greater decrease in 264
gelatinization range was observed in SMS and WTS compared to WMS (Table 1). 265
According to Hublin (1994), the temperature range reflects the degree of cohesion 266
between crystallites, when R decreases a stronger cohesion exists between crystallites. 267
The narrower temperature range exhibited by D.I.C. treated starches suggests the 268
presence of crystallites of homogenous stability. We suppose that the D.I.C. treatment 269
allowed first the fusion of crystallites of low cohesion, which required less energy to 270
melt and a reinforcement of the interactions between the remaining crystallites chains. 271
Therefore, the residual structure after treatment contains a greater homogeneity of 272
crystallites. 273
The gelatinization enthalpies of treated starches (Tables 1) showed that the H values 274
depend on the intensity of D.I.C. conditions. The gelatinization enthalpies decreased 275
progressively for the three types of starches with increasing pressure level and 276
processing time. The extent of the decrease after treatment followed the order : 277
WMS>SMS>WTS. At processing pressure of 2 bar and 90 min, the gelatinization 278
enthalpies decrease for WTS from 9.4 (native) to 0.1 J.g-1, for SMS from 11.4 279
(native) to 7.1 J.g-1 and for WMS from 15.5 (native) to 11.2 J.g-1. By considering 280
gelatinization degree, we noted after D.I.C. treatment (2 bar and 90 min) a partial 281
gelatinization of 98.9%, 37.7% and 27.7%, for WTS, SMS and WMS, respectively. 282
Vermeylen et al., 2006 observed on potato starch the decrease of gelatinisation enthalpy 283
with more severe HMT conditions, but effects of moisture content are considerable only 284
at higher temperature, between 90 and 120 °C. According to Gunaratne and Hoover 285
(2002), the decrease in H on HMT suggest that some of the double helices present in 286
crystalline and non crystalline regions of the granule could be disrupted under the 287
conditions prevailing during treatment. Thus, few double helices would unravel and 288
melt during gelatinization of HMT treated starches. 289
We already showed on standard maize starch (Zarguili et al., 2007) that during D.I.C. 290
treatment the moisture content of starch granules increases as pressure and processing 291
time increase, due to the absorption of accumulated steam. The initial moisture content 292
of starch (13%, base dries) is different from the real moisture content present during the 293
treatment. This increase reaches an equilibrium value after a given time which depends 294
on the level of processing pressure. At the pressure of 1 and 2 bar, the equilibrium 295
moisture content was 17% and 26% (dry basis) and reached after 30 and 60 min of 296
D.I.C. treatment, respectively. However, for pressure level of 3 bar the measure of 297
equilibrium moisture content (beyond 60 min) could not be taken because of the 298
formation of a compact lump making measurement difficult. From this study, at 3 bar 299
and 10 min, the moisture content uptake was 18% (dry basis). 300
In a first reaction, the enzyme digestibility of native WMS was compared to the 302
digestibility of two WMS treated by D.I.C. This digestibility was carried out in two 303
steps. The first step, liquefaction, was performed with Fungamyl 800 L for 120 min. 304
The second step, saccharification, was performed with AMG 300 L for 60 min. The 305
kinetics of liquefaction and saccharification (not showed) of WMS treated by D.I.C. at 1 306
bar with a processing time of 90 min are very similar to those obtained from native 307
WMS. These results suggest that the low D.I.C. conditions (1 bar/90 min) do not have a 308
significant effect on the enzymatic hydrolysis. It is important to note that the yield of 309
liquefaction is very low, only 10% obtained after 2 hours. 310
On the other hand, we observe that kinetics of liquefaction and saccharification but also 311
hydrolysis yields of WMS hydrotreated at 3 bar with a processing time of 10 min is 312
strongly improved. The liquefaction with Fungamyl involved the production of maltose 313
syrup with a little production of glucose syrup. Very fast is the rate, with a hydrolysis 314
yield around of 40% obtained in less of 10 min. The saccharification with AMG 315
involved the production of glucose syrup, is observed by TLC analysis (Fig 2). After 1 316
hour of saccharification, a yield of hydrolysis of 80% is obtained. These first 317
experimentations demonstrate that the high D.I.C. conditions (3 bar/10 min) have a big 318
effect on rates and yields of liquefaction and saccharification. 319
A similar effect was observed with saccharification without preliminary liquefaction 320
(results not showed.). A hydrolysis yield of 70% is obtained after 60 min using WMS 321
treated by D.I.C. at 3 bar/10 min, while a hydrolysis yield near of 55% is obtained after 322
130 min with WMS native. 323
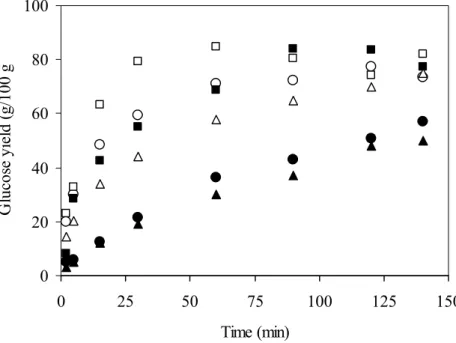
The effects of D.I.C. process on the enzymatic hydrolysis of WMS were compared 324
to those obtained on SMS and WTS starches. Saccharification alone with AMG 325
was carried out (Fig. 3), we observe that in all starches the kinetics of saccharification is 326
more efficient from treated starches than native starches. The more pronounced increase 327
in hydrolysis was observed for all starches when severe D.I.C. conditions were applied 328
(pressure level 3 bar, table 1). The hydrolysis yield after 30 min of the three native 329
starches was increased after D.I.C. treatment at 3 bar for 10 min following the order: 330
WMS (39%), SMS (24%) and WTS (21%). 331
The increase in the susceptibility towards enzymatic hydrolysis after treatment suggests 332
a strong link with the structural modifications induced by the heat treatment. The 333
increase of starch hydrolysis is concomitant with the decrease of the gelatinization 334
enthalpy. That was observed in precedent experimentations (Table 1). In a recent work 335
we showed that the D.I.C. treatment decreased the relative crystallinity of 336
hydrothermally treated starches as the severity of processing conditions increased 337
(Zarguili, 2006). The increase in the accessibility of starches to enzyme attack after 338
HMT has been also reported by several researchers (Gunaratne and Hoover, 2002). 339
3.3. Pasting properties
340
Typical Brabender Viscograph curves of native and D.I.C. treated starches are shown in 341
Fig. 2, of SMS, WMS and WTS. The pasting properties of analysed starches are 342
summarized in table 2. It is difficult to compare the pasting values of starches because 343
of the differences in starch concentrations used during measurements. The starch 344
concentrations were chosen in order to lie within the sensitivity range of the 345
Viscograph: i.e. 6% for SMS, 4% (w/w) for WMS and 7% for WTS. 346
occurring at 97.5 °C and the onset of the pasting temperature at 82.5 °C for native 348
and SMS treated at 1 bar for 90 min (Table 2). The PV increased from 835 UB (native) 349
to 870 UB for SMS treated for 90 min and 1 bar. At severe D.I.C. conditions (2 bar for 350
90 min and 3 bar for 10 min), starch produced a very soft gel which was not measurable 351
under the experimental conditions. While the pasting temperature of WMS increased 352
following D.I.C. treatment. The PV decreases with increase of the intensity of D.I.C. 353
conditions (processing pressure and time). However, at same pressure, processing time 354
seems to reduce viscosity (result not given). D.I.C. treatment decreased To of WTS, 355
from 80 °C for native starch to 70 °C for D.I.C. WTS at 3 bar for 10 min. The Tp 356
remained unchanged after D.I.C. treatment. At the same D.I.C. condition (1 bar and 90 357
min) like SMS, PV of D.I.C. WTS was higher than native starch. WTS treated at 3 bar 358
for 10 min showed a cold swelling behaviour with a rapid rehydration traduced by a 359
Brabender viscosity of about 180 UB (Fig. 4). This cold viscosity is explained by a 360
partial solubilization of WTS already pregelatinized following D.I.C. treatment. 361
Compared to SMS and WTS starches, the final viscosity of WMS, that is virtually free 362
of amylose, is lower. This is probably related to the differences of amylose leaching and 363
its contribution to the setback viscosity. It well known that when gelatinized starch 364
paste is subject to cooling the extent of viscosity increase is mainly governed by the 365
rapid reassociation of linear amylose chains by formation of gel matrix. 366
Many authors have been observed that HMT increased pasting temperature 367
characteristics and decreased of Brabender pasting viscosity at 95 °C after 30 min 368
holding time for standard maize, amylomaize (Hoover and Manuel, 1996), potato 369
(Hoover and Vasanthan, 1994) and lentil, oat (Hoover and Vasanthan, 1994). However, 370
for waxy maize starch heated in conventional oven, pasting properties seemed to be 371
unaffected (Hoover and Manuel, 1996). According these authors, the decrease of 372
viscosity could be explained by the increase of inter and intramolecular hydrogen bonds 373
due to the association of the amylose chains and the formation of the complex amylose-374
lipid after hydrothermal treatment. Recent work showed by the X-ray diffraction pattern 375
of SMS D.I.C. treated at 2 bar for 60 min and 3 bar for 0.5 and 15 min the partial loss 376
(treatment at 2 bar) or total (treatment at 3 bar) of the crystalline structure and the 377
presence of a crystalline amylose-lipid complex formed during D.I.C. treatment 378
(Zarguili, 2006). Eliasson (1985) reported that amylose-lipid complex inhibits the 379
swelling of starch. Tester and Morrison (1990) reported also that amylopectin 380
contributes to swelling, whereas the amylose and lipids inhibits swelling. 381
3.4. Flow properties
382
The flow properties of native and D.I.C. SMS, WMS and WTS starch dispersions were 383
studied in the shear rate range of 0.01-660 s-1 and the results are presented in Table 2. 384
All the curves (not shown) exhibited a non-newtonian shear thinning behaviour with or 385
without a yield stress. The shear-thinning behaviour appear clearly (n < 1), except for the 386
SMS suspensions treated at 2 bar for 90 min and 3 bar for 10 min, whose rheological 387
behaviour is rather newtonian (n = 1, o = 0). For all treated starches, one observed the 388
decrease of yield stress (o), consistency index (k), and apparent viscosity () with the 389
increase in processing pressure and time. For SMS treated at 2 and 3 bar, no yield stress 390
was measured (Table 2). A drastic reduction in the apparent viscosity was observed, 391
with values close to those of water. These results confirm those obtained by the 392
Viscograph Brabender at the same D.I.C. conditions. Contrary to the SMS, the flow 393
constant and its value is approximately equal to that of the native starch (0.53). 395
The variation of viscosity deduced using the Herschel-Bulkley model for the three 396
starches at various D.I.C. conditions, agrees overall with pasting viscosity values 397
measured by Brabender. The reduction in viscosity after D.I.C. treatment is mainly 398
allotted to the reduction in swelling capacity of treated starches. The rheological 399
behavior of starch suspensions is known to be the result of a combination of two major 400
factors: the continuous phase and the volume fraction of dispersed phase. In the range of 401
concentrations used in this work (Loisel et al., 2006), the volume fraction appears to be 402
close to unity: the suspension can then be described as a packing of swollen starch 403
granules, the overall behavior being governed by the dispersed phase (Doublier et al., 404
1987). 405
3.5. MICROSCOPIC OBSERVATIONS
406
The polarized light microscope images (not shown) of D.I.C. treated SMS, WMS and 407
WTS starches showed that the starch granules size did not appear to have changed. At 1 408
and 2 bar for 90 min of processing time, about half of the starch granules exhibited 409
birefringence with a few swollen granules. The gradual loss of birefringence observed 410
using microscopy is also reflected in the result obtained by DSC measurements (Table 411
1). We observed that the cross polarization is still clear on a significant number of 412
granules of treated SMS and WMS. The degree of gelatinization calculated for these 413
starches were of 23.7 - 37.7% and 2.6 - 27.7%, respectively. For WTS treated at 414
pressure of 2 bar and 90 min a few starch granules exhibited birefringence with little 415
swelling. The DSC measurements indicated that the starch granules were almost 416
their birefringence. Whereas for SMS and WMS some intact granules are visible, 418
this confirms the DSC results, where the gelatinization degrees of the residual 419
structure at this condition, were of 85.1 and 86.5%, respectively. 420
4. CONCLUSIONS 421
This study has shown that the D.I.C. treated starches gelatinise at higher temperatures 422
and over narrower temperature ranges than native starches. Moreover, gelatinization 423
enthalpies decreased progressively for the three treated starches with increasing pressure 424
level and processing time. The extent of the decrease followed this order: 425
WMS>SMS>WTS. The similar enzymatic behaviour was observed on D.I.C. treated 426
starches. For all starches the kinetics of saccharification was more efficient from treated 427
than native starches. The enzymatic susceptibility of starches is directly related to the 428
structural modifications produced by the hydrotraitement. The considerable reduction in 429
relative crystallinity caused by the D.I.C. treatment had as consequence the increase of 430
the enzymes susceptibility. 431
Adebowal, K.O., Afolabi, T.A., Olu-Owolabi, B.I., 2005. Hydrothermal treatments of 433
finger millet (Eleusine coracana) starch. Food Hydrocolloids 19 (6), 974-983. 434
Colonna, P., Buléon, A., 1992. New insight on structure and properties. Page 25 in: 435
Cereal Chemistry and Technology, a long Past and a Bright Future. 9th International 436
Cereal and Bread Congress, Paris. 437
Cooke, D., Gidley, M.J., 1992. Loss of crystalline and molecular order during starch 438
gelatinization: origin of the enthalpic transition. Carbohydrate Research, 227, 13-112. 439
Donovan, J.W., 1979. Phase transitions of the starch-water system. Biopolymes, 18, 440
263-275. 441
Doublier, J. L., Llamas, G., Le Meur, M., 1987. A rheological investigation of cereal 442
starch pastes and gels. Effect of pasting procedures. Carbohydrate Polymers, 7, 251-443
275. 444
Eliasson, A.C., 1985. Retrogradation of starch as measured by differential scanning 445
calorimetry. Pages 93 in: New Approaches to research on cereal Carbohydrates. R. D. 446
Hill, and L. Munck, eds. Elsevier Applied science: London. 447
Flipse, E., Keeteld, C.J.A.M., Jacobson, E., Visser, R.G.F., 1996. The dosage effect of 448
the wiltype GBSS allele is linear for GBSS activity but not for amylose content: 449
Absence of amylose has a distinct influence on the physico-chemical properties of 450
starch. Theoretical and Applied Genetics, 92, 121-127. 451
Fredriksson, H., Silverio, J., Andersson, R., Eliasson, A. –C., Aman, P., 1998. The 452
influence of amylose and amylopectin characteristics on gelatinization and 453
retrogradation properties of different starches. Carbohydrate Polymers, 35, 119-454
134. 455
Gunaratne, A., Hoover, R., 2002. Effect of heat-moisture treatment on the structure and 456
physical properties of tuber and root starches. Carbohydrate Polymers, 49, 425-437. 457
Hoover, R., Manuel, H., 1996. Effect of heat-moisture treatment on the structure and 458
physicochemical properties of normal maize. waxy maize, dull waxy maize and 459
amylomaize V starches. Journal of Cereal Science, 23. 153-162. 460
Hoover, R., Vansanthan, T., 1994. Effect of heat-moisture treatment on the structure 461
and physicochemical properties of cereal. tuber. and legume starches. Carbohydrate 462
Research, 252. 33-53. 463
Hublin, L., 1994. Influence des caractéristiques structurales des amidons natifs sur leur 464
réactivité chimique. PhD dissertation, Université de Nantes. France. 465
Imberty, A., Buléon, A., Tran, V., Perez, S., 1991. Recent advances in knowledge of 466
starch structure. Starch/ Stärke, 43, 375-384. 467
Krueger, B.R., Knutson, C.A, Inglett, G. E., Walke, C.E., 1987. A differential scanning 468
calorimetry study on the effect of annealing on gelatinization behavior of corn starch. 469
Journal of Food Science, 52, 715-718. 470
Lawal, O.S., 2005. Studies on the hydrothermal modifications of new cocoyam 471
(Xanthosoma sagittifolium) starch. International journal of biological macromolecules, 472
37 (5), 268-277. 473
Li, J.H., Vasanthan, T., Hoover, R., Rossnagel, B.G., 2004. Starch hull-less barley: IV. 474
Morphological and structural changes in waxy, normal and high-amylose starch 475
Lim, S.T., Chang, E.H., Chung, H.J., 2001. Thermal transition characteristics of heat– 477
moisture treated corn and potato starches. Carbohydrate Polymers, 46, 107-115. 478
Loisel, C., Maache-Rezzoug, Z., Esneault, C., Doublier, J.L., 2006. Effect of 479
hydrothermal treatment on the physical and rheological properties of maize starches. 480
Journal of Food Engineering, 73, 45-54. 481
Lorenz, K., Kulp, K., 1982. Cereal and root starch modification by heat-moisture 482
treatment. I. physicochemical properties. Starch/ Stärke, 34, 50-54. 483
Marshall, W.E., Wadsworth, JI., Verma, L.R., Velupillai, L., 1993. Determining the 484
degree of gelatinization in parboiled rice: comparison of subjective and an objective 485
method. Cereal Chemistry, 70, 226-230. 486
Maruta, I., Kurahashi, Y., Takayano, R., Hayashi, K., Yoshino, Z., Komaki, T., Hara, 487
S., 1994. Reduced-pressurized moisture treatment. A new method for heat-488
moisture treatment of starch. Starch/Stärke, 46, 177-181. 489
Noda, T., Takahata, Y., Sato, T., Suda, I., Morishita, T., Ishiguro, K., 1998. 490
Relationships between chain length distribution of amylopectinand gelatinization 491
properties within the same botanical origin for sweet potato and buckwheat. 492
Carbohydrate Polymers, 37, 153-158. 493
Planchot, V., Colonna, P., Buléon, A. Gallant, D., 1997.Amylosis of starch granules and 494
a-glucan crystallites. In R. J. Frazier, A. M. Donald & P. Richmond, Starch structure 495
and functionality (PP. 141-152). Cambridge, UK : Royal Society of Chemistry. 496
Srichuwong, S., Sunarti, T.C., Mishima, T., Isono, N., Hisamatsu, M., 2005. Starches 497
from different botanical sources II: Contribution of starch structure to swelling and 498
pasting properties. Carbohydrate Polymers, 62, 25-34. 499
Stute, H., 1992. Hydrothermal modification of starches: the difference between 500
annealing and heat-moisture treatment, Starch/Stärke, 44, 205-214. 501
Tester, R.F., Morrison, W.R., 1990. Swelling and gelatinization of cereal starches. I. 502
Effects of amylopectin, amylase and lipids. Cereal chemistry, 67, 551-557. 503
Vermeylen, R., Goderis, B., Delcour, J.A., 2006. An X-ray study of hydrothermally 504
treated potato starch. Carbohydrate Polymer, 64, 364-375. 505
Zarguili, 2006. Etude de l’effet de l’hydrotraitement D.I.C. sur les propriétés 506
structurales et fonctionnelles des amidons de différentes origines botaniques. PhD 507
dissertation, Université de La Rochelle. France 508
Zarguili, I., Maache-Rezzoug, Z., Loisel, C., Doublier, J.-L., 2006. Influence of D.I.C. 509
hydrothermal process conditions on the gelatinization properties of standard maize 510
starch. Journal of Food Engineering, 77 (3), 454-461. 511
Zarguili, I., Maache-Rezzoug, Z., Loisel, C., Doublier, J.-L., 2007. A mathematical 512
model to describe the change of moisture distribution in maize starch during D.I.C. 513
hydrothermal treatment. International Journal of Food Science and Technology, in 514
press. 515
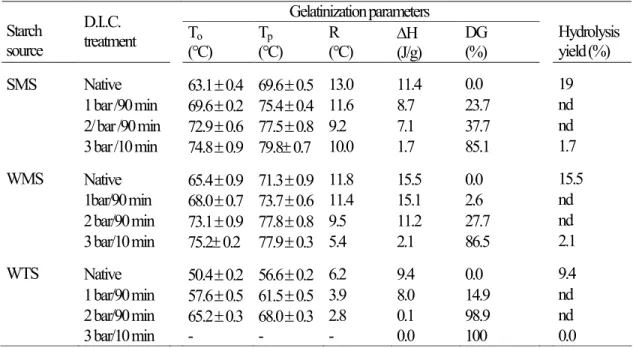
Table 1. DSC characteristics of native and D.I.C. treated starches, of SMS, WMS and WTS starches, at various steam pressures level and processing time. Hydrolysis yield after 30 min of saccharification with AMG.
Gelatinization parameters Starch source D.I..C. treatment To (°C) Tp (°C) R (°C) H(J/g) DG (%) Hydrolysis yield (%) SMS Native 63.1 0.4 69.6 0.5 13.0 11.4 0.0 19 1 bar /90 min 69.6 0.2 75.4 0.4 11.6 8.7 23.7 nd 2/ bar /90 min 72.9 0.6 77.5 0.8 9.2 7.1 37.7 nd 3 bar /10 min 74.8 0.9 79.8 0.7 10.0 1.7 85.1 1.7 WMS Native 65.4 0.9 71.3 0.9 11.8 15.5 0.0 15.5 1bar/90 min 68.0 0.7 73.7 0.6 11.4 15.1 2.6 nd 2 bar/90 min 73.1 0.9 77.8 0.8 9.5 11.2 27.7 nd 3 bar/10 min 75.2 0.2 77.9 0.3 5.4 2.1 86.5 2.1 WTS Native 50.4 0.2 56.6 0.2 6.2 9.4 0.0 9.4 1 bar/90 min 57.6 0.5 61.5 0.5 3.9 8.0 14.9 nd 2 bar/90 min 65.2 0.3 68.0 0.3 2.8 0.1 98.9 nd 3 bar/10 min - - - 0.0 100 0.0
To: onset temperature; Tp: peak temperature. Temperature values are means of triplicate
determinations ± standard deviation. R: temperature range calculated as 2 (Tp– To). H: enthalpy of
gelatinization with the mean absolute error (three repetitions) of 0.5 J/g. DG: degree of gelatinization. nd: not determined.
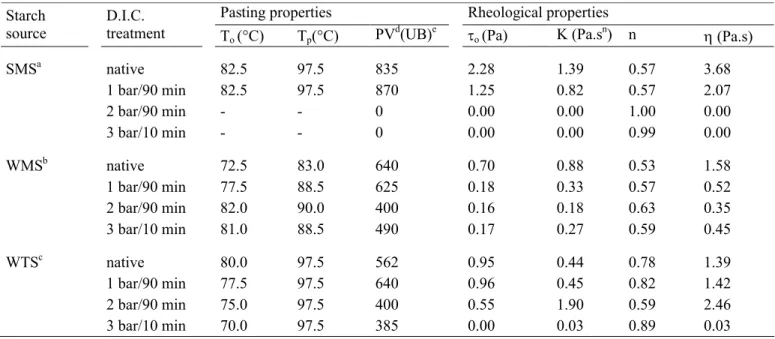
Table 2. Pasting and rheological characteristics of native and D.I.C. treated starches at pressure of 1, 2 and 3 bar for two processing time.
Pasting properties Rheological properties
Starch source
D.I.C.
treatment To (°C) Tp(°C) PVd(UB)e
o (Pa) K (Pa.sn) n (Pa.s)
SMSa native 82.5 97.5 835 2.28 1.39 0.57 3.68 1 bar/90 min 82.5 97.5 870 1.25 0.82 0.57 2.07 2 bar/90 min - - 0 0.00 0.00 1.00 0.00 3 bar/10 min - - 0 0.00 0.00 0.99 0.00 WMSb native 72.5 83.0 640 0.70 0.88 0.53 1.58 1 bar/90 min 77.5 88.5 625 0.18 0.33 0.57 0.52 2 bar/90 min 82.0 90.0 400 0.16 0.18 0.63 0.35 3 bar/10 min 81.0 88.5 490 0.17 0.27 0.59 0.45 WTSc native 80.0 97.5 562 0.95 0.44 0.78 1.39 1 bar/90 min 77.5 97.5 640 0.96 0.45 0.82 1.42 2 bar/90 min 75.0 97.5 400 0.55 1.90 0.59 2.46 3 bar/10 min 70.0 97.5 385 0.00 0.03 0.89 0.03
a6% (w/w) aqueous standard maize starch suspension; b4% (w/w) aqueous waxy maize starch suspension; c
7% (w/w) aqueous wheat starch suspension; To: onset of the pasting temperaturedPV, peak viscosity. eUB,
Units Brabender.0 :yield stress ; K : consistency index; n : flow behaviour index (K and n were determined
from Herschel-Bulkley model); :apparent viscosity measured for shear rate of 1s-1.
Figure captions
Fig. 1. Differential scanning calorimetry curves of native and DIC treated standard maize (SMS), waxy maize(WMS) and wheat(WTS) starches at processing time of 90 and 10 min and pressure level of 1 (100°C), 2 (122°C)and 3 bar (135°C).
Fig. 2. TLC analysis of WMS hydrolysis. Native WMS after 20 min of Liquefaction (A), treated WMS at 3 bar/10 min after 20 min of Liquefaction (B), native WMS after 120 min of Liquefaction and 60 min of saccharification (C) treated WMS at 3 bar/10 min after 120 min of Liquefaction and 60 min of saccharification (D).
Fig. 3. Time course of several starches hydrolysis by AMG. WMS native (
●
), WMS treated by DIC at 3 bar/10 min (○
), WTS native (), WTS treated by DIC at 3 bar/10 min (□
), SMS native (▲) and SMS treated by DIC at 3 bar/10 min (△).Fig. 4. Brabender curves of native and DIC treated SMS, WMS and WTS.
Fig. 1 30 50 70 90 110 Temperature (°C) 0.5 mW WTS 2 bar/90 min 1 bar/90 min Native 3 bar/10 min 30 50 70 90 110 Temperature (°C) 0.5 mW SMS Native 1 bar/90 min 2 bar/90 min 3 bar/10 min 30 50 70 90 110 Temperature (°C) 1 mW 2 bar/90 min 1 bar/90 min Native 3 bar/10 min WMS
A
B
C
D
A
B
C
D
glucose maltose
Fig. 3 0 20 40 60 80 100 0 25 50 75 100 125 150 Time (min) G luc os e yi el d (g/ 100 g)
0 200 400 600 800 1000 0 20 40 60 80 Time (min) B ra be nd er V is co si ty ( U B ) 0 20 40 60 80 100 T em pe ra tu re (° C ) Native 1bar/90min 2bar/90min 3bar/5min Temperature10 min WTS 0 200 400 600 800 1000 0 20 40 60 80 Time (min) B ra b e n d e r V is co si ty ( U B ) ,,, ,,, ,,, ,, 0 20 40 60 80 100 T e m p e ra tu re (° C ), ,,,, , Native 1bar/90min 2bar/90min 3bar/10min Temperature SMS 0 200 400 600 800 1000 0 20 40 60 80 Time (min) B ra be nd er V is co si ty ( U B ) ,, ,, ,, ,, , 0 20 40 60 80 100 T em pe ra tu re (° C ), ,,, ,, Native 1bar/90min 2bar/90min 3bar/10min Temperature WMS