´
ETUDE DES TECHNIQUES DE D ´ETECTION DES SIBILANTS DANS LES SONS RESPIRATOIRES EN VUE D’UN TRAITEMENT TEMPS-R ´EEL SUR FPGA
M ´EMOIRE PR ´ESENT ´E
dans le cadre du programme de maˆıtrise en ing´enierie
en vue de l’obtention du grade de maˆıtre `es sciences appliqu´ees (M. Sc. A.)
PAR
©ONS BOUJELBEN
Composition du jury :
Adrian Ilinca (Ph.D.), pr´esident du jury, Universit´e du Qu´ebec `a Rimouski
Mohammed Bahoura (Ph.D.), directeur de recherche, Universit´e du Qu´ebec `a Rimouski
Hassan Ezzaidi (Ph.D.), examinateur externe, Universit´e du Qu´ebec `a Chicoutimi
UNIVERSIT ´E DU QU ´EBEC `A RIMOUSKI Service de la biblioth`eque
Avertissement
La diffusion de ce m´emoire ou de cette th`ese se fait dans le respect des droits de son auteur, qui a sign´e le formulaire Autorisation de reproduire et de diffuser un rapport, un m´emoire ou une th`ese . En signant ce formulaire, l’auteur conc`ede `a l’Universit´e du Qu´ebec `a Ri-mouski une licence non exclusive d’utilisation et de publication de la totalit´e ou d’une par-tie importante de son travail de recherche pour des fins p´edagogiques et non commerciales. Plus pr´ecis´ement, l’auteur autorise l’Universit´e du Qu´ebec `a Rimouski `a reproduire, diffuser, prˆeter, distribuer ou vendre des copies de son travail de recherche `a des fins non commer-ciales sur quelque support que ce soit, y compris l’Internet. Cette licence et cette autorisation n’entraˆınent pas une renonciation de la part de l’auteur `a ses droits moraux ni `a ses droits de propri´et´e intellectuelle. Sauf entente contraire, l’auteur conserve la libert´e de diffuser et de commercialiser ou non ce travail dont il poss`ede un exemplaire.
` A ma m`ere ` A mon p`ere ` A ma sœur ` A mon fr`ere `
REMERCIEMENTS
Je tiens `a adresser ma sinc`ere reconnaissance `a mon directeur de recherche, Moham-med Bahoura, professeur au d´epartement de Math´ematiques, d’Informatiques et de G´enie de l’Universit´e du Qu´ebec `a Rimouski, pour m’avoir accompagn´e durant mes travaux de re-cherche. J’ai particuli`erement appr´eci´e de travailler `a ses cˆot´es. Il m’a donn´e de nombreux informations pertinentes, se montrant disponible d`es que j’avais besoin de ses conseils.
J’exprime toute ma gratitude au professeur Adrian Ilinca d’avoir accept´e d’ˆetre le pr´esident du jury pour l’´evaluation de mon m´emoire.
J’adresse ´egalement mes plus vifs remerciements au professseur Hassan Ezzaidi d’avoir accept´e d’examiner mon travail.
Cette recherche a ´et´e rendue possible grˆace au support financier du Conseil de Re-cherches en Sciences Naturelles et en G´enie (CRSNG).
R ´ESUM ´E
L’identification des bruits pulmonaires normaux et anormaux est une op´eration impor-tante pour le diagnostic m´edical des poumons. De nos jours, le st´ethoscope est l’outil le plus utilis´e pour l’auscultation pulmonaire ; il permet aux sp´ecialistes d’´ecouter les sons respira-toires du patient pour un usage compl´ementaire. En d´epit de ses avantages, l’interpr´etation des sons fournis par le st´ethoscope repose sur la perception auditive et l’expertise du m´edecin. L’asthme est une maladie respiratoire caract´eris´e par la pr´esence d’un son musical (sibilant) superpos´e aux sons respiratoires normaux.
Dans la premi`ere ´etape du projet, nous proposons une ´etude comparative des techniques de classification les plus pertinentes : le k-plus proches voisins (k-NN), la machine `a vecteurs de support (SVM) et le perceptron multicouche (MLP). Nous utilisons pour l’extraction des caract´eristiques des sons respiratoires : les coefficients cepstraux `a l’´echelle de Mel (MFCC) et la transform´ee par paquets d’ondelettes (WPT). Des ´etapes de pr´etraitement ont ´et´e ap-pliqu´ees aux signaux respiratoires qui ont ´et´e ´echantillonn´es `a la fr´equence de 6000 Hz et segment´es en utilisant des fenˆetres de Hamming de 1024 ´echantillons.
Dans la deuxi`eme ´etape, nous proposons d’impl´ementer sur le circuit de r´eseau de portes logiques programmables (FPGA) un d´etecteur automatique des sibilants permettant aux sp´ecialistes de disposer d’une source d’information fiable qui peut les aider `a ´etablir un diagnostic pertinent de la maladie d’asthme. L’architecture mat´erielle propos´ee, bas´ee sur la combinaison MFCC-SVM, a ´et´e impl´ement´ee en utilisant l’outil de programmation haut-niveau g´en´erateur syst`eme de XILINX (XSG) et le kit de d´eveloppement ML605 construit autour du circuit FPGA Virtex-6 XC6VLX240T. La phase d’apprentissage du classificateur SVM est faite sur le logiciel MATLAB alors que la phase de test est r´ealis´ee avec XSG.
Les r´esultats de classification des sons respiratoires fournis par l’outil XSG sont simi-laires `a ceux produits par le logiciel MATLAB. Concernant l’´etude comparative de techniques de classifications, la combinaison MFCC-MLP a pr´esent´e le meilleur r´esultat de classifica-tion avec un taux de reconnaissance de 86.2 %. L’´evaluaclassifica-tion des diff´erentes combinaisons est r´ealis´ee avec les param`etres de sp´ecificit´e et de sensitivit´e issues de la matrice de confusion.
Mots cl´es : Sons respiratoires, MFCC, SVM, XSG, Classifications, Sibilants, FPGA, k-NN, MLP, WPT.
ABSTRACT
Identification of normal and abnormal lung sounds is an important operation for pul-monary medical diagnosis. Nowadays, stethoscope is the most used tool for pulpul-monary aus-cultation ; it allows experts to hear the patient’s respiratory sounds for complementary use. Despite its advantages, the interpretation of sounds provided by the stethoscope is based on the sense of hearing and the expertise of the doctor. Asthma is a respiratory disease charac-terized by the presence of a musical sound (wheezing) superimposed on normal respiratory sounds.
First, we propose a comparative study between the most relevant classification tech-niques : k-Nearest Neighbor (k-NN), the Support Vector Machine (SVM) and the Multi-layer perceptron (MLP). The feature extraction techniques used are : Mel-Frequency Cepstrum Co-efficients (MFCC) and the Wavelet Packet Transform (WPT). Preprocessing steps have been applied to the respiratory sounds that have been sampled at 6000 Hz and segmented using Hamming window of 1024 samples.
In a second step, we propose to implement on the FPGA (Field Programmable Gate Array) circuit an automatic wheezes detector, allowing specialists to have a reliable source of information, which can help them to establish an accurate diagnosis of the asthma disease. The proposed hardware architecture, based on MFCC-SVM combination, was implemented using the high-level programming tool XSG (Xilinx System Generator) and the ML605 deve-lopment kit build around the Virtex-6 XC6VLX240T FPGA chip. The learning phase of the SVM classifier is made on the MATLAB software while the test phase is carried out using XSG.
Classification results of the respiratory sounds provided by XSG are similar to those produced by the MATLAB software. Regarding the comparative study of the classification techniques, the combination MFCC-MLP presented the best classification result with a re-cognition rate of 86.2 %. The evaluation of different combinations is carried out with the specificity and sensitivity parameters, which present the outcome of confusion matrix.
Keywords : Respiratory sounds, MFCC, SVM, XSG, Classifiers, Wheezing, FPGA, k-NN, MLP, WPT.
TABLE DES MATI `ERES
REMERCIEMENTS . . . ix
R ´ESUM ´E . . . xi
ABSTRACT . . . xiii
TABLE DES MATI `ERES . . . xv
LISTE DES TABLEAUX . . . xix
LISTE DES FIGURES . . . xxi
LISTE DES ABR ´EVIATIONS . . . .xxiii
INTRODUCTION G ´EN ´EERALE . . . 1
0.1 Etat de l’art . . . .´ 1
0.2 Nomenclature et classification des sons respiratoires . . . 2
0.2.1 Sons respiratoires normaux . . . 2
0.2.2 Sons respiratoires adventices (pathologiques) . . . 3
0.3 Probl´ematique de recherche . . . 4
0.4 Objectifs . . . 5
0.5 Hypoth`eses . . . 5
0.6 M´ethodologie . . . 6
0.6.1 Etude des di´ ff´erentes m´ethodes d’identification des sibilants . . . 6
0.6.2 Impl´ementation mat`erielle d’un d´etecteur de sibilants . . . 8
0.7 Contributions . . . 9
0.8 Organisation du m´emoire . . . 9
ARTICLE 1 COMPARATIVE STUDY OF RESPIRATORY SOUNDS CLASSIFICATION USING DIFFERENT LEARNING MACHINES . . . 11
1.1 R´esum´e en franc¸ais du premier article . . . 11
1.2 Abstract . . . 12
1.3 Introduction . . . 12
1.4.1 Mel-Frequency Cepstral Coefficients (MFCC) . . . 14
1.4.2 Wavelet Packet Transform (WPT) . . . 16
1.5 Learning Machines . . . 18
1.5.1 k-Nearest Neighbor (k-NN) . . . 18
1.5.2 Support Vector Machine (SVM) . . . 20
1.5.3 Multi-layer perception (MLP) . . . 25
1.6 Methodology . . . 28
1.7 Results and discussion . . . 29
1.7.1 Experimentation Protocol . . . 29
1.7.2 Database . . . 30
1.7.3 Results and discussion . . . 30
1.8 conclusion . . . 34
ARTICLE 2 FPGA IMPLEMENTATION OF AN AUTOMATIC WHEEZES DETECTOR BASED ON THE COMBINATION OF MFCC AND SVM TECHNIQUES . . . 37
2.1 R´esum´e en franc¸ais du deuxi`eme article . . . 37
2.2 Abstract . . . 39
2.3 Introduction . . . 39
2.4 Feature Extraction . . . 41
2.4.1 Signal windowing . . . 42
2.4.2 Fast Fourier Transform . . . 42
2.4.3 Mel-Frequency Spectrum . . . 43
2.4.4 Logarithmic energy spectrum . . . 44
2.4.5 Discret cosine transform . . . 44
2.5 Classifier . . . 44
2.6 FPGA Architecture Design . . . 49
2.7 Results and Discussion . . . 54
2.7.1 Database . . . 54
xvii
2.7.3 Simulation of XSG blocks . . . 55
2.7.4 Hardware Co-Simulation . . . 58
2.7.5 Classification Accuracy . . . 58
2.7.6 Simulation results using XSG blockset and MATLAB . . . 59
2.8 Conclusion . . . 62
CONCLUSION G ´EN ´ERALE . . . 63
LISTE DES TABLEAUX
1.1 Database characteristics for normal and wheezing sounds. . . 30
1.2 Confusion matrix of k-NN classifier with different k values. . . 31
1.3 Confusion matrix of SVM classifier with different kernel types. . . 31
1.4 Confusion matrix of MLP classifier with different numbers of hidden neurons. 31
2.1 Computed SVM parameters as reported by LIBSVM . . . 50
2.2 Resource utilization and maximum operating frequency of the Virtex-6 Chip, as reported by Xilinx ISE Design Suite 13.4. . . 50
2.3 Database characteristics for normal respiratory sounds and asthmatics. . . 54
2.4 Performances obtained with XSG and MATLAB based implementations. . . 59
LISTE DES FIGURES
0.1 Repr´esentation dans le domaine temps (haut) et sous forme de spectrogramme
(bas) d’un son respiratoire normal. . . 3
0.2 Repr´esentation dans le domaine temps et sous forme de spectrogramme de sons respiratoires adventices continus. . . 4
0.3 Principe de classification des sons respiratoires. . . 7
1.1 Normal and wheezing respiratory sounds and their associated spectrograms. . 13
1.2 Block diagram for Mel-frequency cepstral coefficient (MFCC) feature extrac-tion. . . 15
1.3 Wavelet Packet Transform for a 2-level decomposition tree. . . 17
1.4 Optimal separating hyperplane and support vectors. . . 21
1.5 Kernel transform for two classes. . . 23
1.6 Multi-Layer Perception network architecture. . . 26
1.7 Respiratory sounds classification method. . . 28
1.8 Sensitivity (SE) obtained with different combinations. . . 32
1.9 Specificity (SP) obtained with different combinations. . . 33
1.10 Total accuracy (TA) obtained with different combinations. . . 34
2.1 Algorithm of the feature extraction technique MFCC. . . 42
2.2 A bank of 24 triangular band-pass filters with Mel-scale distribution. . . 43
2.3 Maximum margin hyperplane for an SVM trained with samples from two classes. . . 45
2.4 MFCC-SVM architecture based on XSG blockset for the automatic wheezes detector. . . 51
2.5 MFCC feature extraction technique architecture based on XSG blockset. . . . 52
2.7 Response signals obtained during the characterization/classification of respi-ratory sounds. . . 56
2.8 Feature extraction vectors based on MFCC technique obtained with MAT-LAB implementation and fixed-point XSG implementation . . . 57
2.9 The hardware co-simulation of the MFCC-SVM classifier. . . 58
2.10 Classification of normal and wheezing respiratory sounds into normal and wheezing frames. . . 61
LISTE DES ABR ´EVIATIONS
ANN Artificial Neural Network. R´eseau de neurones artificiels. FFT Fast Fourier Transform.
Transform´ee de Fourier rapide. FPGA Field Programmable Gate Array.
R´eseau de portes logiques programmables. GMM Gaussian Mixture Model.
Mod`ele de M´elange de Gaussiennes. k-NN k-Nearest Neighbor.
k-plus proches voisins.
MFCC Mel-Frequency Cepstrum Coefficients. Coefficients cepstraux `a l’´echelle de Mel. MLP Multi Layer Perceptron.
Perceptron multi-couches. RBF Radial Basis Function.
Fonction radiale de base.
STFT Short Time Fourier Transform. Transform´ee de Fourier `a court terme. SVM Support Vector Machine.
Machine `a vecteurs de support.
VHDL Very high speed integrated circuit Hardware Description Language.
Langage de description de mat´eriel pour circuits `a tr`es haute vitesse d’int´egration. WPT Wavelet Packet Transform.
XSG Xilinx System Generator. G´en´erateur Syst`eme de XILINX.
INTRODUCTION G ´EN ´ERALE
0.1
Etat de l’art
´
Les maladies respiratoires sont parmi les causes les plus fr´equentes de morbidit´e et de mortalit´e `a travers le monde (Billionnet, 2012). D’apr`es les estimations de l’OMS (Organi-sation Mondiale de Sant´e), il y a plus 235 millions d’asthmatiques dans le monde (Boulet et al., 2014). Cette maladie chronique se manifeste par des crises s´ev`eres accompagn´ees de sensations de suffocation, d’essoufflement et peut engendrer dans certains cas une perte de contrˆole. Ainsi, des travaux de recherche ont ´et´e consacr´es afin d’am´eliorer le diagnostic et la surveillance de cette maladie par le d´eveloppement des techniques de l’auscultation pulmo-naire.
Au cours des derni`eres ann´ees, les techniques de traitement de signal ont ´evolu´e de fac¸on tr`es rapide, que ce soit dans les domaines de reconnaissance de la parole, de la re-connaissance de formes ou dans le domaine biom´edical comme l’analyse des sons respira-toires et de l’´electrocardiographie (ECG). La combinaison entre l’auscultation pulmonaire, les techniques de communication r´ecentes et les outils avanc´ees pour le traitement du signal fournissent aux m´edecins une source d’information suppl´ementaire `a celle du st´ethoscope traditionnel.
De nombreuses m´ethodes ont ´et´e utilis´ees par les chercheurs au cours des trois derni`eres d´ecennies pour traiter les sons respiratoires afin d’identifier les sons pathologiques ( Shaha-rum et al., 2012). Nous pouvons citer quelques combinaisons de techniques d’extraction de caract´eristiques et de classificateurs qui ont ´et´e document´ees dans la litt´erature : les coe ffi-cients cepstraux `a l’echelle de Mel (MFCC) combin´es avec la machine `a vecteurs de support (SVM), le k-plus proches voisins (k-NN) (Palaniappan et al.,2014) et le mod`ele de m´elange de gaussiennes (GMM) (Bahoura and Pelletier, 2004). La transform´ee par paquets
d’on-delettes (WPT) a ´et´e utilis´ee avec le r´eseau de neurones artificiels (ANN) (Kandaswamy et al., 2004; Bahoura, 2009), ainsi que d’autres combinaisons ont ´et´e pr´esent´ees dans la litt´erature (Bahoura, 2009; Palaniappan et al., 2013). Parmi ces techniques, la combinaison MFCC-SVM a ´et´e appliqu´ee pour d´etecter les sibilants chez les patients asthmatiques ; elle a d´emontr´e une pr´ecision sup´erieure `a 95 % (Mazic et al.,2015).
Le d´eveloppement d’outils de reconnaissance ou de classification des sons respiratoires conduit `a des techniques de traitement de plus en plus complexes. Le fonctionnement en temps-r´eel de ces algorithmes n´ecessite une impl´ementation mat´erielle sur circuits program-mables de types DSP (Digital Signal Processor) ou FPGA (Field Programmable Gate Array). Malgr´e que plusieurs achitectures mat´erielles a ´et´e propos´ees dans la litt´erature pour les al-gorithmes de reconnaissance/classification (Wang et al.,2002;Amudha and Venkataramani,
2009; EhKan et al., 2011; Mahmoodi et al., 2011; Manikandan and Venkataramani, 2011;
Ramos-Lara et al.,2013;Pan and Lan,2014), nous trouvons un seul syst`eme `a base de circuit DSP (Alsmadi and Kahya, 2008) a ´et´e propos´e pour la classification des sons pulmonaire et deux autres `a base de circuit FPGA pour la caract´erisation (Bahoura and Ezzaidi,2013) et la d´etection des sibilants (Lin and Yen,2014).
0.2
Nomenclature et classification des sons respiratoires
Les sons respiratoires sont divis´es en deux classes : sons respiratoires normaux et sons respiratoires pathologiques. Les sons respiratoires anormaux (adventices) sont r´epartis en deux sous-classes de sons : continus et discontinus.
0.2.1
Sons respiratoires normaux
Deux sons respiratoires symbolisent le passage normal de l’air ambiant inspir´e `a travers le conduit respiratoire : les sons trach´eo-bronchiques, entendus dans la trach´ee du larynx ou
3
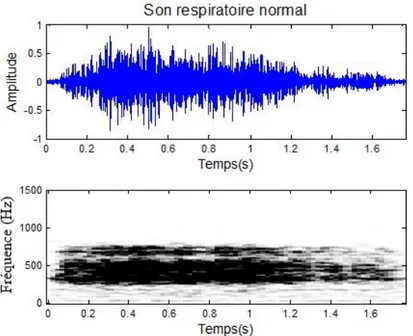
sur les grandes voies a´eriennes, et les sons v´esiculaires, obtenus sur la surface thorique ( Pel-letier, 2006). Le premier son respiratoire normal est un son rˆapeux de grande intensit´e et continu, entendu `a la fois lors de l’inspiration et de l’expiration, le second son respiratoire nor-mal est un murmure continu, moelleux et de faible intensit´e, entendu durant toute l’inspiration et seulement au d´ebut de l’expiration (Laennec, 1819). La figure 0.1 est une repr´esentation du son respiratoire normal dans le domaine temps et sous forme de spectrogramme.
Figure 0.1: Repr´esentation dans le domaine temps (haut) et sous forme de spectrogramme (bas) d’un son respiratoire normal.
0.2.2
Sons respiratoires adventices (pathologiques)
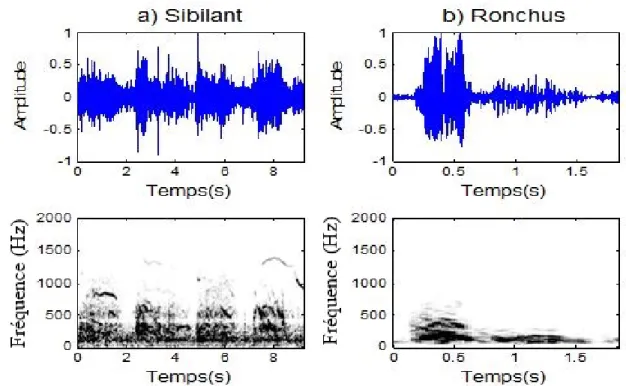
Les sons respiratoires adventices (pathologiques) sont des sons surajout´es aux sons respiratoires normaux qui marquent un dysfonctionnement du syst`eme respiratoire ou des inflammations. Ils sont subdivis´es en deux classes selon leurs formes d’ondes : sons patholo-giques continus et sons patholopatholo-giques discontinus. Nous nous int´eressons dans ce projet `a la classe des sons respiratoires pathologiques continus qui contient les sibilants et les ronchus. Il
s’agit de sons `a caract`ere musical, g´en´eralement de forte amplitude, produits lors d’une obs-truction s´ev`ere provoquant des contacts entre les parois bronchiques. Selon CORSA (Com-puterized Respiratory Sound Analysis), la dur´ee de ces sons est sup´erieure `a 250 ms. Ils ont une plage de fr´equence variable, la fr´equence dominante du sibilant est sup´erieure `a 400 Hz alors que celle du ronchus ne d´epasse pas 200 Hz (Pelletier,2006).
La figure 0.2 est une repr´esentation dans le domaine temps et sous forme de spectro-gramme de sons adventices continus (sibilants, ronchus).
Figure 0.2: Repr´esentation dans le domaine temps et sous forme de spectrogramme de sons respiratoires adventices continus : a) sibilant et b) ronchus.
0.3
Probl´ematique de recherche
En d´epit de ses avantages, l’analyse automatique des sons respiratoires n’a pas encore ´evolu´e pour atteindre `a son utilisation clinique. La complexit´e des sons respiratoires, la
di-5
versification des syst`emes d’acquisition (sites de prise de son, type de capteur, fr´equences de filtrage, etc.), et l’absence ou la non disponiblit´e de base de donn´ees de r´eference rend difficile la comparaison entre les m´ethodes propos´ees par les diff´erents chercheurs.
D’autre part, l’impl´ementation mat´erielle des techniques de reconnaissance/classification de sons respiratoires en vue d’un traitement temps-r´eel constitue encore un grand d´efit pour les chercheurs. La transcription des codes d´evelopp´es sous MATLAB en une architecture impl´ementable sur un circuit FPGA n´ecessite g´en´eralement un r´eam´enagement (r´eadaptation) de ces codes.
La probl´ematique du recherche consiste `a concevoir un outil d’identification en temps-r´eel des sibilants dans les sons respiratoires des patients asthmatiques. Ce syst`eme peut aussi servir comme un instrument `a usage domestique pour aider `a l’´evaluation et le suivi de l’´etat des patients `a moindres frais.
0.4
Objectifs
Ce projet de recherche a deux principaux objectifs :
1. ´Elaborer une ´etude comparative des techniques de reconnaissance/classification les plus utilis´ees pour la classification des sons respiratoires, afin d’identifier la m´ethode la mieux adapt´ee `a la d´etection des sibliants.
2. Concevoir un syst`eme de classification capable de discriminer en temps-r´eel les sibilants des sons respiratoires normaux.
0.5
Hypoth`eses
1. Parmi les techniques de reconnaissance/classification, il faut se limiter `a celles qui ont fait leur preuve dans le domaine de la reconnaissance automatique de la parole. En fait, les sons respiratoires ressemblent `a un certain niveau aux signaux de parole.
2. Comme solution mat´erielle, choisir les circuits FPGA qui combinent les performances (parall`elisme) des circuits ASIC (Application Specific Integrated Circuit) et la flexibilit´e de programmation des circuits DSP (Digital Signal Processor).
0.6
M´ethodologie
Afin d’atteindre les objectifs de cette recherche, nous utilisons des syst`emes de classi-fication appropri´es pour l’´etudes des sons respiratoires. Ces syst`emes fonctionnent en deux phases : phase d’apprentissage et phase de test, comme le montre la figure0.3. `A partir d’une base de donn´ees contenant des sons respiratoires normaux et pathologiques et en utilisant une technique d’extraction des caract´eristiques, chaque segment temporel des signaux `a analyser sera repr´esent´e par quelques param`etres dans l’espace des caract´eristiques. Pendant la phase d’apprentissage, ces donn´ees permettent d’obtenir un mod`ele pour chaque classe de sons. Lors de la phase de test et apr`es extraction du vecteur de caract´eristique du segment de test, le classificateur prend la d´ecision d’appartenance en se basant sur la ressemblance entre le mod`ele de la classe ´etabli au cours de l’apprentissage et le vecteur caract´eristique du segment test´e.
0.6.1
Etude des di
´
ff´erentes m´ethodes d’identification des sibilants
L’extraction des caract´eristiques d’un signal est un processus qui permet de r´eduire la dimension du signal tout en capturant l’information pertinente. Il peut ˆetre consid´er´e comme
7
Figure 0.3: Principe de classification des sons respiratoires.
une projection dans l’espace de donn´ees :
ϕ : RN
→ RK (N >> K) (0.1)
o`u N et K repr´esentent respectivement les dimensions de l’espace de donn´ees avant et apr´es l’extraction des caract´eristiques. Cette transformation se base sur deux ´etapes. D’abord, le signal est divis´e en segments temporels contenant un nombre d’´echantillons correspondant `a largeur du fenˆetre choisie pour le traitement du son. Ensuite, en appliquant la technique d’extraction des caract´eristiques, chaque segment temporel sera caract´eris´e par un vecteur de caract´eristiques contenant l’information essentielle du signal.
Dans ce projet de recherche, nous proposons d’utiliser deux techniques pour l’extrac-tion des caract´eristiques :
— Transform´ee par paquets d’ondelettes (WPT).
Pour la phase de calssification, nous faisons appel aux techniques li´ees `a la probl´ematique de la reconnaissance des sons respiratoires. Parmi les algorithmes de classification les plus pertinents, nous proposons de tester :
— Perceptron multicouche (MLP) ; — Machine `a vecteurs de support (SVM) ; — k-plus proches voisins (k-NN).
0.6.2
Impl´ementation mat`erielle d’un d´etecteur de sibilants
Les circuits FPGA se programment `a la base, `a l’aide d’un langage HDL (hardware description language), tels que VHDL ou Verilog. Cepeandant, il existe des langages de pro-grammation de haut-niveau d’abstraction qui permettent de sauver beaucoup de temps dans la phase de d´eveloppement. Dans ce projet, nous avons choisi d’utiliser l’outil de program-mation XSG (Xilinx System Generator) qui nous permet de tirer profil de l’environement de simulation de MATLAB/SIMULINK. L’outil XSG dispose d’une librairie SIMULINK mod´elisant, au bit et au cycle pr`es, les fonctions arithm´etiques et logiques, les m´emoires et des fonctions de traitement de signal. Il inclut aussi un g´en´erateur de code HDL automatique pour les circuits FPGA de XILINX.
L’architecture mat´erielle propos´ee est une combinaison de la technique d’extraction des caract´eristiques par MFCC et de la technique de classification par SVM. Elle se base sur les architectures mat´erielles propos´ees pour le calcul des coefficients MFCC (Bahoura and Ezzaidi,2013) et l’utilisation de la machine SVM (Mahmoodi et al.,2011).
9
0.7
Contributions
La premi`ere contribution de ce m´emoire est l’´etude compartive de plusieurs m´ethodes de classification des sons respiratoires en optimisant les param`etres de chaque technique. Les r´esultats (Article 1) seront soumis au moins `a une conf´erence.
La seconde contribution est l’architecture mat´erielle MFCC-SVM, impl´ement´ee sur cir-cuit FPGA. Une description d´etaill´ee (Article 2) sera tr`es prochainement soumise `a un journal sp´ecialis´e. Une version abr´eg´ee de son fonctionnement a ´et´e publi´ee dans la 2e conf´erence ATSIP :
— O. Boujelben and M. Bahoura, ”FPGA implementation of an automatic wheezes detector based on MFCC and SVM,” 2016 2nd International Conference on Advanced Technolo-gies for Signal and Image Processing (ATSIP), Monastir, 2016, pp. 647-650.
Ce syst`eme peut mener `a un instrument embarqu´e de t´el´e-surveillance de la fonction respiratoire chez les malades asthmatiques, permettant ainsi l’´evaluation et le suivi de l’´etat des patients en temps-r´eel.
0.8
Organisation du m´emoire
Ce m´emoire en format d’articles comprend trois chapitres. Le premier chapitre pr´esente une ´etude comparative des m´ethodes de classification des sons respiratoires en utilisant diff´erentes combinaisons. Le deuxi`eme chapitre concerne l’impl´ementation mat´erielle sur circuit FPGA d’un syst`eme de d´etection des sibilants bas´e sur la combinaison MFCC-SVM. Le dernier chapitre pr´esente la conclusion g´en´erale ainsi que les perspectives de recherche.
ARTICLE 1
COMPARATIVE STUDY OF RESPIRATORY SOUNDS CLASSIFICATION USING DIFFERENT LEARNING MACHINES
1.1
R´esum´e en franc¸ais du premier article
Les machines `a apprentissage sont des outils performants de classification des formes, particuli`erement dans le domaine de traitement de signal. Dans ce premier article, nous nous int´eressons `a l’´etude et `a la comparaison de plusieurs machines `a apprentissage. Ces machines sont obtenues par des combinaisons de m´ethodes de caract´erisation et de classification afin de reconnaˆıtre les sibilants dans les sons respiratoires.
Pour extraire les caract´eristiques des sons respiratoires, nous proposons d’utiliser les coefficients cepstraux `a l’´echelle de Mel (MFCC) et la transform´ee par paquets d’ondelettes (WPT). Nous utilisons la machine `a vecteurs de support (SVM), les k-plus proches voisins (k-NN) et le perceptron multicouche (MLP) comme classificateurs. Les r´esultats des tests r´ev`elent que le meilleur taux de reconnaissance de 86.2 % est obtenu par la combinaison MFCC-MLP.
Ce premier article, intitul´e “ ´Etude comparative de la classification des sons respira-toires utilisant diff´erentes machines `a apprentissage”, fut cor´edig´e par moi-mˆeme ainsi que par le professeur Mohammed Bahoura. En tant que premier auteur, ma contribution `a ce travail fut l’essentiel de la recherche sur l’´etat de l’art, le d´eveloppement de la m´ethode, l’ex´ecution des tests de performance et la r´edaction de l’article. Le professeur Mohammed Bahoura, second auteur, a fourni l’id´ee originale. Il a aid´e `a la recherche sur l’´etat de l’art, au d´eveloppement de la m´ethode ainsi qu’`a la r´evision de l’article.
1.2
Abstract
A comparative study of different learning machines to classify respiratory sounds in two categories (normal and wheezing) is presented. The lung sounds are described by two fea-ture extraction techniques: Mel-frequency cepstral coefficients (MFCC) and wavelet packet transform (WPT). As classifier, we use the k-nearest neighbor (k-NN), support vector ma-chine (SVM) and multi-layer perceptron (MLP). In order to evaluate the performance of these combinations, we use a database composed of 24 respiratory sounds records: 12 are obtained from normal subjects and 12 records are obtained from asthmatic subjects. The test results reveal that the highest recognition rate is obtained by the combination MLP-MFCC with an accuracy of 86.2 %.
Key words: Respiratory Sounds, Classification, WPT, MFCC, Learning machine, k-NN, MLP.
1.3
Introduction
Pulmonary auscultation is an inexpensive and noninvasive medical examination tech-nique that allows physicians to diagnose various respiratory disorders. The acoustic stetho-scope has been proposed in 1816 to listen to lung and heart sounds, where the first attempt was realized by Dr. Ren´e Laennec who formed a notebook roller and apply one end on the patient’s chest (Pasterkamp et al.,1997).
Lung sounds are divided into normal and adventitious classes. Adventitious (or patho-logical) respiratory sounds are even divided into continuous and discontinuous. Normal sounds present normal progression of the ambient air breathed across the respiratory tract. Pathological respiratory sounds are added to the normal lung sounds, they usually mark a dysfunction of the respiratory system or inflammation. These different respiratory sounds are classified according to their temporel and spectral characteristics. As shown in Fig. 1.1,
13
normal sounds are characterized by a dominant frequency ranging from 37.5 Hz to 1000 Hz (Palaniappan et al., 2014). Wheezing sounds belong with continuous adventitious respira-tory sounds, their duration is more than 250 ms and their frequency range is greater than 400 Hz (Sovijarvi et al.,2000). These sounds with musical character usually have high amplitude.
Figure 1.1: Normal (a) and wheezing (b) respiratory sounds and their associated spectrograms (c) and (d), respectively.
Nowadays, researchers emphasize a great importance to classify respiratory sounds us-ing new signal processus-ing techniques. In fact, some scientists consider that the stethoscope is an unreliable acoustic instrument, because it can amplify or attenuate sounds in the spectrum range of scientific concern (Pasterkamp et al.,1997). Moreover, pulmonary auscultation is a subjective process, it is based on the physician’s expertise, personal experience as well as on his own hearing to distinguish the variety of sounds.
In pattern recognition field, the machine learning algorithms are widely used to clas-sify different patterns database. Different feature extraction techniques and classifiers are used in the literature. Linear predictive coding (LPC) (Sankur et al., 1994), Fourier trans-form (FT) (Bahoura,2009;Tocchetto et al., 2014), wavelet transform (WT) (Bahoura,2009;
Tocchetto et al.,2014), and Mel-frequency cepstral coefficients (MFCC) (Mazic et al.,2015;
k-nearest neighbor (k-NN) (Chen et al.,2015;Palaniappan et al.,2014), artificial neural net-works (ANN) (Bahoura,2009;Tocchetto et al.,2014) and gaussian mixture models (GMM) ( Pel-letier,2006) have been used for respiratory sounds classification.
In this paper, we use two features extraction techniques: Mel-frequency cepstral coef-ficients (MFCC) and the technique wavelet packet transform (WPT) using statistical features for classification. As classifier, we use the k-nearest neighbor (k-NN), support vector ma-chine (SVM) and multi-layer perceptron (MLP). Finally, we propose a comparative study of different combinations of feature extraction techniques and machine learning classifiers.
1.4
Feature extraction
The feature extraction technique allows the selection of essential characteristic infor-mation from the analysed sound, which also reduces its vectors’ dimension. In this research, we use two feature extraction techniques to characterize respiratory sounds: Mel-frequency cepstral coefficients (MFCC) and the wavelet packet transform (WPT) using statistical fea-tures.
1.4.1
Mel-Frequency Cepstral Coe
fficients (MFCC)
Mel-frequency cepstral coefficients (MFCC) present the cepstral coefficients across the Mel-scale. This feature extraction tool is extensively used in audio pattern recognition sys-tems. The first step to obtain the MFCC coefficients is to segment the input signal s(n) into successive frames of N samples using the following equation:
si(n)= s(n)wi(n) (1.1)
15
Figure 1.2: Block diagram for Mel-frequency cepstral coefficient (MFCC) feature extraction.
As shown in Fig.1.2, the short-time Fourier transform (STFT) of the segmented signal si(n) is calculated, then the energy spectrum |Si(k)|2 is computed. The energy spectrum is filtered by a Mel-scaled triangular band-pass filters. The Mel-scale can be approximated to the following equation:
Mel( f )= 2595 log10(1+ f
700) (1.2)
A logarithm function is applied to the filter outputs Ei(l) in order to compress their dynamic range. The output of the logarithmic function ei(l) is defined by Eq.1.3.
The obtained MFCC coefficients are obtained by back-transformation in time domaine using discrete cosine transform (DCT)
ci(n)= P X
l=1
ei(l)cos(n(l − 0.5)π/P) (1.4)
where (n= 0, 1, ..., M − 1) is the index of the cepstral coefficient, M is the number of desired MFCC coefficients and l present the index of the triangular band-pass filter (1 ≤ l ≤ P). In this research we use 14 triangular band-pass filter (P = 14). Since the coefficients ci(0) and ci(1) are often ignored because they represents the mean value of the input signal (Bahoura
and Ezzaidi,2013), the feature extraction vector is composed by 12 coefficients.
For a given frame m, the feature vector constructed from the MFCC coefficients (Eq.1.4) is given by:
xm= [c(2), c(3), ..., c(13)]T (1.5)
1.4.2
Wavelet Packet Transform (WPT)
The wavelet transform (WT) is widely used in signal analysis, because it provides a simultaneous time and frequency representation of signals. This decomposition conserves the important characteristics of signal (Tocchetto et al., 2014). The wavelet packet trans-form (WPT) provides a multichannel filtering analysis, where the number of filters and their frequency-bands depends on the level tree (Bahoura,2009). It can be seen as an extension of the wavelet transform (WT). Fig.1.3presents a 2-level WPT decomposition tree for a signal x(n) of length N.
The wavelet packet coefficients are defined by wi
k(n), where i is the level of decompo-sition, k represents the frequency subband index and n = 0, ...,2Ni − 1 is the time index. The wavelet packet coefficients for even and odd subband k are given by equations (1.6) and (1.7), respectively.
17
Figure 1.3: Wavelet Packet Transform for a 2-level decomposition tree.
wi2p+1(n) =X m h(m − 2n)wip(m) (1.6) wi2p+1+1(n) =X m g(m − 2n)wip(m) (1.7)
where p= 0, ..., 2i−1 represents the subband of level i, h and g are the low-pass and high-pass filters, respectively.
In this study, the respiratory signals is uniformly divided into overlapped (50 %) seg-ments, 1024 samples each. For each segment, the signal will be decomposed down to the sixth level (i= 6) of the wavelet packet decomposition tree, which leads to 64 packets. For a sampling frequency of 6000 Hz, the bandwidth of each node of the wavelet packet decompo-sition tree is 46.875 Hz. Since the lung sounds frequency spectrum ranges from 50 to 1000 Hz (Kandaswamy et al.,2004), we select for the feature extraction vector from the 2nd node to the 22thnode of the wavelet decomposition, which correspond to the band 46.875-1031.25 Hz.
Different feature extraction functions have been proposed to reduce the dimensional-ity of the transformed signal as mean, standard deviation (Tocchetto et al., 2014) and vari-ance (Gabbanini et al., 2004). In this study, the three statistical functions are tested and the
variance function is chosen as feature extraction technique. In this research, we propose to use the variance feature extraction function based on the wavelet packet transform from the 2nd node to the 22thnode so that the feature extraction vector is composed by 21 coefficients (M = 21).
For a given frame m the feature extraction vector is defined by:
xm = [var(2), var(3), ..., var(22)]T (1.8)
1.5
Learning Machines
The learning machine belongs with the field of artificial intelligence (AI), it gives com-puters the possibility to elaborate analytical model without being explicitly programmed. This model can automatically learn to perform and change according to new data. Di ffer-ent classifiers were proposed in the literature for respiratory sounds classification: support vector machine (SVM) (Mazic et al.,2015;Palaniappan et al., 2014), k-nearest neighbor (k-NN) (Chen et al.,2015;Palaniappan et al.,2014), artificial neural networks (ANN) (Bahoura,
2009;Tocchetto et al.,2014) and gaussian mixture models (GMM) (Pelletier, 2006). In this research, we propose the use of three types of learning machine: k-nearest neighbor (k-NN), support vector machine (SVM) and the multi-layer perceptron (MLP).
1.5.1
k-Nearest Neighbor (k-NN)
The k-nearest neighbor (k-NN) is a supervised learning machine that allows to map a new observation x from the D-dimensional feature vectors space to its desired class from [w1, ..., wK], where K is the number of classes (Kozak et al.,2006). The classification problem in a supervised classifier is defined by a labeled training set of n observations as described in
19
Eq.1.9:
On = {(x1, w1), (x2, w2), ..., (xn, wn)} (1.9) where xiare the feature vectors and withe associated scalar labels. For a given query instance x, the k-NN algorithm place a cell volume V around x to captures k prototypes. We denote by kjthe number of samples labeled wjcaptured by the cell, so the captured k prototypes can be defined by the following equation:
k= K X
j=1
kj (1.10)
The joint probability can be calculated as (Bahoura and Simard,2012) :
pn(x, wj)= kj/V
k (1.11)
The Eq.1.11is used to provide a reasonable estimate of the posterior probability
pn(wj|x) = pn(x, wj) PK j=1pn(x, wj) = kj k (1.12)
To estimate the class w for a new feature vector x, the k-NN uses the majority of vote among the kjobjects neighboring the new data:
w= arg max
1≤ j≤K{kj} (1.13)
In this study, the analyzed respiratory sound is segmented uniformly to M overlapped frames so that the corresponding feature vectors sequence X = [x1, x2, ..., xM] is predicted into the class w by the following equation:
w= arg max
1≤ j≤K{ ¯kj} (1.14)
where the mean values ¯kjare computed over the M frames.
¯ kj = 1 M M X i=1 ki, j (1.15)
In this research, the classification of unknown sound is made segment-by-segment (M = 1).
1.5.2
Support Vector Machine (SVM)
Since the 1900s, the support vector machine (SVM) technique is used to solve classifi-cation and regression problems (Vapnik, 1998). This learning algorithm is adopted for both binary and multiclass data. The SVM technique separates new data based on a predicted model which is generated during the training phase. Consider SVM for binary classification, a labeled training set of n observations as mentioned in Eq.1.16:
On = {(x1, y1), (x2, y2), ..., (xn, yn)} (1.16)
where xi are the feature vectors and yi ∈ {1, −1} the associated scalar labels. The SVM classifier computes an hyperplane that separates the training data in two sets corresponding to the desired classes. The optimal hyperplane is defined such that: all points labeled -1 are on one side of the hyperplane and all points labeled 1 are on the other side and the distance of the nearest vector of the hyperplane (both classes) is maximum.
This classifier is called support vector machine since the solution only depends on the support vectors. As shown in Fig. 1.4, the instances of the training data the most closest to canonical hyperplanes (H1, H2) are called support vectors (Ertekin, 2009). Where the
21
Figure 1.4: Optimal separating hyperplane and support vectors.
parameters w is the normal vector to the hyperplane, b is the bias, || w || is the euclidean norm of w and ξ is slack variables representing the data that fall into the margin (Mahmoodi et al.,
2011).
The maximum margin separating hyperplane can be constructed by solving the primal optimization problem in Eq.1.17introduced by (Vapnik,1998).
Minimize {τ(w, ξ)} = 1 2 || w || 2 2 +C n X i=1 ξi (1.17)
subject to :
yi(wTxi+ b) > 1 − ξi ξi > 0
(1.18)
where w is a n-dimensional vector, ξiis a measure of distance between the misclassified point and the hyperplane and C the misclassification penalty parameter dealing between maxi-mization the margin and minimaxi-mization the error. The first term is minimized to control the margin, the aim of the second term is to keep under control the number of misclassified points (Chapelle,2004).
To classify an unknown data x, the decision for the linear SVM classifier is presented by Eq.1.19.
d(x)= sign(wTx+ b) (1.19)
To determinate the parameters w and b, we should first resolve the following dual La-grange problem. Note that the penalty function related to the slack variables is linear, which disappears in the transformation into the dual formulation (Ertekin,2009).
Maximize {Ld(α)} = n X i=1 αi− 1 2 n X j,i=1 αiαjyiyjxTi xj (1.20) subject to : 0 ≤ αi ≤ C n X i=1 αiyi = 0 (1.21)
where αi are Lagrange multipliers, n is the number of samples. The Lagrange multipliers αi are calculated by resolving the Lagrange equation1.20. The parameters w and b can be
23
determined using Eqs.1.22and1.23respectively:
w= S X i=1 αiyixi (1.22) b= yi − wTxi (1.23)
where xi represents the support vectors parameter with i = 1, ..., S and S is the number of the support vectors. The number of the support vectors S presents the number of the training instance that satisfy the primal optimization problem given by Eq.1.17. Geometrically, the support vectors parameter are the closest to the optimal hyperplane H1 and H2 as shown in Fig.1.4.
The SVM technique is a kernel-based learning algorithm. In fact, the use of kernel facilitates the classification of complex data since the concept is based on the research of the similarity between linear and non-linear data according to linear separated data.
Figure 1.5: Kernel transform for two classes (Mahmoodi et al.,2011).
As shown in Fig. 1.5, the SVM technique uses kernel to maps input vectors into a richer feature space containing non linear features and constructs the proper hyperplane for data
separation. In this case the vector x is transformed into ϕ(x) and the kernel function is defined by the following inner product:
k(xi, x) = ϕ(xi)T ×ϕ(x) (1.24)
The decision function in the case of non linear data is defined by Eq.1.25:
d(x)= sign( S X
i=1
αiyiK(xi, x) + b) (1.25)
where the parameter b is given by:
b= yi− S X
i=1
αiyiK(xi, x) (1.26)
To ensure that a kernel function actually corresponds to some feature space, it must be symmetric (N´u˜nez et al.,2002):
K(xi, x) = ϕ(xi) T
×ϕ(x) = ϕ(x) × ϕ(xi)
T = K(x, x
i) (1.27)
The kernel function constructs a different nonlinear decision hypersurface in an input space (Huang et al.,2006). The most commonly used kernel functions are (Zanaty,2012): — Linear kernel: K(xi, x) = xTi x (1.28) — Polynomial kernel: K(xi, x) = (1 + xxTi ) d (1.29) where d is the polynomial degree.
— Radial basis function (RBF) kernel:
25
where γ is a positive parameter controlling the radius.
In this paper, we propose to test the performance of respiratory sounds classification of linear, RBF and polynomial kernels. The accuracy of the classification for the RBF kernel depends on the choice of two parameters ( C and γ). The experiment results reveals that the highest accuracy is obtained for C = 1 and γ = 1. For the polynomial kernel, the order of the polynomial kernel is fixed to d = 4 to get maximum accuracy, and for the linear kernel we fix the parameter C = 1. To classify a new observations xn that is a D-dimensional feature vector. The SVM solves the Eq.1.25and defines the decision of classification dn.
In this research, we classify respiratory sounds in two classes (K = 2), the respiratory sound is segmented uniformly to M overlapped frame so that the corresponding sequence is X = [x1, x2, ..., xM], after solving the Eq.1.25the actual output sequence d = [d1, d2, ..., dM] is obtained. For each output k ∈ [normal, wheezing], the SVM gives a set of M values [dj,k], j= 1, ..., M. The sound class is identified as the reference sound with the largest value of the decision function:
k= arg max 1≤k≤K
{ ¯dk} (1.31)
where the mean values ¯dk are computed over the M frames.
¯ dk = 1 M M X j=1 dj,k k= 1, ..., K (1.32)
In this research, the classification of unknown sound is made segment-by-segment (M = 1).
1.5.3
Multi-layer perception (MLP)
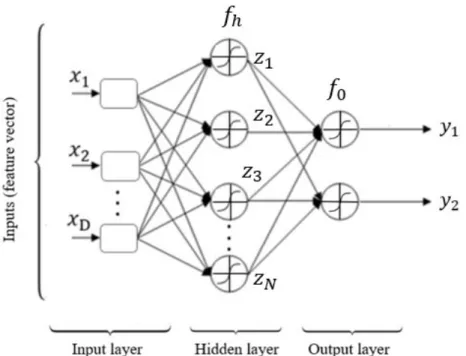
Multi-layer perception (MLP) neural network is inspired from the biological neuron ( Toc-chetto et al.,2014). It is the most used type of feed-forward artificial neural network (ANN) ( Sing-hal and Wu,1988). Fig.1.6presents an example of MLP network characterized by D inputs,
one hidden of N nodes, and K = 2 outputs.
Figure 1.6: Multi-Layer Perception network architecture.
Each node j, in the hidden layer, receives the output of each node i from the input layer through a connection of weight wh
j,i. Eq.1.33 presents the output of the node j in the hidden layer. zj = fh( D X i=0 whj,ixi), j= 1, ..., N (1.33) where fh(.) is is the activation function, x0 = 1, and whj,0is the bias of the jthhidden neuron.
The output produced by the node j, in the output layer, is given by:
yj = fo( N X
i=0
woj,izi), j= 1, ..., K (1.34)
where fo(.) is the transfer function, woj,iis the connection weight, z0 = 1 and woj,0is the bias of the jthoutput neuron.
27
During the training phase, the connection weights w= [whj,i, woj,i] are calculated using a set of inputs for which the desired outputs are known On= [(x1, d1), (x2, d2), ..., (xn, dn)]. The desired outputs dnis presented by K components which represent the number of the reference classes. For each desired vector di, only one component, corresponding to the presented input pattern xi, is set to 1 and the others are set to 0 (Bahoura,2016). The training task is done by using the backpropagation (BP) algorithm (Haykins, 1999). The process should be repeated until an acceptable error rate is obtained or a certain number of iterations (Ni) are completed using training examples (Bahoura,2009).
In this research, the learning rate, the average squared error and the number of iterations (epochs) are fixed to η = 0.01, Eav = 0.001 and Ni = 5000, respectively. As the connections weights wj,iare initialized with random values, the learning and testing process is repeated 50 times and the average value is taken (Bahoura,2009). Also, the feature vector is segmented uniformly to M overlapped frame so that the corresponding X = [x1, x2, ..., xM].
To classify an unknown respiratory sounds, the feature vectors set X is presented to the MLP neural network and produce the output sequence Y = [y1, y2, ..., yM]. For each output k ∈[normal, wheezing], the network provides a set of M values yi,k, i= 1, ..., M. An unknown respiratory sounds is associated to the reference corresponds to the largest mean value of the outputs:
bk= arg max 1≤k≤K{ ¯yk
} (1.35)
where the mean values ¯yk are computed over the M frames.
¯ yk = 1 M M X i=1 yi,k, k = 1, .., K (1.36)
In this paper, the classification of unknown sound is made segment-by-segment (M = 1).
1.6
Methodology
As shown in Fig. 1.7, the process of classification is divided in two phases, training and testing. During the training phase, a model is generated from the feature characteristics vectors of the training data. In order to classify a new test set, the classifier uses both the extracted feature vector and the trained models. Each classifier uses its proper method to predict the class that data set belongs to.
Figure 1.7: Respiratory sounds classification method.
In this study, we suggest to compare possible combination of feature extraction tech-niques (MFCC, WPT) and the selected machine learning classifiers ( k-NN, SVM, MLP).
29
1.7
Results and discussion
In this section, we detail the experimentation protocol and the database used in this research. The classification accuracy of the proposed combinations are also presented.
1.7.1
Experimentation Protocol
The confusion matrix is used to evaluate classification performance. We define the total accuracy (T A) measurement, which can be calculated from the outcome of the confusion matrix:
T A = T N + T P
T N+ FP + T P + FN (1.37)
where T P (true positives), T N (true negatives), FP (false positives), FN (false negatives) are the outcome of confusion matrix. We use also the evaluation parameters sensitivity and speci f icitywhich represent the rate of identification of wheezing and normal sounds, respec-tively. This two quantities are defined by Eqs.1.38and 1.39, respectively:
S ensitivity= T P
T P+ FN (1.38)
S peci f icity= T N
T N + FP (1.39)
In this study, we use the method ”leave-one-out” method, it consists of testing all data sets by using n − 1 records for training and the nthrecord for testing. This process is repeated to all database. For example, when sounds N02-N12 and W02-W12 are used for training, the combination N01-W01 is used for test.
1.7.2
Database
In order to test the classifiers, we use a database composed of 24 records: 12 are ob-tained from healthy subjects and 12 are obob-tained from asthmatic subjects. All respiratory sounds are sampled at 6000 Hz, normalized in amplitude, accentuated and manually labeled. The recording lung sounds are obtained from RALE database-CD, ASTRA database-CD and some websites (Bahoura, 2009). Sounds are uniformly divided into overlapped (50 %) seg-ments, 1024 samples each.
Table 1.1: Database characteristics for normal and wheezing sounds.
Normal respiratory sounds Wheezing respiratory sounds
File name Duration (s) Number of segments File name Duration (s) Number of segments
N01 15.68 183 W01 6.73 77 N02 17.14 199 W02 4.62 53 N03 32.39 378 W03 9.63 111 N04 10.10 117 W04 2.76 31 N05 16.84 196 W05 2.71 30 N06 17.77 207 W06 17.53 204 N07 7.68 88 W07 4.21 48 N08 8.22 94 W08 12.36 143 N09 6.84 179 W09 6.21 71 N10 7.24 183 W10 8.07 93 N11 9.16 106 W11 4.14 47 N12 7.91 91 W12 6.72 77
Total Normal 157.01 1822 Total Wheezes 85,71 985
1.7.3
Results and discussion
In this study, we test the influence of some parameters such as the kernel type for the SVM classifier, the k values for k-NN classifier and the number of hidden neurons (HN) for the MLP classifiers.
31
Table1.2, Table1.3 and Table 1.4present the confusion matrix of the k-NN classifier with different k values, the SVM classifier with different kernel types and the MLP classifier with different numbers of hidden neurons (HN), respectively. It can be noted that for MFCC-MLP and the WPT-MFCC-MLP methods, the learning and the testing process is repeated 50 times to take the mean value for each tested record.
Table 1.2: Confusion matrix of k-NN classifier with different k values.
MFCC-kNN WPT-kNN Assigned CLass k= 1 k= 5 k= 9 k= 1 k= 5 k= 9 N W N W N W N W N W N W True Class N 1660 162 1687 135 1704 118 1637 185 1697 125 1711 111 W 241 744 277 708 292 693 315 670 336 649 362 623
Table 1.3: Confusion matrix of SVM classifier with different kernel types.
MFCC-SVM WPT-SVM
Assigned CLass Linear RBF Polynomial Linear RBF Polynomial
N W N W N W N W N W N W
True Class
N 1602 220 1414 408 1570 252 1710 112 1742 80 1712 110
W 260 725 113 872 230 755 610 375 755 230 588 397
Table 1.4: Confusion matrix of MLP classifier with different numbers of hidden neurons (HN). MFCC-MLP WPT-MLP Assigned CLass HN= 13 HN= 30 HN= 50 HN= 13 HN= 30 HN= 50 N W N W N W N W N W N W True Class N 1630.4 191.6 1625.2 196.8 1630.6 191.4 1636.02 185.98 1626.94 195.06 1644.32 177.68 W 207.8 777.2 212.1 772.9 196.5 788.5 536.54 448.46 500.12 484.88 506.5 478.5
Figure1.8shows the performances of classifiers in term of the sensitivity (SE), where the highest performance was provided by the technique MFCC-SVM using the RBF kernel (SE = 88.50%). For the WPT extraction technique, the highest sensitivity (SE = 68.0%) is given when combined to the k-NN with (k= 1).
Figure 1.8: Sensitivity (SE) obtained with (a) k-Nearest Neighbor (k-NN), (b) Support Vec-tor Machine (SVM) and (c) multi-layer perceptron (MLP) based classification for proposed feature extraction methods.
The specificity results of the different combinations is shown in Fig. 1.9. For the feature extraction technique MFCC, the highest specificity (SP= 93.50%) is given with the classi-fier k-NN with (k= 9). For the WPT technique, the combination WPT-SVM give the highest specificity (SP= 95.60%) with the RBF kernel.
33
Figure 1.9: Specificity (SP) obtained with (a) k-Nearest Neighbor (k-NN), (b) Support Vec-tor Machine (SVM) and (c) multi-layer perceptron (MLP) based classification for proposed feature extraction methods.
As shown in Fig.1.10, the MFCC feature extraction technique offers the highest perfor-mance for the three classifiers. The combination MFCC-MLP gives the highest perforperfor-mance with an accuracy of (TA=86.2%) using 50 neurons. The MFCC-kNN provide an accuracy of (TA=85.6%) with one neighbor (k = 1). The combination MFCC-SVM provide an accuracy of (TA=82.9%) with the polynomial kernel. For the WPT feature extraction the highest ac-curacy is giving with the classifier k-NN for (k= 5) and gives an accuracy of (83.6%). The combination WPT-ANN gives an accuracy of (TA=75.6%) using 50 neurons.
Figure 1.10: Total accuracy (TA) obtained with (a) k-Nearest Neighbor (k-NN), (b) Support Vector Machine (SVM) and (c) multi-layer perceptron (MLP) based classification for pro-posed feature extraction methods.
1.8
conclusion
In this paper, we propose a comparative study of different learning machines for respi-ratory sounds classification. The highest accuracy of 86.2% is obtained by the combination MFCC-MLP. It can be noted that the MFCC feature extraction technique improves the per-formance with the three classifiers.
As future work, we propose to test other combinations and increase the number of classes of respiratory sounds.
35
Acknowledgement
This research is financially supported by the Natural Sciences and Engineering Re-search Council (NSERC) of Canada.
ARTICLE 2
FPGA IMPLEMENTATION OF AN AUTOMATIC WHEEZES DETECTOR BASED ON THE COMBINATION OF MFCC AND SVM TECHNIQUES
2.1
R´esum´e en franc¸ais du deuxi`eme article
Dans cet article, nous proposons une impl´ementation mat´erielle d’un d´etecteur automa-tique des sibilants dans les sons respiratoires. Nous avons s´electionn´e un syst`eme bˆati sur la combinaison de la technique d’extraction des caract´eristiques bas´ee sur les coefficients cep-straux `a l’´echelle de Mel (MFCC) et le classificateur `a base de machine `a vecteurs de support (SVM). L’architecture propos´ee est impl´ement´ee sur circuit FPGA en utilisant l’outil de pro-grammation XSG dans l’environnement MATLAB/SIMULINK et la carte de d´eveloppement ML605 `a base du circuit FPGA Virtex-6 XC6VLX240T. Nous proposons d’utiliser la librairie LIBSVM avec le logiciel MATLAB pour extraire les param`etres de SVM pendant la phase d’apprentissage, tandis que la technique d’extraction des caract´eristiques et la phase de test sont effectu´ees en temps-r´eel sur FPGA. Pour la validation de l’architecture conc¸ue, nous util-isons une base de donn´ees compos´ee de 24 sons respiratoires dont 12 sons respiratoires nor-maux et 12 sons respiratoires contenant des sibilants. L’architecture propos´ee est pr´esent´ee en d´etails dans ce document. Nous pr´esentons ´egalement l’utilisation des ressources et la fr´equence de fonctionnement maximale pour le circuit FPGA Virtex-6 XC6VLX240T. Les performances de classification obtenues avec l’impl´ementation `a virgule fixe de XSG/FPGA et l’impl´ementation la virgule flottante de MATLAB sont pr´esent´ees et compar´ees.
Ce deuxi`eme article, intitul´e “Impl´ementation sur FPGA d’un syst`eme de d´etection des sibilants bas´e sur la combinaison des techniques MFCC et SVM”, fut cor´edig´e par moi-mˆeme ainsi que par le professeur Mohammed Bahoura. En tant que premier auteur, ma contribution
`a ce travail fut l’essentiel de la recherche sur l’´etat de l’art, le d´eveloppement de la m´ethode, l’ex´ecution des tests de performance et la r´edaction de l’article. Le professeur Mohammed Bahoura, second auteur, a fourni l’id´ee originale. Il a aid´e `a la recherche sur l’´etat de l’art, au d´eveloppement de la m´ethode ainsi qu’`a la r´evision de l’article. Une version abr´eg´ee de cet article a ´et´e pr´esent´ee `a la conf´erence ”Conference on Advanced Technologies for Signal and Image Processing, Monastir, (Tunisia) du 21 - 23 March 2016”.
39
2.2
Abstract
In this paper, we propose a hardware implementation of an automatic wheezes detec-tor in respiradetec-tory sounds. We have chosen a system build on the combination of the feature extraction technique based on Mel-Frequency cepstral coefficients (MFCC) and the support vector machine (SVM) classifier. The proposed architecture is implemented on field pro-grammable gate array (FPGA) using and Xilinx System Generator (XSG) and ML605 de-velopment board based on Virtex-6 XC6VLX240T FPGA chip. We propose to use the LIB-SVM library in MATLAB environment to extract LIB-SVM parameters during the training phase, while the feature extraction technique and the testing phase are performed in real-time on FPGA chip. For the validation of the designed architecture, we use a database composed by 24 records including 12 normal respiratory sounds and 12 respiratory sounds containing wheezes. The implemented architecture is presented in details in this paper. We present also the resource utilization and the maximum operating frequency of the Virtex-6 XC6VLX240T FPGA Chip. The classification performances obtained the fixed-point XSG/FPGA and the floating-point MATLAB implementations are presented and compared.
KEY WORDS: Respiratory sounds, Wheezes, Classification, FPGA, SVM, MFCC.
2.3
Introduction
Asthma is a chronic obstructive pulmonary disease (COPD), for which the number of affected people is constantly increasing. This disease is characterized by the presence of wheezing sounds in patient’s respiration. Wheezing sounds are superimposed to normal respiratory sounds and characterized by a duration over 250 ms and a frequency range greater than 400 Hz (Sovijarvi et al.,2000). These sounds with musical aspects, have high amplitude. Computerized lung sound analysis (CLSA) provides objective evidence serving in the diagnosis of the respiratory illnesses. Significant consideration to lung sounds recognition
problems is thoroughly studied by researchers, so that many techniques of signal processing are developed in order to classify different lung sounds. Since 1980, scientists have tried to automatically identify the presence of wheezing (Mazic et al., 2015). To classify respira-tory sounds, different combinations of feature extraction and classifier techniques have been documented in the literature: Mel-frequency cepstral coefficients (MFCC) combined with Support vector machine (SVM) (Mazic et al., 2015), k-nearest neighbor (k-NN) ( Palaniap-pan et al., 2014) and Gaussian mixture models (GMM) (Bahoura and Pelletier, 2004). The wavelet transform was used with artificial neural networks (ANN) (Kandaswamy et al.,2004;
Bahoura,2009), and other combinations can be found in (Bahoura, 2009;Palaniappan et al.,
2013). Among these techniques, the combination MFCC-SVM based algorithms has been effectively applied to detect wheezing episodes, it can achieve an accuracy for classifying respiratory sounds higher than 95 % (Mazic et al.,2015).
In the last decades, researches have focused on the elaboration of new health care equip-ment. An effective health care system should be portable, performing in real-time and adapt-able to both clinical and domesticated applications. Despite its advantages, the automatic respiratory sounds analysis cannot yet reach a level that can be used as a tool for clinical environment. The elaboration of a real-time sound analysis system is a great challenge for future investigation approaches. The field-programmable gate array (FPGA) is an integrated circuit programmed by the user after fabrication. The hardware description language (HDL) is used to configure FPGAs. The recent progress of these devices enables them to perform different ASICs applications. FPGAs contains DSP slices that can ensure an additional flexi-bility when programming these devices.
The literature review illustrates a significant use of FPGA approaches in signal process-ing field, feature extraction technique (Staworko and Rawski, 2010) and classifiers (EhKan et al., 2011;Gulzar et al., 2014). It can be noted that MFCC-based feature extraction tech-nique (Schmidt et al., 2009; Bahoura and Ezzaidi, 2013) has been implemented on FPGA, while the SVM classifier was implemented on FPGA for Persian handwritten digits
recogni-41
tion (Mahmoodi et al.,2011).
In this paper, we propose an FPGA-based implementation of a real-time system to de-tect wheezing episodes in respiratory sounds of asthmatic patients using Xilinx system gener-ator (XSG). The proposed system is based on the combination of MFCC and SVM techniques for feature extraction technique and classification tasks, respectively. The hardware design is generated and verified in the MATLAB/SIMULINK environment.
This article is organized as following: Section 2 and 3 describes mathematical equa-tions for both the MFCC-based feature extraction technique and the SVM-based classifier, respectively. Section 4 presents the FPGA architecture design and discusses the details of the different blocks. The experimental results are described in Section 5. Finally, conclusion and potential for future works are provided in Section 6.
2.4
Feature Extraction
In this study, we propose to use the MFCC-based feature extraction technique, which approximate the responses of human auditory system. This firmly describes the sound that can be heard over the stethoscope (Mazic et al., 2015). The signal content owing to glottal speech stimulation s(n) will be separated from the one owing to the vocal tract response h(n) (Bahoura and Pelletier,2004).
y(n)= s(n) ∗ h(n) (2.1)
As shown in Fig.2.1, the computation of MFCC for a lung waveform input is com-posed of different phases. Every state is described by mathematical operations, which will be detailed in this section.
Figure 2.1: Algorithm of the feature extraction technique MFCC.
2.4.1
Signal windowing
The lung sound sampled at 6000 Hz, is first segmented into frames of N samples, and then multiplied by a Hamming window.
s(m, n)= s(n) ∗ w(n − mL) (2.2)
where m refers to the frame index, n represents the sample time index for the analyzed frame and L is the shift-time step in samples (Bahoura and Ezzaidi,2013).
2.4.2
Fast Fourier Transform
The spectrum X(m, k) of the windowed waveform is computed using the discrete Fourier transform (DFT). X(m, k)= N−1 X n=0 s(m, n)e− j2πnk/N (2.3)
where N represents the number of discrete frequencies, j = √−1, and k is the frequency index (k = 0, ..., N − 1).
43
2.4.3
Mel-Frequency Spectrum
In this step, the Mel-scale filter is applied to the energy spectrum. Fig. 2.2 presents Mel-scale filter bank, which is composed of successive triangular band-pass filters.
Figure 2.2: A bank of 24 triangular band-pass filters with Mel-scale distribution.
The Mel-scale is linear for the frequencies below 1000 Hz and logarithmic above 1000 Hz (Ganchev et al., 2005). The Mel-filtered energy spectrum is defined by the following equation E(m, l)= N−1 X k=0 |X(m, k)|2Hl(k) (2.4)
where Hl(k) is the transfer function of the given filter (l= 1, ..., M) and |X(m, k)|2presents the energy spectrum.
2.4.4
Logarithmic energy spectrum
The logarithmic energy output of the lth filter for the current frame m is defined as
e(m, l) = log(E(m, l)) (2.5)
2.4.5
Discret cosine transform
The MFCC coefficients are obtained by the discrete cosine transform (DCT)
c(m, n)= M X
l=1
e(m, l)cos(n(l − 0.5)π/M) (2.6)
where (n = 0, ..., P − 1) is the index of the cepstral coefficient and (P ≤ M) is the needed number of the MFCC. In this case, 15 MFCC coefficient was used: cm(2), cm(3), ..., cm(16). The feature vector is constructed from the MFCC coefficients Eq.2.6:
Xm = [cm(2), cm(3), ..., cm(16)] (2.7)
All equations and functions are designed using XSG blocks that are detailed in the section 3.
2.5
Classifier
The support vector machine (SVM) technique has been applied in classification and re-gression problems. It is a kernel-based learning algorithm that classifies binary or multiclass data. The SVM operates in training and testing phases. During the training phase, the SVM builds a pattern model from the training data and their corresponding class label values, then
45
it uses this model to classify the test set.
Consider SVM for binary classification, a labeled training set of n observations as men-tioned in Eq.2.8:
On = {(x1, y1), (x2, y2), ..., (xn, yn)} (2.8) where xi are the feature vectors and yi ∈ {1, −1} the associated scalar labels.
As shown in Fig.2.3, the main purpose of SVM is to define a hyperplane such that: the class labels of data {±1} are located on each side of the hyperplane and the distance of the nearest vector of the hyperplane (both classes) is maximum.
Figure 2.3: Maximum margin hyperplane for an SVM trained with samples from two classes.
where w is a n-dimensional vector, b is the bias, || w || is the euclidean norm of w and ξ is slack variables which represent the data that fall into the margin (Mahmoodi et al.,2011).
To obtain the maximum margin separating hyperplane, (Vapnik,1998) propose to solve the primal optimization problem given by Eq.2.9.
Minimize {τ(w, ξ)} = 1 2 || w || 2 2+C n X i=1 ξi (2.9) subject to : yi(wTxi+ b) > 1 − ξi ξi > 0 (2.10)
where the parameter C is the misclassification penalty, which is a tradeoff between maximiza-tion of the margin and minimizamaximiza-tion of the error. The primal optimizamaximiza-tion problem given by Eq. 2.9 concerns the minimization of two quantities. The first term permits to control the margin and the second term limits the number of misclassified points (Chapelle,2004).
The decision of classification for the linear SVM classifier is presented by Eq.2.11.
d(x)= sign(wTx+ b) (2.11)
To determinate the parameters w and b, we should first compute the Lagrange multipliers αi by solving the following dual Lagrange problem:
Maximize (Ld(α))= n X i=1 αi− 1 2 n X j,i=1 αiαjyiyjxTi xj (2.12) subject to: 0 ≤ αi ≤ C n X i=1 αiyi = 0 (2.13)