1
TITLE
1
Assessing the physiological responses of the gastropod Crepidula fornicata to
2predicted ocean acidification and warming
34
Authors: Fanny Noisette1,2, François Bordeyne1,2, Dominique Davoult1,2, Sophie Martin1,2 5
6
Affiliations
7
1 Sorbonne Universités, UPMC Univ. Paris 6, UMR 7144, Station Biologique de Roscoff, Place 8
Georges Teissier, 29688 Roscoff Cedex, France 9
2 CNRS, UMR 7144, Station Biologique de Roscoff, Place Georges Teissier, 29688 Roscoff 10 Cedex, France 11 12 Corresponding author 13 Fanny Noisette 14 Email: fanny.noisette@live.fr 15 Phone: +33 298292333 16 Fax number: +33 298292324 17 18
Running title: Responses of C. fornicata to OA and warming
19 20
Type of paper: Primary Research Article
21 22 23
2
Abstract
24
Organisms inhabiting coastal waters naturally experience diel and seasonal physico-25
chemical variations. According to various assumptions, coastal species are either considered to 26
be highly tolerant to environmental changes or, conversely, living at the thresholds of their 27
physiological performance. Therefore, these species are either more resistant or more sensitive, 28
respectively, to ocean acidification and warming. Here, we focused on Crepidula fornicata, an 29
invasive gastropod that colonized bays and estuaries on northwestern European coasts during 30
the 20th century. Small (< 3 cm in length) and large (> 4.5 cm in length), sexually mature 31
individuals of C. fornicata were raised for 6 months in three different pCO2 conditions (390, 32
750 and 1400 µatm) at four successive temperature levels (10, 13, 16 and 19°C). At each 33
temperature level and in each pCO2 condition, we assessed the physiological rates of 34
respiration, ammonia excretion, filtration and calcification on small and large individuals. 35
Results show that, in general, temperature positively influenced respiration, excretion and 36
filtration rates in both small and large individuals. Conversely, increasing pCO2 negatively 37
affected calcification rates, leading to net dissolution in the most drastic pCO2 condition (1400 38
µatm) but did not affect the other physiological rates. Overall, our results indicate that C. 39
fornicata can tolerate ocean acidification, particularly in the intermediate pCO2 scenario. 40
Moreover, in this eurythermal species, moderate warming may play a buffering role in the 41
future responses of organisms to ocean acidification. 42
43
Keywords: calcification, coastal system, invasive species, metabolism, mollusk, pCO2, 44 temperature 45 46 47 48
3
Introduction
49
Predictions indicate that coastal ecosystems will be strongly affected by ocean 50
acidification and warming, currently two of the most prominent anthropogenic processes 51
influencing marine life (Harley et al. 2006). Due to the increase in atmospheric CO2 partial 52
pressure (pCO2), pH in surface waters is predicted to decline by 0.06 to 0.32 units and sea 53
surface temperatures to increase by 1.0 to 3.7°C by the end of the century, depending on the 54
Intergovernmental Panel on Climate Change (IPCC) representative concentration pathway 55
considered (Stocker et al. 2013). Modifications in seawater carbonate chemistry due to ocean 56
acidification lead to a decrease in carbonate ion concentrations (CO32-) (Orr et al. 2005) and a 57
reduction in the calcium carbonate saturation state (Ω), which regulates the thermodynamics of 58
calcium carbonate (CaCO3) precipitation (Feely et al. 2009). In estuarine and coastal waters, 59
pH is more variable than in the open ocean due to intense biological and biogeochemical 60
processes (Andersson and Mackenzie 2011). In these habitats, ocean acidification and warming 61
will shift the baselines, exacerbate natural variations in pH and temperature, and probably 62
threaten the communities living there (Waldbusser and Salisbury 2013). 63
Mollusks constitute a major taxonomic group in estuarine and coastal waters in terms 64
of community structure and ecosystem functioning (Gutiérrez et al. 2003). Because most marine 65
mollusk taxa accumulate significant amounts of CaCO3 to form protective external shells, they 66
may be sensitive to the changes in pH and carbonate chemistry induced by ocean acidification 67
(for review, see Gazeau et al. 2013), although recent studies have shown that some species 68
could be resistant to elevated pCO2 (Range et al. 2011; Ries et al. 2009). Along with direct 69
impacts on calcification, high CO2 concentrations may also have indirect effects on metabolism 70
by disturbing the extracellular acid-base equilibrium, leading to general internal acidosis 71
(Melzner et al. 2009). These potential shifts in acid-base homeostasis have the potential to 72
change organisms’ energy balance (Pörtner et al. 2005). 73
4 In mollusks, the effects of elevated pCO2 and/or decreased pH alone are highly species-74
specific (see review in Gazeau et al. 2013), and depend on species sensitivity and any existing 75
compensation mechanisms (Michaelidis et al. 2005). To better estimate future ocean 76
acidification effects on mollusk species, various physiological processes have been studied in 77
bivalves and gastropods such as respiration (Beniash et al. 2010; Bibby et al. 2007), excretion 78
(Fernandez-Reiriz et al. 2011; Liu and He 2012), feeding (Fernandez-Reiriz et al. 2012; 79
Marchant et al. 2010), immune response (Bibby et al. 2008; Matozzo et al. 2012) and protein 80
or enzyme production (Matozzo et al. 2013; Tomanek et al. 2011). However, few studies have 81
simultaneously assessed the responses of more than three physiological processes to ocean 82
acidification and warming. The concomitant increase in seawater temperature and pCO2 are 83
likely to affect mollusk metabolism because, in addition to changes in gas solubility and the 84
proportion of carbon species (Zeebe 2011), temperature also strongly affects physiological and 85
biochemical reactions (Cossins and Bowler 1987). Because warming can modulate the 86
metabolism responses to ocean acidification (Ivanina et al. 2013; Melatunan et al. 2013), 87
investigations of both pH and temperature effects are valuable for understanding the responses 88
of mollusks in the future ocean. 89
One of the most abundant and widespread shelled mollusks on the French northwestern 90
Atlantic and Channel coasts is the slipper limpet Crepidula fornicata, Linnaeus 1758 91
(Blanchard 1997). This gastropod native to the northeastern American coast was introduced in 92
Europe at the end of the 19th century, mainly via oysters imported for farming (Blanchard, 93
1995). It then colonized European coasts from southern Sweden to southern France, becoming 94
invasive in some places (Blanchard 1997). C. fornicata lives in shallow sites, especially in bays 95
and estuaries where it can reach very high densities of more than 1000 individuals per m2 96
(Blanchard 1995). This species is known to be highly robust to environmental stress, in 97
particular temperature and salinity (Diederich and Pechenik 2013; Noisette et al. 2015), 98
5 parameters that have diel and seasonal variations in these coastal habitats. Established C. 99
fornicata populations have largely affected biodiversity and ecosystem functioning in terms of
100
sediment modifications (Ehrhold et al. 1998), changes in faunal assemblages (De Montaudouin 101
et al. 1999) and trophic structure (Chauvaud et al. 2000). This species also affects benthic 102
biogeochemical cycles by enhancing filtration, metabolic activities, CaCO3 production, and the 103
recycling of nutrients and dissolved carbon back into the pelagic ecosystem (Martin et al. 2006; 104
Martin et al. 2007; Ragueneau et al. 2002) 105
Although C. fornicata is likely highly tolerant to environmental fluctuations, the 106
combined effects of decreased pH and increased temperature may push this species away from 107
its physiological optimum. Thus the objective of this work was to quantify the respiration, 108
ammonia excretion, filtration and calcification responses of small and large specimens of C. 109
fornicata in different temperature and pCO2conditions. Investigating the physiology of this key 110
engineer in some coastal ecosystems in a context of climate change is one way to better 111
understand the sensitivity of this species and its potential future ecological impact. 112
113
Methods
114 115
Sampling site and in situ conditions
116
C. fornicata stackswere collected by SCUBA divers on 30 November 2011, in Morlaix 117
Bay (northwestern Brittany, France), at the “Barre des Flots” site (3°53.015'W; 48°40.015'N) 118
at approximately 11 m depth. No temporal series of abiotic parameters were available for this 119
exact location. However, variations in the physico-chemical parameters (surface 120
measurements) at a station (called Estacade), located approximately 10 km from the Barre des 121
Flots site, were obtained from the Service d’Observation des Milieux LITorraux (SOMLIT) 122
between 2010 and 2013, with a sampling step of 15 days. Between October 2010 and March 123
6 2013, temperature varied between 8.1°C (January 2011) and 16.5°C (August 2011) with mean 124
values (± SE) of 10.1 ± 0.2°C in winter, 12.7 ± 0.4°C in spring and 15.8 ± 0.02°C in summer. 125
In Morlaix Bay (2009 to 2011), phytoplankton groups (> 5µm), the most important food 126
resource of C. fornicata (Decottignies et al. 2007), were mainly dominated by planktonic 127
diatoms in concentrations varying between 10 to 300 cells mL-1 (depending on the season) and 128
dinoflagellate species that were found at lower abundances (ca. 25 cells mL-1; Leroy 2011). 129
130
Biological material
131
C. fornicataforms stacks of several individuals in which each individual adheres to the 132
dorsal surface of the shell of the subjacent partner in the stack. It is a protandrous 133
hermaphrodite, meaning that the small individuals at the top of the stacks are generally males 134
and the large ones at the bottom, females (Coe 1936). After sampling, stacks were brought 135
directly to the Station Biologique de Roscoff where they were kept in natural, unfiltered 136
seawater for 6 weeks at a temperature gradually lowered to 10°C, reflecting the seasonal drop 137
in temperature between autumn and winter. Sexually mature individuals (more than 1 cm in 138
length) were selected and separated into two class sizes: small individuals (29.5 ± 0.9 mm 139
length) from the top of the stack and larger ones (45.4 ± 0.6 mm length) from the bottom. They 140
were separated from the stack and individually labeled with tags glued on their shell. Empty 141
subjacent shells, whose soft tissue was removed, served as substratum for the sampled live 142
individuals. Other empty shells whose size was similar to that of the substratum shell of live 143
individuals were also selected for flux corrections (see part “Metabolic rates and O:N ratios” 144
below). All the shells were gently brushed to remove epibionts without altering periostracum 145
layer. 146
Length (in mm), volume (in mL) and tissue dry weight (DW in g) of the live individuals 147
were determined for each incubated specimen at the end of the whole experiment. Length was 148
7 measured with calipers, volume was estimated as the volume of seawater moved when 149
individual was immersed and DW was determined after drying fresh samples at 60°C for 48 h. 150
151
Experimental conditions
152
Single small and large individuals, along with their substratum shell, were randomly 153
distributed into nine 10 L aquaria with 10 individuals of each class size per each aquarium. 154
Empty shells were also distributed into nine other 10 L aquaria (4 shells per aquarium). At the 155
beginning of the experiment, pH was gradually decreased over 2 weeks by 0.02 pH unit per day 156
from 8.1 until the different pH treatments were reached. C. fornicata individuals and empty 157
shells were then subsequently held for 24 weeks (12 January to 27 June 2012) in three pCO2 158
treatments selected according to the recommendations in Barry et al. (2010): (1) 390 µatm (pHT 159
= 8.07) represented current pCO2, (2) 750 µatm (pHT = 7.82) corresponded to the elevated pCO2 160
level predicted by the IPCC for the end of the century (Solomon et al. 2007) and (3) 1400 µatm 161
(pHT = 7.56) represented a pCO2 five-fold higher than preindustrial pCO2 (280 µatm) also 162
predicted for 2100 (Stocker et al. 2013). pCO2 was adjusted by bubbling CO2-free air (current 163
pCO2) or pure CO2 (elevated pCO2) in three 100 L header tanks supplied with unfiltered 164
seawater pumped directly from the foot of the Station Biologique de Roscoff. Each of the three 165
pCO2 treatments had six replicate 10 L aquaria, three for live organisms and three for empty 166
shells. They continuously received CO2-treated seawater at a rate of 9 L h-1 (i.e. a renewal rate 167
of 90% h-1) from the header tanks. pCO2 was monitored and controlled by an offline feedback 168
system (IKS Aquastar, Karlsbad, Germany) that regulated the addition of gas in the header 169
tanks. The pH values of the IKS system were adjusted from daily measurements of pHT in the 170
18 aquaria using a pH meter (826 pH mobile, Metrohm AG, Herisau, Switzerland) calibrated 171
with Tris HCl and 2-aminopyridine HCl buffers (Dickson et al. 2007). 172
8 In each pCO2 treatment, temperature was raised from 10 to 19°C with an incremental 173
step of 3°C. The first three temperature levels (10 to 16°C) simulated the natural change in 174
temperature from winter to summer in Morlaix Bay whereas the last level (19°C) corresponded 175
to a temperature increase of 3°C predicted for the end of the century (Solomon et al. 2007). C. 176
fornicata individuals were held for three weeks at each temperature before carrying out the
177
metabolic measurements (see below). This acclimation time was long enough to overcome the 178
immediate stress response (Meistertzheim et al. 2007). Temperature was maintained at (1) 10°C 179
(1st trial period) from 16 January to 12 February 2012; (2) 13°C (2nd trial period) from 27 180
February to 25 March 2012; (3) 16°C (3rd trial period) from 9 April to 6 May 2012, and (4) 181
19°C (4th trial period) from 21 May to 27 June 2012. Between two temperature levels, 182
temperature was gradually increased by 0.2°C day-1 over two weeks. The 18 aquaria were 183
placed in thermostatic baths in which temperature was regulated to within ± 0.2°C using 184
submersible 150 to 250 W heaters controlled by the IKS system. 185
Three independent 10 L aquaria named “control” were maintained at 10°C under 186
ambient pH (with no pCO2 control) until the end of the experiment in order to estimate a 187
potential bias on metabolism induced by the mesocosm experiment over time. Each aquarium 188
contained 10 small and 10 large slipper limpets on their substratum shell and was supplied with 189
the same seawater sourced from the header tanks. They were kept in a thermostatic bath 190
regulated at 10°C by an aquarium chiller (TC5, TECO®, Ravenna, Italy). 191
In addition to the natural phytoplankton found in the unfiltered seawater, all slipper 192
limpets were fed twice a week with a stock solution composed of the diatom Chaetoceros 193
gracilis (~ 15 × 106 cells mL-1) and the dinoflagellate Isochrysis affinis galbana (~ 26 × 106 194
cells mL-1); 400 mL of this microalgal mix was added to each aquarium at each feeding. 195
Seawater flow was stopped for 2 h when organisms were fed and filtering actively. During this 196
feeding time, pH variation did not exceed 0.05 units. 197
9 Individuals that did not adhere to their substratum shell and that showed no reaction 198
when their foot was stimulated were counted as dead and removed from the tanks. Mortality 199
reached only 8% at the end of the experiment among all pCO2 conditions. 200
201
Seawater parameter monitoring
202
Seawater parameters were monitored throughout the experiment. pHT and temperature 203
were recorded daily in each of the 21 aquaria (18 + 3 controls) using a pH meter (826 pH 204
mobile, Metrohm AG, Herisau, Switzerland) as described above. Total alkalinity (AT) was 205
measured at each trial period by 0.01 N HCl potentiometric titration on an automatic titrator 206
(Titroline alpha, Schott SI Analytics, Mainz, Germany). Salinity was also measured at each trial 207
period with a conductimeter (LF 330/ SET, WTW, Weilheim, Germany). Seawater carbonate 208
chemistry, i.e. dissolved inorganic carbon (DIC), pCO2 and the saturation state of aragonite 209
(ΩAr) were calculated for each pCO2 level and temperature with CO2SYS software (Lewis and 210
Wallace 1998) using constants from Mehrbach et al. (1973) refitted by Dickson & Millero 211
(1987). 212
213
Metabolic rates and O:N ratios
214
Metabolic rates were assessed at each temperature level after a four-day starvation 215
period and after the shells were gently cleaned to remove biofilm-forming organisms. Two 216
small and two large individuals were selected per aquarium. They were incubated individually 217
in 185 mL (small) and 316 mL (large) acrylic chambers (Engineering & Design Plastics Ltd, 218
Cambridge, UK) filled with seawater from their respective aquaria. They were put on a plastic 219
grid above a stirring bar (speed 100 rpm.), which ensured water homogeneity. Chambers were 220
placed in their original aquaria for incubation to keep the temperature constant. Incubations 221
were carried out in dark for 2 to 10 h, depending on temperature and limpet size, to maintain 222
10 oxygen saturation above 80% until the end of the incubation. At each temperature period, empty 223
shell incubations were carried out to correct individual rates for fluxes related to the substratum 224
shell. Blank incubations containing only seawater from the aquarium also helped to correct 225
fluxes for any microbiological activity in seawater. 226
Oxygen concentrations were measured at the beginning and the end of the incubation 227
period with a non-invasive fiber-optics system and reactive oxygen spots attached to the inner 228
wall of the chambers (FIBOX 3, PreSens, Regensburg, Germany). Spots were calibrated at the 229
beginning of each trial period with 0% and 100% oxygen buffers. Seawater was sampled for 230
ammonium (NH4+) concentration and AT measurements with 100 mL syringes at the beginning 231
of the incubation, directly in the aquaria just after the chambers were closed, and at the end of 232
the incubation, in the incubation chamber itself. Samples were filtered through 0.7 μm 233
Whatman GF/F filters into 100 mL glass bottles and fixed with reagent solutions for ammonium 234
or poisoned with mercuric chloride (0.02% vol/vol; Dickson et al. 2007) for AT measurements. 235
Vials were stored in the dark pending analysis. NH4+ concentrations were then determined using 236
the Solorzano method (Solorzano 1969) based on spectrophotometry at a wavelength of 630 237
nm (spectrophotometer UV-1201V, Shimadzu Corp, Kyoto, Japan). AT (in µEq L-1) values 238
were determined by 0.01 N HCl potentiometric titration on an automatic titrator (Titroline 239
alpha, Schott SI Analytics, Mainz, Germany) and by using the Gran method (non-linear least-240
squares fit) applied to pH values from 3.5 to 3.0 (Dickson et al. 2007). 241
Respiration (in µmol O2 g-1 DW h-1; equation [1]) and excretion (in µmol NH4+ g-1 DW 242
h-1; equation [2]) were directly calculated from oxygen and ammonium concentrations, 243
respectively. Net calcification (in µmol CaCO2 g-1 DW h-1; equation [3]) was estimated using 244
the alkalinity anomaly technique (Smith and Key 1975) based on a decrease in AT by 2 245
equivalents for each mole of CaCO3 precipitated (Wolf-Gladrow et al. 2007). As ammonium 246
11 production increases alkalinity in a mole-per-mole ratio (Wolf-Gladrow et al. 2007), the 247
alkalinity variation was corrected by the ammonium flux to calculate CaCO3 fluxes. 248 [1] R = ΔO2×V Δt × DW 249 [2] E =ΔNH4+×V Δt × DW 250 [3] Gn = − (ΔAT−ΔNH4+ ) × V) 2 × Δt × DW 251
where ΔO2 (in µmol O2 L-1) is the difference between initial and final O2 concentrations; Δ 252
NH4+ (in µmol NH4+ L-1) is the difference between initial and final NH4+ concentrations; ΔAT 253
is the difference between initial and final total alkalinity (µmol Eq L-1); V (in L) is the volume 254
of the chamber minus C. fornicata volume; Δt (in h) is the incubation time and DW (in g) is the 255
soft tissue dry weight of incubated C. fornicata. 256
In addition, oxygen consumption of the individuals maintained at 10°C during the 257
experiment were assessed on six small and six large individuals at each trial period, following 258
the technique described above. These “controls” tested if mesocosm conditioning induced 259
metabolic stress over time. 260
The O:N ratio, which corresponds to the amount of oxygen consumed for nitrogen 261
excreted, was calculated from respiration and excretion rates except for the experiments run at 262
10°C for which rates were too low to obtain significant data. Generally, the O:N ratio is 263
considered a common indicator of the proportion of the three metabolic substrates 264
(carbohydrates, lipids and proteins) used in energy metabolism (Mayzaud and Conover 1988). 265
The atomic ratio of oxygen uptake and excreted nitrogen was calculated following the equation 266
[4] based on Thomsen & Melzner (2010): 267
[4]: O:N = R / E 268
where R is the respiration rate used as a proxy of the quantity of oxygen consumed by the 269
individual and E, the excretion rate representing the concentration of nitrogen excreted. 270
12 271
Filtration rates
272
At each trial period, the filtration rate of three small and three large slipper limpets per 273
pCO2 condition (i.e. 1 individual per size per aquarium) was determined by calculating 274
clearance rates (Coughlan 1969). To do so, 10 and 20 mL of a microalgae mix (C. gracilis, T. 275
affinis galbana, 1:1) were added to the small and large chambers (same as for metabolic
276
measurements), respectively, using a 10 mL syringe equipped with a thin tube. The mean initial 277
concentration of the mix was 1 200 000 ± 310 000 cell mL-1. In parallel, control incubations 278
containing only microalgae were carried out to check that phytoplankton cells did not multiply 279
significantly during the incubation. Water from the chambers was sampled with the syringe 280
every 15 min until the water became totally clear (around 2 h). Samples were immediately fixed 281
with 25% glutaraldehyde and frozen at -80°C pending analyses (Marie et al. 1999). The number 282
of microalgal cells in each sample was then determined on 200 µL aliquots using flux cytometry 283
(Cell Lab QuantaTM, SC, Beckman Coulter, USA). Filtration rates (F, in mL SW g-1 DW min -284
1) were calculated following equation [5]: 285
[5] F = V ×ln[𝐶𝑖]− ln[𝐶𝑓] Δt × DW 286
where [Ci] and [Cf] (in cell mL-1) were respectively the initial and final cell concentrations in 287
the chamber water; V (in L) is the volume of the chamber minus individual C. fornicata volume; 288
Δt (in h) is the incubation time and DW (in g) is the tissue dry weight of the individual 289 incubated. 290 291 Statistical analyses 292
All statistical analyses were performed using the R software, version 2.15.0 (R Core 293
Team 2013). Normality and homoscedasticity were checked using Kolmogorov-Smirnov’s test 294
and Levene’s test, respectively, before each statistical test. Spatial pseudoreplication effect was 295
13 first tested by considering “aquarium” as a random factor (p-value < 0.05). Then, statistical 296
analyses were simplified to two-way ANOVAs with repeated measurements on the same 297
individual through the four trial periods (different temperature levels) separately for small and 298
large individuals. These analyses were performed for the four physiological rates (respiration, 299
excretion, calcification and filtration) and the O:N ratio, assuming pCO2 and temperature as 300
fixed factors. Student-Newman-Keuls (SNK) post hoc tests were applied to identify differences 301
among treatments with a confidence level of 95% when ANOVA showed significant results. In 302
parallel, any changes in the respiration rate of individuals constantly maintained at 10°C 303
through time were assessed using a non-parametric Friedman test for repeated measurements, 304
separately for small and large slipper limpets. All results are given as mean ± standard error 305 (SE). 306 307 Results 308 309 Seawater parameters 310
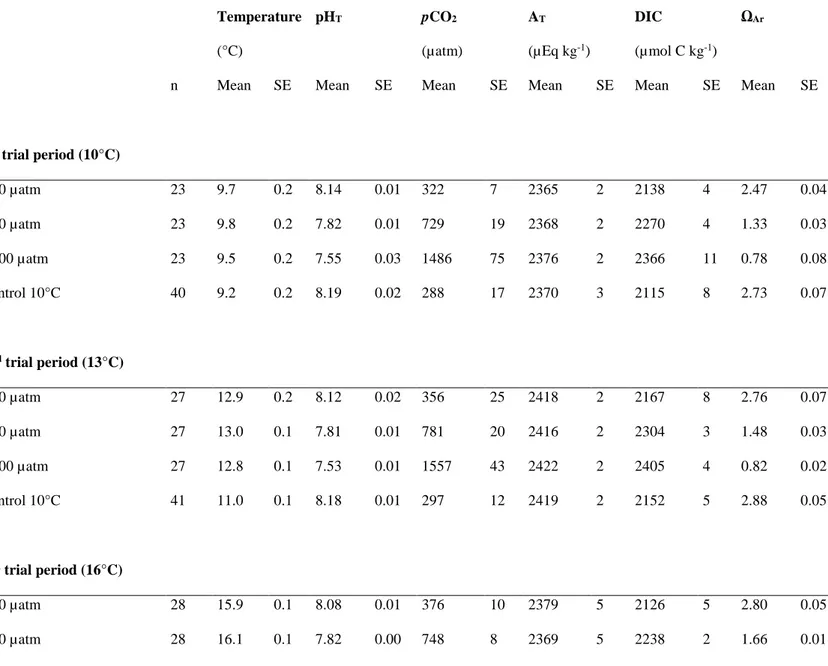
The mean temperature and carbonate chemistry parameters among the pCO2 and 311
temperature conditions are presented in Table 1. Temperature was stable at each trial period 312
with a variability lower than 0.5°C. The different pCO2 levels remained close to the selected 313
values of 390, 750 and 1400 µatm except at 19°C where all pCO2 increased from the baseline 314
(+ 100-200 µatm). AT ranged from 2365 ± 2 to 2422 ± 2 µEq kg-1. ΩAr decreased by less than 315
1 only in the 1400 µatm pCO2 condition. Salinity varied between 34.2 ± 0.1 and 35.1 ± 0.1 316
among the different pCO2 and temperature levels with no effect of the temperature increase on 317
salinity. 318
319
Respiration, excretion and O:N ratio
14 Respiration and excretion rates changed significantly with temperature, but not with 321
pCO2, in small and large individuals (Figure 1, Table 2). After pooling results for all pCO2 322
conditions, mean respiration rates in small C. fornicata increased from 3.78 µmol O2 g-1 DW h -323
1 at 10°C to11.76 µmol O2 g-1 DW h-1 at 19°C. In large individuals, the lowest mean respiration 324
rate was recorded at 10°C (4.82 µmol O2 g-1 DW h-1) whereas rates did not differ from 13 to 325
19°C with a mean value of 11.50 µmol O2 g-1 DW h-1. Oxygen fluxes measured on empty shells 326
represented only 4% of the whole organism fluxes measured and decreased only slightly with 327
temperature. 328
Mean excretion rates calculated among pCO2 conditions for small C. fornicata 329
individuals gradually increased from 0.15 µmol NH3 g-1 DW h-1 at 10°C to 1.47 µmol NH3 g-1 330
DW h-1 at 19°C. Excretion rates of large individuals showed a parabolic trend with an increase 331
from 10°C (0.16 µmol NH3 g-1 DW h-1) to 16°C (1.34 µmol NH3 g-1 DW h-1) followed by a 332
decrease at 19°C (0.74 µmol NH3 g-1 DW h-1). The ammonium fluxes of empty shells 333
represented less than 1% of the fluxes estimated for whole organisms and were higher at 10°C 334
than at the other temperature levels (rates practically nil). 335
O:N ratios varied greatly, ranging from 2.86 to 31.68 with a mean value of 12.91 ± 0.56. 336
They varied with pCO2 or temperature according to size (Table 2, Figure 2). In small C. 337
fornicata individuals, O:N ratios were the highest at 750 µatm and similar between 380 and
338
1400 µatm. In large individuals, the O:N ratios varied with temperature and were significantly 339 higher at 16°C. 340 341 Filtration 342
Temperature significantly affected filtration rates in both small and large individuals 343
(Figure 1, Table 2). In small C. fornicata, mean filtration rates among pCO2 were similar 344
between 10 and 16°C (25.50 mL g-1 DW min-1), but increased at 19°C (54.30 mL g-1 DW min -345
15 1). pCO2 alone did not affect the filtration rate but the interaction of pCO2 and temperature was 346
significant (Table 2, p-value < 0.001). At 19°C, filtration rates increased significantly with the 347
increase in pCO2. In large individuals, mean filtration rates increased gradually from 10°C (5.43 348
mL g-1 DW min-1) to 19°C (25.78 mL g-1 DW min-1) without any effect of pCO2 conditions. 349
350
Calcification
351
Calcification rates were significantly affected by pCO2 increase in both small and large 352
individuals but not by temperature (Figure 1, Table 2). Pooling all temperature levels together, 353
mean calcification rates were similar at pCO2 of 390 µatm (1.88 and 1.63 µmol CaCO3 g-1 DW 354
h-1 in small and large individuals, respectively) and 750 µatm (1.02 and 0.60 µmol CaCO3 g-1 355
DW h-1 in small and large, respectively), but significantly lower at 1400 µatm pCO2 (-2.53 and 356
-1.77 µmol CaCO3 g-1 DW h-1 in small and large individuals, respectively). In the highest pCO2 357
condition (1400 µatm), net calcification rates were negative, corresponding to dissolution. 358
Although the interaction between pCO2 and temperature was not significant for either small or 359
large limpets, pCO2 response appeared to vary as a function of temperature, particularly at 1400 360
µatm. In this drastic pCO2 condition, organisms globally dissolved at 10, 13 and 16°C and 361
calcified (or dissolved less) at 19°C. 362
Calcification rates decreased with the decrease in the mean aragonite saturation state 363
(ΩAr) which correlated with pCO2 increase (Figure 3). When ΩAr decreased below the threshold 364
of 1, calcification rates were always negative reflecting a dissolution process. At the 750 and 365
1400 µatm pCO2 conditions, ΩAr was higher at 19°C than at the other temperature levels 366
because the saturation state increases with temperature. 367
368
Mesocosm controls
16 In the aquaria maintained at 10°C throughout the entire experiment, temperature was 370
stable over the first weeks of the experiment and slowly increased from 8 April to the end of 371
the experiment until reaching a mean of 12.4°C between 21 April and 15 June because we had 372
technical problems with the chiller (Table 1). Respiration in small individuals showed high 373
variation over time (Figure 4, white bars) but no time effect was detected (Friedman test, df = 374
3, χ² = 6.6, p = 0.086, n = 6). Conversely, respiration rates of large individuals increased 375
throughout the experiment (Figure 4, gray bars) with a significant time effect (Friedman test, 376 df = 3, χ² = 9.4, p = 0.024, n = 6). 377 378 Discussion 379
An increase in temperature affected three of the four physiological processes assessed 380
on small and large C. fornicata individuals. In particular, respiration and ammonia excretion 381
rates clearly increased along the tested temperature gradient. In contrast, increases in pCO2 382
affected only net calcification of the slipper limpets. Interestingly, the coupled effect of 383
temperature and pCO2 improved the rate of calcification in the most drastic conditions, 384
particularly in small individuals. 385
386
Temperature effect
387
The respiration (0.6 - 34.6 µmol O2 g-1 DW h-1)and excretion rates (-2 - 4.4 µmol NH3 388
g-1 DW h-1) measured at 390 µatm pCO2 in small and large C. fornicata individuals ranged 389
metabolic rates recorded in situ in the Bay of Brest in northwestern France (4 to 45 µmol O2 g -390
1 DW h-1 and0.5 to 2.3 µmol NH3 g-1 DW h-1; Martin et al. 2006). Both rates increased with 391
temperature in small and large individuals regardless of pCO2. Although respiration rates 392
gradually increased with temperature in small C. fornicata individuals, they only increased from 393
10°C to 13°C, remaining stable at higher temperatures in large C. fornicata. This increase is a 394
17 common response due to the rate-enhancing effects of temperature on physiological and 395
biochemical reactions in ectotherms (Cossins and Bowler 1987). The intensity of respiratory 396
and excretory processes were also dependent of body size. The respiration and excretion rates 397
of small individuals were higher than those of large individuals because the metabolic rate (per 398
unit biomass) decreases with increasing individual size (Parsons et al. 1984; Von Bertalanffy 399
1951). Small individuals have higher energy consumption because they grow faster than the 400
large individuals (Von Bertalanffy 1964). 401
The filtration rates measured in small and large C. fornicata fall into the range of 402
maximum feeding rates calculated by Newell and Kofoed (1977) in C. fornicata between 11 403
and 20°C (18 to 41 mL g-1 min-1; 15°C acclimated individuals). Rates were higher in small than 404
in large individuals because, again, small organisms feed more actively per unit body mass 405
(Sylvester et al. 2005). Filtration rates increased with temperature as previously described in 406
other studies (Newell and Kofoed 1977). In small individuals, rates were constant between 10 407
and 16°C and increased only at 19°C while they increased regularly with temperature in the 408
large individuals. In Calyptraeidae, small individuals — i.e. males with low mobility — utilize 409
two feeding strategies: grazing with radula and filtration with gills (Navarro and Chaparro 410
2002). Therefore, small individuals may have supplemented their diet between 10 and 16°C by 411
grazing. For the increased energy requirements at 19°C, small slipper limpets may also increase 412
their filtration rate to meet these supplementary needs. In large sedentary individuals (usually 413
females), filtration is the only feeding mechanism (Navarro and Chaparro 2002) and filtration 414
rate increases with temperature to help cover the higher energy needs. 415
Surprisingly, temperature did not affect calcification rates although an increase was 416
expected in response to the increase in metabolism and energy requirements (Martin et al. 417
2006). Because mollusk shell production is an energetically costly process (Gazeau et al. 2013), 418
the absence of any change in calcification rates may be due to food limitation during the 419
18 experiment, especially at elevated temperatures (16 and 19°C). At these temperatures, 420
providing additional food only twice a week may not have been sufficient to support maximal 421
individual shell growth under pH stressful conditions. If food had been provided more regularly 422
and/or in higher quantities, C. fornicata calcification may not be potentially restricted and 423
individuals may have better mitigated the effect of high pCO2 (Thomsen et al. 2014). Future 424
experiments should include measuring integrated shell growth at each temperature level to 425
determine the food effect more completely. 426
Mesocosm experiments cannot perfectly reproduce in situ conditions such as natural 427
diet or tidal cycles. This may lead to an increased stress for the organisms grown in these 428
systems (Bibby et al. 2008). The mesocosm effect on organisms was tested through O2 429
consumption measurements in individuals kept ca constant temperature throughout the 430
experiment (“controls”). The respiration rates did not change over time in small individuals, 431
whereas the respiration in large individuals increased slightly in correlation with a +2°C 432
temperature increase from the beginning to the end of the experiment, because of technical 433
problems with the chiller. Although food may have constituted a bias, particularly in the one-434
off calcification response to temperature, the absence of strong changes in respiration rates in 435
“controls”, unexceptional metabolic rates ranging those measured in situ and very low mortality 436
during the experiment (only 8%) all suggest the absence of any acute mesocosm effect on the 437
other physiological traits of C. fornicata. 438
439
pCO2 effect
440
In contrast to temperature, pCO2 did not affect C. fornicata respiration or excretion rates 441
regardless of size. Other studies have underlined a lack of any pCO2 effect on bivalve and limpet 442
respiration (Dickinson et al. 2012; Fernandez-Reiriz et al. 2012; Marchant et al. 2010), although 443
some mollusk species exposed to high pCO2 levels have shown metabolic depression (i.e. 444
19 decrease in oxygen uptake) to compensate — albeit often drastic — pCO2 increases 445
(Michaelidis et al. 2005; Navarro et al. 2013). Responses of ammonia excretion to high pCO2 446
in mollusks are also specific: increase in ammonia excretion can occur under elevated pCO2 447
(Fernandez-Reiriz et al. 2011; Langenbuch and Pörtner 2002; Range et al. 2014) while some 448
bivalves show opposing trends (Liu and He 2012; Navarro et al. 2013). The increase in 449
ammonia excretion under increased pCO2 conditions can be interpreted as an internal pH 450
regulatory mechanism, sometimes based on protein catabolism (Fernandez-Reiriz et al. 2012; 451
Thomsen and Melzner 2010). In our study, neither change in excretion rates nor in O:N ratios 452
calculated were detected between the 390 and 1400 µatm conditions. This similarity indicates 453
that potential intracellular pH regulation of C. fornicata was not induced by enhancing protein 454
metabolism (Fernandez-Reiriz et al. 2012). Thus, the potential for metabolic resistance of C. 455
fornicata to elevated pCO2 is likely due to another effective acidosis-buffering system, such as 456
the increase in internal HCO3- concentrations (Gutowska et al. 2010; Michaelidis et al. 2005) 457
or higher H+ excretion (Melzner et al. 2009; Pörtner et al. 2005). 458
Similarly to the respiration and excretion processes, filtration rates did not change as a 459
function of pCO2 in either small or large C. fornicata in our study. Filtration responses with 460
respect to pCO2 depend most of the time on the presence of metabolic depression (Fernandez-461
Reiriz et al. 2011; Liu and He 2012; Navarro et al. 2013). The absence of variation in filtration 462
rates at the different pCO2 levels indicates that the quantity of food ingested by C. fornicata did 463
not vary either. Food is known to interact with other stressors, such as pCO2, and significantly 464
influence metabolic responses (Melzner et al. 2011; Pansch et al. 2014). Quality or quantity 465
changes in the diet can even worsen the condition of invertebrates (Berge et al. 2006; Vargas et 466
al. 2013). Although our microalgal mix did not perfectly match the natural diet of C. fornicata 467
(Barillé et al. 2006; Decottignies et al. 2007), the diatoms and dinoflagellate microalgae 468
provided in the experiment correspond to the main taxa present in Morlaix Bay, assuming a 469
20 nutritional quality close to the natural diet. However, we cannot assure that the quantity of food 470
was not a limiting factor in our experiment. To be sure that microalgae supplied would not 471
represent a bias, the slipper limpets should be fed ad libitum which represented a technical issue 472
on a 6 month experiment. 473
In our study, net calcification was similar between 390 and 750 µatm pCO2 and strongly 474
decreased at 1400 µatm pCO2 regardless of size, which is a common response in mollusks 475
(Beniash et al. 2010; Melatunan et al. 2013; Range et al. 2011). This pattern contrasts with that 476
reported in Ries et al. (2009), with a parabolic response in C. fornicata calcification with the 477
highest rates observed at 600 µatm pCO2. The stability of calcification rate at 750 µatm pCO2 478
(compared to 390 µatm pCO2) may be due to the biological control of the calcification process 479
and/or the presence of the periostracum, the organic layer covering the crystalline layers of the 480
shell. This organic layer has been predicted to play a great role in maintaining shell integrity of 481
mollusks in elevated pCO2 conditions (Ries et al. 2009) and to protect them from dissolution in 482
CaCO3-undersaturated waters (Huning et al. 2013). Moreover, mollusks may be able to 483
maintain extrapallial fluid in chemical conditions favoring CaCO3 precipitation at the 484
calcification site, even if external seawater pCO2 is high (Hiebenthal et al. 2013). Regulation 485
of enzymes involved in the calcification process, such as chitinase (Cummings et al. 2011) or 486
carbonic anhydrase (Ivanina et al. 2013), may also help maintain calcification in high pCO2 487
conditions. In our study, at 1400 µatm, calcification rates dropped, perhaps due to physiological 488
changes in the internal acid-base balance affecting shell deposition (Waldbusser et al. 2011) or 489
to an eroded and/or damaged periostracum (pers. obs.). Degradation of this protective layer may 490
lead to higher vulnerability of the shell to external dissolution processes (Range et al. 2012; 491
Ries et al. 2009), which occurs not only in dead shells but also in live animals (Harper 2000). 492
Furthermore, chemical dissolution increased with an increase in pCO2 and a correlated decrease 493
21 in ΩAr; the combined effect led to a decrease in net calcification rates observed in both small 494
and large C. fornicata individuals at high pCO2 conditions. 495
496
Combined effects of temperature and pCO2 497
In the range of pCO2 and temperatures tested, the interaction of these two variables had 498
no negative effect on C. fornicata respiration and excretion rates. As a eurythermal species even 499
coping with high temperature in some bays during summer (e.g. Bassin d’Arcachon in 500
southwestern France; De Montaudouin et al. 1999), C. fornicata can have an optimal 501
temperature of 19°C or higher (Diederich and Pechenik 2013; Noisette et al. 2015). Thus, 19°C 502
may not constitute a real thermal stress and not transgress the metabolic optimal threshold for 503
this species. Increase in temperature is predicted to enhance sensitivity to high pCO2 levels 504
beyond the optimal temperature of the species and close to its upper limit of thermal tolerance 505
(Pörtner and Farrell 2008). However, at the cold side of a species optimal temperature, warming 506
can increase resilience to ocean acidification (Gianguzza et al. 2014). Therefore, an increase in 507
temperature may actually improve tolerance to pCO2 increases in C. fornicata. 508
Calcification rates of both small and large C. fornicata showed a positive trend with 509
temperature in the most drastic pCO2 conditions (1400 µatm). Temperature-mediated increases 510
in metabolism and feeding rates may potentially offset reductions in calcification rates caused 511
by high pCO2 conditions (Melzner et al. 2011; Thomsen et al. 2014). In addition to this 512
physiological effect, moderate warming can mediate the effects of ocean acidification by the 513
chemical effect on seawater chemistry (Kroeker et al. 2014). Temperature affects CO2 solubility 514
in seawater as well as the equilibrium coefficients governing carbonate chemistry (Millero 515
2007). As shown in our study, the saturation state of aragonite was greater in warmer water 516
than in colder water for a given pCO2, thereby enhancing calcification and reducing the 517
dissolution processes in the high pCO2 conditions. These results highlight the importance of 518
22 considering the physiological and geochemical interactions between temperature and carbonate 519
chemistry when interpreting species’ vulnerability to ocean acidification. A better 520
understanding of how warming influences species’ responses to high pCO2 levels through both 521
direct (e.g. increases in metabolic rates) and indirect pathways (e.g. changes in carbonate 522
chemistry) is thus necessary. 523
524
Conclusion
525
A trade-off between stressors may affect the physiology of organisms in an unexpected 526
way (Kroeker et al. 2014). In our case, C. fornicata appeared to be able to tolerate slight 527
increases in pCO2 but its calcification was affected by drastic conditions with a positive effect 528
of temperature, thereby mitigating any ocean acidification effects. This outcome highlights the 529
need of multistressor studies to understand the future of marine species in a context of climate 530
change in which different physico-chemical factors vary in different ways. Furthermore, our 531
results indicate that some species can be highly tolerant to future pCO2 increases. C. fornicata 532
tolerance likely stems from mechanisms that allow it to acclimate or adapt to environmental 533
fluctuations in its habitat (Clark et al. 2013), because species living in environments with large 534
abiotic variations tend to have high phenotypic plasticity, allowing them to survive in stressful 535
conditions (Somero 2010). This capacity to resist decreases in pH may reinforce the ecological 536
role of C. fornicata populations in the ecosystems in which they are established, even under 537
projected future conditions anticipated due to climate change. 538 539 540 541 542 543
23
References
544
Andersson, A. J., and F. T. Mackenzie. 2011. Ocean acidification: setting the record straight. 545
Biogeosciences Discussions 8: 6161-6190. 546
Barillé, L., B. Cognie, P. Beninger, P. Decottignies, and Y. Rince. 2006. Feeding responses of 547
the gastropod Crepidula fornicata to changes in seston concentration. Mar. Ecol.-Prog. 548
Ser. 322: 169-178. 549
Barry, J. P., T. Tyrrell, L. Hansson, G. K. Plattner, and J. P. Gattuso. 2010. Atmospheric CO2 550
targets for ocean acidification perturbation experiments, p. 260. In F. V. J. Riebesell U., 551
Hansson L. & Gattuso J.-P. [ed.], Guide to best practices for ocean acidification research 552
and data reporting. 553
Beniash, E., A. Ivanina, N. S. Lieb, I. Kurochkin, and I. M. Sokolova. 2010. Elevated level of 554
carbon dioxide affects metabolism and shell formation in oysters Crassostrea virginica. 555
Mar. Ecol.-Prog. Ser. 419: 95-108. 556
Berge, J. A., B. Bjerkeng, O. Pettersen, M. T. Schaanning, and S. Øxnevad. 2006. Effects of 557
increased sea water concentrations of CO2 on growth of the bivalve Mytilus edulis L. 558
Chemosphere 62: 681-687. 559
Bibby, R., P. Cleall-Harding, S. Rundle, S. Widdicombe, and J. Spicer. 2007. Ocean 560
acidification disrupts induced defences in the intertidal gastropod Littorina littorea. 561
Biol. Lett. 3: 699-701. 562
Bibby, R., S. Widdicombe, H. Parry, J. Spicer, and R. Pipe. 2008. Effects of ocean acidification 563
on the immune response of the blue mussel Mytilus edulis. Aquat. Biol. 2: 67-74. 564
Blanchard, M. 1995. Origine et état de la population de Crepidula fornicata (Gastropoda 565
Prosobranchia) sur le littoral français. Haliotis 24: 75-86. 566
Blanchard, M. 1997. Spread of the slipper limpet Crepidula fornicata (L. 1758) in Europe. 567
Current state and consequences. Sci. Mar. 61: 109-118. 568
Chauvaud, L., F. Jean, O. Ragueneau, and G. Thouzeau. 2000. Long-term variation of the Bay 569
of Brest ecosystem: benthic-pelagic coupling revisited. Mar. Ecol.-Prog. Ser. 200: 35-570
48. 571
Clark, M. S. and others 2013. Identification of molecular and physiological responses to chronic 572
environmental challenge in an invasive species: the Pacific oyster, Crassostrea gigas. 573
Ecology and Evolution 3: 3283-3297. 574
Coe, W. R. 1936. Sexual phases in Crepidula. Journal of experimental zoology 72: 455-477. 575
Cossins, A. R., and K. Bowler. 1987. Temperature biology of animals. Chapman and Hall 576
Coughlan, J. 1969. Estimation of filtering rate from clearance of suspensions. Mar. Biol. 2: 577
356-&. 578
Cummings, V. and others 2011. Ocean acidification at high latitudes: potential effects on 579
functioning of the antarctic bivalve Laternula elliptica. PLoS One 6: e16069. 580
De Montaudouin, X., C. Audemard, and P.-J. Labourg. 1999. Does the slipper limpet 581
(Crepidula fornicata, L.) impair oyster growth and zoobenthos biodiversity? A revisited 582
hypothesis. Journal of Experimental Marine Biology and Ecology 235: 105-124. 583
Decottignies, P., P. G. Beninger, Y. Rince, R. J. Robins, and P. Riera. 2007. Exploitation of 584
natural food sources by two sympatric, invasive suspension-feeders: Crassostrea gigas 585
and Crepidula fornicata. Mar. Ecol.-Prog. Ser. 334: 179-192. 586
Dickinson, G. H. and others 2012. Interactive effects of salinity and elevated CO2 levels on 587
juvenile eastern oysters, Crassostrea virginica. The Journal of experimental biology 588
215: 29-43.
589
Dickson, A. G., and F. J. Millero. 1987. A comparison of the equilibrium constants for the 590
dissociation of carbonic acid in seawater media. Deep Sea Research 34: 1733-1743. 591
24 Dickson, A. G., C. L. Sabine, and J. R. Christian [eds.]. 2007. Guide to best practices for ocean 592
CO2 measurements. North Pacific Marine Science Organization. 593
Diederich, C. M., and J. A. Pechenik. 2013. Thermal tolerance of Crepidula fornicata 594
(Gastropoda) life history stages from intertidal and subtidal subpopulations. Mar. Ecol.-595
Prog. Ser. 486: 173-187. 596
Ehrhold, A., M. Blanchard, J. P. Auffret, and T. Garlan. 1998. The role of Crepidula 597
proliferation in the modification of the sedimentary tidal environment in Mont-Saint-598
Michel Bay (The Channel, France). Comptes Rendus de l'Academie des Sciences Serie 599
Ii Fascicule a-Sciences de la Terre et des Planetes 327: 583-588. 600
Feely, R. A., S. C. Doney, and S. R. Cooley. 2009. Ocean acidification: present conditions and 601
future changes in a high-CO2 world. Oceanography 22: 36-47. 602
Fernandez-Reiriz, M. J., P. Range, X. A. Alvarez-Salgado, J. Espinosa, and U. Labarta. 2012. 603
Tolerance of juvenile Mytilus galloprovincialis to experimental seawater acidification. 604
Mar. Ecol.-Prog. Ser. 454: 65-74. 605
Fernandez-Reiriz, M. J., P. Range, X. A. Alvarez-Salgado, and U. Labarta. 2011. Physiological 606
energetics of juvenile clams Ruditapes decussatus in a high CO2 coastal ocean. Mar. 607
Ecol.-Prog. Ser. 433: 97-105. 608
Gazeau, F. and others 2013. Impacts of ocean acidification on marine shelled molluscs. Mar. 609
Biol. 160: 2207-2245. 610
Gianguzza, P., G. Visconti, F. Gianguzza, S. Vizzini, G. Sara , and S. Dupont. 2014. 611
Temperature modulates the response of the thermophilous sea urchin Arbacia lixula 612
early life stages to CO2-driven acidification. Mar. Environ. Res. 93: 70-77. 613
Gutiérrez, J. L., C. G. Jones, D. L. Strayer, and O. O. Iribarne. 2003. Mollusks as ecosystem 614
engineers: the role of shell production in aquatic habitats. Oikos 101: 79-90. 615
Gutowska, M. A., F. Melzner, M. Langenbuch, C. Bock, G. Claireaux, and H.-O. Pörtner. 2010. 616
Acid-base regulatory ability of the cephalopod (Sepia officinalis) in response to 617
environmental hypercapnia. Journal of Comparative Physiology B 180: 323-335. 618
Harley, C. D. G. and others 2006. The impacts of climate change in coastal marine systems. 619
Ecol. Lett. 9: 228-241. 620
Harper, E. M. 2000. Are calcitic layers an effective adaptation against shell dissolution in the 621
Bivalvia? Journal of Zoology 251: 179-186. 622
Hiebenthal, C., E. E. Philipp, A. Eisenhauer, and M. Wahl. 2013. Effects of seawater pCO2 and 623
temperature on shell growth, shell stability, condition and cellular stress of Western 624
Baltic Sea Mytilus edulis (L.) and Arctica islandica (L.). Mar. Biol. 160: 2073-2087. 625
Huning, A. K. and others 2013. Impacts of seawater acidification on mantle gene expression 626
patterns of the Baltic Sea blue mussel: implications for shell formation and energy 627
metabolism. Mar. Biol. 160: 1845-1861. 628
Ivanina, A. V. and others 2013. Interactive effects of elevated temperature and CO2 levels on 629
energy metabolism and biomineralization of marine bivalves Crassostrea virginica and 630
Mercenaria mercenaria. Comparative Biochemistry and Physiology Part A: Molecular
631
& Integrative Physiology 166: 101-111. 632
Kroeker, K. J., B. Gaylord, T. M. Hill, J. D. Hosfelt, S. H. Miller, and E. Sanford. 2014. The 633
role of temperature in determining species' vulnerability to ocean acidification: a case 634
study using Mytilus galloprovincialis. PLoS One 9: e100353. 635
Langenbuch, M., and H.-O. Pörtner. 2002. Changes in metabolic rate and N excretion in the 636
marine invertebrate Sipunculus nudus under conditions of environmental hypercapnia 637
identifying effective acid-base variables. J. Exp. Biol. 205: 1153-1160. 638
Leroy, F. 2011. Influence des conditions trophiques sur le développement larvaire de l'espèce 639
invasive Crepidula fornicata : conséquences sur ses capacités de dispersion. Paris: 640
Université Pierre et Marie Curie. 641
25 Lewis, E., and D. W. R. Wallace. 1998. Program developed for CO2 system calculations. 642
Carbon Dioxide Information Analysis Center, Oak Ridge National Laboratory, U.S. 643
Department of Energy 644
Liu, W., and M. He. 2012. Effects of ocean acidification on the metabolic rates of three species 645
of bivalve from southern coast of China. Chinese Journal of Oceanology and Limnology 646
30: 206-211.
647
Marchant, H. K., P. Calosi, and J. I. Spicer. 2010. Short-term exposure to hypercapnia does not 648
compromise feeding, acid-base balance or respiration of Patella vulgata but surprisingly 649
is accompanied by radula damage. J. Mar. Biol. Assoc. U.K. 90: 1379-1384. 650
Marie, D., C. Brussaard, F. Partensky, D. Vaulot, and J. Wiley. 1999. Flow cytometric analysis 651
of phytoplankton, bacteria and viruses. Current protocols in cytometry 11: 1-15. 652
Martin, S., G. Thouzeau, L. Chauvaud, F. Jean, and L. Guérin. 2006. Respiration, calcification, 653
and excretion of the invasive slipper limpet, Crepidula fornicata L.: Implications for 654
carbon, carbonate, and nitrogen fluxes in affected areas. Limnology & Oceanography 655
51: 1996-2007.
656
Martin, S., G. Thouzeau, M. Richard, L. Chauvaud, F. Jean, and J. Clavier. 2007. Benthic 657
community respiration in areas impacted by the invasive mollusk Crepidula fornicata. 658
Mar. Ecol.-Prog. Ser. 347: 51-60. 659
Matozzo, V., A. Chinellato, M. Munari, M. Bressan, and M. G. Marin. 2013. Can the 660
combination of decreased pH and increased temperature values induce oxidative stress 661
in the clam Chamelea gallina and the mussel Mytilus galloprovincialis? Marine 662
Pollution Bulletin 72: 34-40. 663
Matozzo, V., A. Chinellato, M. Munari, L. Finos, M. Bressan, and M. G. Marin. 2012. First 664
evidence of immunomodulation in bivalves under seawater acidification and increased 665
temperature. PLoS One 7: e33820. 666
Mayzaud, P., and R. Conover. 1988. O: N atomic ratio as a tool to describe zooplankton 667
metabolism. Marine Ecology Progress Series 45: 289-302. 668
Mehrbach, C., Culberso.Ch, J. E. Hawley, and R. M. Pytkowic. 1973. Measurement of apparent 669
dissociation-constants of carbonic-acid in seawater at atmospheric-pressure. Limnology 670
& Oceanography 18: 897-907. 671
Meistertzheim, A.-L., A. Tanguy, D. Moraga, and M.-T. Thébault. 2007. Identification of 672
differentially expressed genes of the Pacific oyster Crassostrea gigas exposed to 673
prolonged thermal stress. Febs Journal 274: 6392-6402. 674
Melatunan, S., P. Calosi, S. D. Rundle, S. Widdicombe, and A. J. Moody. 2013. Effects of 675
ocean acidification and elevated temperature on shell plasticity and its energetic basis 676
in an intertidal gastropod. Mar. Ecol.-Prog. Ser. 472: 155-168. 677
Melzner, F. and others 2009. Physiological basis for high CO2 tolerance in marine ectothermic 678
animals: pre-adaptation through lifestyle and ontogeny? Biogeosciences 6: 2313-2331. 679
Melzner, F. and others 2011. Food supply and seawater pCO2 impact calcification and internal 680
shell dissolution in the blue mussel Mytilus edulis. PLoS One 6: e24223. 681
Michaelidis, B., C. Ouzounis, A. Paleras, and H.-O. Pörtner. 2005. Effects of long-term 682
moderate hypercapnia on acid-base balance and growth rate in marine mussels Mytilus 683
galloprovincialis. Mar. Ecol.-Prog. Ser. 293: 109-118.
684
Millero, F. J. 2007. The marine inorganic carbon cycle. Chem. Rev. 107: 308-341. 685
Navarro, J. M., and O. R. Chaparro. 2002. Grazing-filtration as feeding mechanisms in motile 686
specimens of Crepidula fecunda (Gastropoda : Calyptraeidae). Journal of Experimental 687
Marine Biology and Ecology 270: 111-122. 688
Navarro, J. M. and others 2013. Impact of medium-term exposure to elevated pCO2 levels on 689
the physiological energetics of the mussel Mytilus chilensis. Chemosphere 90: 1242-690
1248. 691
26 Newell, R. C., and L. H. Kofoed. 1977. Adjustment of components of energy-balance in 692
gastropod Crepidula fornicata in response to thermal acclimation. Mar. Biol. 44: 275-693
286. 694
Noisette, F., J. Richard, I. Le Fur, L. Peck, D. Davoult, and M. Martin. 2015. Metabolic 695
responses to temperature stress under elevated pCO2 in the slipper limpet Crepidula 696
fornicata. J. Molluscan Stud. 81: 238-246.
697
Orr, J. C. and others 2005. Anthropogenic ocean acidification over the twenty-first century and 698
its impact on calcifying organisms. Nature 437: 681-686. 699
Pansch, C., I. Schaub, J. Havenhand, and M. Wahl. 2014. Habitat traits and food availability 700
determine the response of marine invertebrates to ocean acidification. Global Change 701
Biology 20: 265-277. 702
Parsons, T. R., M. Takahashi, and B. Hargrave [eds.]. 1984. Biological oceanographic processes 703
(3rd ed). 704
Pörtner, H.-O., and A. P. Farrell. 2008. Physiology and climate change. Science 322: 690-692. 705
Pörtner, H.-O., M. Langenbuch, and B. Michaelidis. 2005. Synergistic effects of temperature 706
extremes, hypoxia, and increases in CO2 on marine animals: from Earth history to global 707
change. J. Geophys. Res.-Oceans 110: C09S10. 708
R Core Team. 2013. R: a language and environment for statistical computing. R Foundation for 709
Statistical Computing. 710
Ragueneau, O. and others 2002. Direct evidence of a biologically active coastal silicate pump: 711
ecological implications. Limnology & Oceanography 47: 1849-1854. 712
Range, P. and others 2014. Impacts of CO2-induced seawater acidification on coastal 713
Mediterranean bivalves and interactions with other climatic stressors. Regional 714
Environmental Change 14 Suppl (1): S19-S30. 715
Range, P. and others 2011. Calcification, growth and mortality of juvenile clams Ruditapes 716
decussatus under increased pCO2 and reduced pH: Variable responses to ocean 717
acidification at local scales? Journal of Experimental Marine Biology and Ecology 396: 718
177-184. 719
Range, P. and others 2012. Seawater acidification by CO2 in a coastal lagoon environment: 720
effects on life history traits of juvenile mussels Mytilus galloprovincialis. Journal of 721
Experimental Marine Biology and Ecology 424: 89-98. 722
Ries, J. B., A. L. Cohen, and D. C. Mccorkle. 2009. Marine calcifiers exhibit mixed responses 723
to CO2-induced ocean acidification. Geology 37: 1131-1134. 724
Smith, S. V., and G. S. Key. 1975. Carbon-dioxide and metabolism in marine environments. 725
Limnology & Oceanography 20: 493-495. 726
Solomon, S. and others [eds.]. 2007. Contribution of working group I to the fourth assessment 727
report of the Intergovernmental Panel on Climate Change. 728
Solorzano, L. 1969. Determination of ammonia in natural waters by the phenolhypochlorite 729
method. Limnology & Oceanography 14: 799-801. 730
Somero, G. 2010. The physiology of climate change: how potentials for acclimatization and 731
genetic adaptation will determine "winners" and "losers". J. Exp. Biol. 213: 912-920. 732
Stocker, T. F. and others 2013. Climate Change 2013. The Physical Science Basis. Working 733
Group I Contribution to the Fifth Assessment Report of the Intergovernmental Panel on 734
Climate Change. In C. U. Press [ed.]. Groupe d'experts intergouvernemental sur 735
l'evolution du climat/Intergovernmental Panel on Climate Change-IPCC, C/O World 736
Meteorological Organization, 7bis Avenue de la Paix, CP 2300 CH-1211 Geneva 2 737
(Switzerland). 738
Sylvester, F., J. Dorado, D. Boltovskoy, A. Juarez, and D. Cataldo. 2005. Filtration rates of the 739
invasive pest bivalve Limnoperna fortunei as a function of size and temperature. 740
Hydrobiologia 534: 71-80. 741
27 Thomsen, J., I. Casties, C. Pansch, A. Kortzinger, and F. Melzner. 2014. Food availability 742
outweighs ocean acidification effects in juvenile Mytilus edulis: laboratory and field 743
experiments. Global Change Biology 19: 1017-1027. 744
Thomsen, J., and F. Melzner. 2010. Moderate seawater acidification does not elicit long-term 745
metabolic depression in the blue mussel Mytilus edulis. Mar. Biol. 157: 2667-2676. 746
Tomanek, L., M. J. Zuzow, A. V. Ivanina, E. Beniash, and I. M. Sokolova. 2011. Proteomic 747
response to elevated pCO2 level in eastern oysters, Crassostrea virginica: evidence for 748
oxidative stress. J. Exp. Biol. 214: 1836-1844. 749
Vargas, C. A. and others 2013. CO2-driven ocean acidification reduces larval feeding efficiency 750
and change food selectivity in the mollusk Concholepas concholepas. Journal of 751
Plankton Research in press. 752
Von Bertalanffy, L. 1951. Metabolic types and growth types. The American Naturalist 85: 111-753
117. 754
Von Bertalanffy, L. 1964. Basic concepts in quantitative biology of metabolism. Helgoland 755
Marine Research 9: 5-37. 756
Waldbusser, G. G., and J. E. Salisbury. 2013. Ocean acidification in the coastal zone from an 757
organism's perspective: multiple system parameters, frequency domains, and habitats. 758
Annual Review of Marine Science 6: 221-247. 759
Waldbusser, G. G., E. P. Voigt, H. Bergschneider, M. A. Green, and R. I. Newell. 2011. 760
Biocalcification in the eastern oyster (Crassostrea virginica) in relation to long-term 761
trends in Chesapeake Bay pH. Estuaries and Coasts 34: 221-231. 762
Wolf-Gladrow, D. A., R. E. Zeebe, C. Klaas, A. Kortzinger, and A. G. Dickson. 2007. Total 763
alkalinity: the explicit conservative expression and its application to biogeochemical 764
processes. Marine Chemistry 106: 287-300. 765
Zeebe, R. E. 2011. History of seawater carbonate chemistry, atmospheric CO2, and ocean 766
acidification, p. 141-165. In R. Jeanloz [ed.], Annual Review of Earth and Planetary 767
Sciences, Vol 40. Annual Review of Earth and Planetary Sciences. Annual Reviews. 768 769 770 771 772 773 774 775 776 777 778 779 780
28
Acknowledgments
781
The authors thank the “Marine Operations and Services Department” at the Station Biologique 782
de Roscoff for the underwater sampling. We also thank the “Multicellular Marine Models” staff,
783
and especially Ronan Garnier, for providing microalgae and their help for building the aquarium 784
system. In addition, we are grateful to SOMLIT (Service d’Observation en Milieu LITtoral, 785
INSU-CNRS) for providing the abiotic parameter datasets. We are also grateful to Roseline 786
Edern for her help with cytometry flux analysis. We really appreciated the editor and reviewers’ 787
helpful and constructive comments which greatly improved this manuscript. This work was 788
supported by the CALCAO project, which received funding from the Brittany Regional 789
Council, and contributed to the ‘‘European Project on Ocean Acidification’’ (EPOCA) funded 790
by the European Community’s Seventh Framework Programme (FP7/2007-2013) under grant 791
agreement no. 211384. It was also supported by the Interreg IV a France (Channel) – England 792
Marinexus project no. 4073 funded by the FEDER program. 793