ÉCOLE DE TECHNOLOGIE SUPÉRIEURE UNIVERSITÉ DU QUÉBEC
MANUSCRIPT-BASED THESIS PRESENTED TO ÉCOLE DE TECHNOLOGIE SUPÉRIEURE
IN PARTIAL FULFILLMENT OF THE REQUIREMENTS FOR THE DEGREE OF DOCTOR OF PHILOSOPHY
Ph.D.
BY Clément CHION
AN AGENT-BASED MODEL FOR THE SUSTAINABLE MANAGEMENT OF NAVIGATION ACTIVITIES IN THE SAINT LAWRENCE ESTUARY
MONTREAL, MAY 5 2011
Cette licence Creative Commons signifie qu’il est permis de diffuser, d’imprimer ou de sauvegarder sur un autre support une partie ou la totalité de cette œuvre à condition de mentionner l’auteur, que ces utilisations soient faites à des fins non commerciales et que le contenu de l’œuvre n’ait pas été modifié.
BOARD OF EXAMINERS
THIS THESIS HAS BEEN EVALUATED BY THE FOLLOWING BOARD OF EXAMINERS
Mr. Jacques-André Landry, Thesis Supervisor
Département de génie de la production automatisée à l’École de technologie supérieure
Ms. Lael Parrott, Thesis Co-supervisor
Département de Géographie à l’Université de Montréal
Mr Robert Hausler, President of the Board of Examiners
Département de génie de la construction à l’École de technologie supérieure
Mr Robert Sabourin, Examiner
Département de génie de la production automatisée à l’École de technologie supérieure
Mr. Arnaud Banos, External Examiner
Research Scientist at Géographie-Cités-UMR 8504, Paris
THIS THESIS WAS PRESENTED AND DEFENDED
BEFORE A BOARD OF EXAMINERS AND MEMBERS OF THE PUBLIC APRIL 29 2011
FOREWORD
When I decided to engage in my PhD project, I had thankfully no idea about what was lying ahead. At approximately the same time, I decided to practice seriously for long-distance runs. I had the brilliant feeling that training for long-distance races would lead me to improve some skills also needed to complete a PhD, including endurance, mental strength, perseverance, humility, toughness, and love for pasta. In fact, a marathon is a breeze! Running is a lonesome experience with performance on race day relying on one’s own preparation and pre-race meal. My PhD had the added social dimension, if not a true human experience of success depending on communication abilities, tact, extreme patience (I was not equipped with this one), regular questioning, and psychological resilience. Eventually, the value of the gained experience has no parallel.
Despite not having anticipated all these differences with a PhD when I started my physical workout, after a few years I discovered another similitude between these two kinds of races, worth mentioning. At approximately ¾ of the race, hitting a wall while running out of vital resources (food in one case, money to buy food in the other), a demon came whispering to me “What are you doing here?” During a marathon, you are lucky if a roadside spectator, noticing you are whiter than your T-shirt and understanding you are probably about to faint, in which case he would feel guilty, starts cheering, allowing you to limp away. On the other hand, when the completion of your PhD appears to be within the realm of fiction, relatives and friends come into play to support and carry you until you cross the finish line.
To conclude this foreword, which appears to be the only section without red-penciling, I would like to mention several principles that have been driving me all along this five-year project. These can be seen as a personal code of conduct. I tried to stimulate the collaboration between researchers, promoting the sharing of high-quality data for the benefit of knowledge discovery. I also tried to bridge the gap between some isolated research areas since I strongly believe in multidisciplinarity (which may sound like a cliché or obviousness for someone studying complex systems but is far from easy in practice). In the context of an applied
project, I paid a lot of attention to the concrete needs and constraints of project partners, while trying to generalize my contributions and make them useful to a larger community of researchers. Finally, I exerted much effort and awareness to be collaborative and transparent in all situations, sharing unpublished analyses with researchers to reduce the delays inherent to the scientific publication process and promote knowledge diffusion. Not claiming that I’ve always succeeded in sticking to these principles, I certainly tried with all my might and will continue to keep them in mind as a line of conduct.
REMERCIEMENTS
J’exprime mes profonds remerciements à mon directeur de recherche, Pr Jacques-André Landry, et ma co-directrice, Pre Lael Parrott, pour leur encadrement et leur soutien tout au long de ma thèse.
Ma thèse de doctorat s’inscrit dans le cadre d’un projet collaboratif, impliquant un nombre important de personnes et d’institutions. Je tiens à remercier toutes les personnes qui en collaborant, de quelque façon que ce soit, ont favorisé la réalisation du travail présenté ici. Nombre d’entre elles sont mentionnées dans cette dissertation et comme il serait impossible de toutes les nommer sans omission, je ne me risquerai pas à l’exercice. À vous qui vous reconnaîtrez, ma reconnaissance est immense. Sans vous, il est évident que ce projet aurait achoppé sur de nombreux obstacles. Je tiens bien sûr à remercier mes collègues du LIVIA (ÉTS) et ceux du laboratoire de systèmes complexes (Université de Montréal) pour l’atmosphère agréable qu’ils ont su créer tout au long de ces cinq années.
Mes remerciements vont également aux organismes subventionnaires qui ont permis à ce projet d’exister, à savoir le Conseil de recherches en sciences naturelles et en génie du Canada (CRSNG) et le Fonds québécois de la recherche sur la nature et les technologies (FQRNT).
Finalement, j’ai une gratitude sans borne pour ma famille, particulièrement mon frère Cédric et ma mère Joëlle, mes amis et ma douce Anne. Votre soutien de tous les instants et vos encouragements sont une richesse et une source d’inspiration sans pareil.
UN SYSTÈME MULTI-AGENTS POUR FAVORISER L’UTILISATION DURABLE DE L’ESTUAIRE DU SAINT-LAURENT PAR LES ACTIVITÉS DE NAVIGATION
Clément CHION RÉSUMÉ
Les gestionnaires de ressources naturelles dans les aires protégées se doivent d’encadrer les activités humaines susceptibles de menacer la santé et/ou l’intégrité des écosystèmes à protéger. Ces systèmes physiques où des humains interagissent avec des ressources naturelles sont appelés systèmes socio-écologiques (SSE) et possèdent les caractéristiques de systèmes complexes adaptatifs (p. ex. coévolution). L’investigation du SSE constitué des activités de navigation et des baleines interagissant dans le parc marin du Saguenay–Saint-Laurent (PMSSL) et la zone de protection marine Estuaire du Saint-Laurent au Québec, Canada, ainsi que sa représentation sous forme d’un système multi-agents sont présentées dans cette thèse. Le simulateur implémenté, appelé 3MTSim (pour Marine Mammal and Maritime Traffic Simulator), est conçu pour aider les gestionnaires des aires marines protégées dans leur objectif de réduire la fréquence et l’intensité des cooccurrences bateau-baleine dans le Saint-Laurent et incidemment les risques de collision.
Les connaissances extraites des analyses de données (relatives aux activités de navigation à moteur et à voile), existantes ou recueillies dans le cadre de ce projet, ont justifié de concentrer l’effort de modélisation sur les excursions commerciales (incluant les excursions d’observation de baleines), les navires de la marine marchande et les paquebots de croisière. Les analyses ont permis pour la première fois de dresser un portrait complet des activités de navigation sur l’ensemble de la région où les baleines se rassemblent en grand nombre pendant la saison estivale. Entre autres résultats, une analyse quantitative a abouti sur une estimation précise du temps total de navigation dans chaque écosystème marin de la région. Cette étude a permis d’identifier les zones utilisées intensivement par les activités de navigation, telles que l’embouchure de la rivière Saguenay et le secteur au large de Les Escoumins.
Plusieurs campagnes d’acquisition de données menées dans le cadre de ce projet ont permis d’identifier des facteurs (p. ex. abondance et distribution des espèces de baleines, lacunes de gestion, décisions des compagnies et des capitaines) favorisant une dynamique collective des « croisières aux baleines » indésirable, tant du point de vue de la conservation que de l’expérience des visiteurs du PMSSL. La rationalité limitée a été choisie comme cadre conceptuel pour étudier la prise de décision des capitaines, et plus généralement comprendre la dynamique du SSE des « croisières aux baleines » au complet. L’éventail des stratégies utilisées par les capitaines de « croisières aux baleines » a été décrit et les résultats de cette investigation vont conduire à un ensemble de recommandations relatives à la gestion durable de ces activités à l’intérieur et aux alentours du PMSSL.
Les résultats des investigations de terrain et de l’analyse des données sur la navigation ont alimenté le processus de construction du modèle, incluant une représentation explicite de la prise de décision des capitaines de « croisières aux baleines ». Les analyses ont démontré que les navires de la marine marchande et les paquebots de croisière suivent des routes prévisibles avec peu de variabilité. Par conséquent, une approche de modélisation complexe basée sur le comportement des pilotes a été écartée au profit d’une approche statistique, justifiée par la quantité importante de données historiques de grande qualité disponibles pour ces deux composantes.
L’approche de modélisation par patrons (« pattern-oriented modelling ») s’est avérée performante pour sélectionner un modèle valide des excursions d’observation des baleines lorsque couplé à un modèle à l’échelle de l’individu des mouvements de baleines. Les simulations effectuées ont confirmé que les capitaines d’excursion privilégient l’observation de quelques rares espèces de rorquals (p. ex. baleines à bosse), boudant l’espèce la plus abondante, à savoir le petit rorqual. Par conséquent, des simulations ont été effectuées avec 3MTSim visant à quantifier l’impact d’un changement de stratégie décisionnelle des capitaines d’excursions, tant sur la nature de l’exposition des baleines aux bateaux (intérêt pour la conservation) que sur le contenu des excursions (intérêt commercial). Les résultats ont montré que des capitaines virtuels soucieux d’éviter les zones d’observation surencombrées et/ou cherchant à augmenter la diversité des espèces observées entraînait des gains statistiquement significatifs relativement aux aspects de conservation sans affecter les caractéristiques importantes des excursions. Enfin, les bonnes performances du modèle des déplacements de bateaux assurent une utilisation sécuritaire de 3MTSim comme un outil d’aide à la décision pour la gestion, dans la mesure où ses limites sont comprises et considérées dans l’interprétation des résultats.
Mots-clés : système multi-agents, trafic maritime, système socio-écologique, aires marines protégées, conservation, mammifères marins, fleuve Saint-Laurent, rationalité limitée, prise de décision, modélisation orientée par patrons, interactions bateau-baleine.
AN AGENT-BASED MODEL FOR THE SUSTAINABLE MANAGEMENT OF NAVIGATION ACTIVITIES IN THE SAINT LAWRENCE ESTUARY
Clément CHION ABSTRACT
Natural resource managers of protected areas are concerned with the management of human activities potentially harmful to ecosystems’ health and/or integrity. These systems where human interact with natural resources are called social-ecological systems (SES) and possess the characteristics of complex adaptive systems (e.g. co-evolution). The SES of navigation activities and whales interacting within the Saguenay–St. Lawrence Marine Park (SSLMP) and the projected St. Lawrence Estuary Marine Protected Area in Quebec, Canada, has been investigated and modelled using the agent-based modelling (ABM) technology: The resulting Marine Mammal and Maritime Traffic Simulator (3MTSim) is designed to support marine protected area managers in their effort to reduce the frequency and intensity of boat-whale co-occurrences within the St Lawrence Estuary and mitigate the risks of vessel strikes. This dissertation presents the building process of the 3MTSim’s boat ABM.
The knowledge extracted from analyses of gathered and collected data relative to all forms of sailing and motorized navigation supported the decision to first focus on the modelling of commercial excursions (including whale-watching trips), cargo ships, and cruise liners. Data analyses allowed, for the first time, to draw a comprehensive portrait of navigation activities throughout the region where whales congregate in great numbers during the summer season. Among others, a quantitative analysis led to an accurate estimate of the total navigation time within each separate ecosystem of the region. This study identified areas intensively used by maritime traffic such as the mouth of the Saguenay River and offshore Les Escoumins. Several field campaigns carried out in the context of this project allowed to link some undesirable collective patterns of whale-watching excursions (regarding both whale conservation and SSLMP visitors’ experience) with contextual factors including whale species’ abundance and distribution, management gaps, and companies and captains’ decisions. The bounded rationality framework was chosen to investigate captains’ decision making and more generally the dynamics of the whole whale-watching SES. A portrait of the decision strategies followed by whale-watching captains has been drawn. The results will lead to a set of recommendations regarding the sustainable management of whale-watching excursions in and around the SSLMP.
Results from field investigations and data analyses have fed the model building process, including an explicit representation of the whale-watching captains’ decision making. Data analyses revealed that cargo ships and ocean liners tend to follow predictable routes with low variability. Consequently, a complex behavioural modelling approach was deemed unnecessary in favour of a statistical approach, justified by the large volume of high-quality historical data available for both components.
The pattern-oriented modelling approach proved appropriate for selecting a valid model of whale-watching excursions. Model simulations confirmed that whale-watching captains do favour the observation of a few rare rorqual species (e.g. humpback whales), leaving aside the most abundant one, namely the minke whales. Therefore, 3MTSim was run to quantify the impact that whale-watching captains changing their decision strategy could have on both whale exposure to boats (conservation concern) and excursion content (commercial concern). It was found that captains willing to avoid crowded observation sites and/or seeking to increase the diversity of species observed could have statistically significant benefits regarding conservation issues without affecting important features of their excursions. Finally, the convincing performance of the 3MTSim’s boat ABM ensures its safe use as a decision-support tool for management insofar as model limitations are understood and accounted for in the results and discussion.
Keywords: agent-based model, maritime traffic, social-ecological system, marine protected area, conservation, marine mammals, St. Lawrence river, bounded rationality, decision making, pattern-oriented modelling, boat-whale interactions.
TABLE OF CONTENTS
Page
INTRODUCTION ...1
CHAPTER 1 THE 3MTSim PROJECT ...21
1.1 Partners and contributors ...21
1.2 General description ...22 1.2.1 Deliverables ... 22 1.2.2 Data ... 24 1.2.2.1 Maritime traffic ... 25 1.2.2.2 Commercial excursions ... 27 1.2.2.3 Ferries ... 28 1.2.2.4 Yachting ... 28
1.2.2.5 Data acquisition campaigns ... 29
1.3 Problematic and methodology relative to the 3MTSim project ...30
1.3.1 Gathering maritime traffic data ... 31
1.3.2 Characterization of navigation activities ... 31
1.3.3 Conceptual models ... 32
1.3.4 Elicitation of captains’ decision making ... 33
1.3.5 Dynamics of the 3MT-SES ... 33
1.3.6 Model implementation ... 34
1.3.7 Model verification ... 34
1.3.8 Model validation ... 35
1.3.9 Model testing ... 35
1.4 Contributions to the 3MTSim project ...35
1.5 Description of the 3MTSim simulator ...36
1.5.1 Visualization modes ... 36
1.5.2 Model parameters ... 38
1.5.3 Post-treatment modules ... 39
CHAPTER 2 LITERATURE REVIEW ...41
2.1 Agent-based modelling ...41
2.1.1 History and terminology ... 41
2.1.2 Agent ... 43
2.1.3 ABM properties ... 45
2.1.4 Applications ... 47
2.1.4.1 Theoretical use ... 48
2.1.4.2 Management of human activities in SESs ... 48
2.1.5 Challenges in ABM... 50
2.1.5.1 Representation of human decision making ... 50
2.1.5.2 Model verification and validation ... 53
2.2 Insight into human decision making in cognitive psychology ...55
2.2.2 Human decision making ... 56
2.2.3 Metaphors of the mind ... 56
2.2.4 Normative and descriptive models of decision making ... 56
2.2.5 Instrumental rationality ... 57
2.2.6 Alternative theories of human rationality ... 58
2.2.7 Models of bounded rationality: Cognitive heuristics ... 60
2.2.8 Experts and professional decision making ... 64
CHAPTER 3 UNDERSTANDING SOCIAL-ECOLOGICAL SYSTEMS DYNAMICS THROUGH THE BOUNDED RATIONALITY LENS: INSIGHT FOR THE MANAGEMENT OF WHALE-WATCHING IN THE ST. LAWRENCE ESTUARY REGION, QUÉBEC, CANADA ...65
3.1 Manuscript submission information ...65
3.2 Abstract ...66
3.3 Introduction ...66
3.4 Case study ...71
3.5 Methods ...75
3.6 Results ...78
3.6.1 Outcomes (O): Dynamics of users (U)’ activities and critical issues for the resource (RU) ... 78
3.6.2 Interactions (I): Elicitation of users (U)’ interactions with subsystems contributing to critical outcomes (O) ... 79
3.6.2.1 The task environment blade ... 80
3.6.2.2 Users (U): Captains’ cognitive blade ... 82
3.7 Discussion ...87
3.8 Conclusion ...89
CHAPTER 4 ELEMENTS OF WHALE-WATCHING CAPTAINS’ DECISION MAKING: COLLECTIVE STRATEGIES AND DECISION HEURISTICS ...91
4.1 Summary of field campaigns and data analyses ...92
4.2 Whale-watching captains’ cognition ...94
4.2.1 External factors ... 96 4.2.2 Information ... 96 4.2.2.1 Sensory system... 96 4.2.2.2 Communication ... 97 4.2.2.3 Memory system ... 97 4.2.3 Cognitive system ... 99
4.2.3.1 Beliefs and knowledge ... 99
4.2.3.2 Desires, fears and preferences ... 100
4.2.3.3 Expectations ... 100
4.2.3.4 Goals and subgoals ... 101
4.2.3.5 Decision making system: heuristics and strategies to deal with uncertainty ... 101
4.3 Conclusion and future works ...104
CHAPTER 5 RAYBAPP–A RAY-BASED PATH-PLANNING ALGORITHM FOR AUTONOMOUS MOBILE OBJECTS IN LARGE 2D RASTER-BASED ENVIRONMENTS ...107
5.1 Manuscript submission information ...107
5.2 Abstract ...108
5.3 Introduction ...109
5.4 Classical algorithms used for pathfinding ...111
5.5 Ray-Based Path-planning algorithm (RayBaPP) ...113
5.5.1 General principles of RayBaPP ... 113
5.5.2 Creation of a coarse waypoints list ... 114
5.5.3 Smoothing the coarse path ... 115
5.5.4 Position interpolation during the simulation ... 116
5.5.5 Optimization of the solution path search ... 116
5.5.5.1 Removal of useless candidate paths to prevent their exponential growth... 116
5.5.5.2 Best-first search approach to promote the shortest paths ... 117
5.6 Results and discussion ...117
5.6.1 Methods... 117 5.6.2 Computational results ... 118 5.6.2.1 Computational time ... 118 5.6.2.2 Memory requirement ... 119 5.6.2.3 Spatial exploration ... 120 5.6.3 Spatial results ... 121 5.6.3.1 Square-shaped obstacles ... 121 5.6.3.2 U-shaped obstacle ... 122 5.6.3.3 Spiral ... 123 5.6.4 Discussion ... 123 5.6.4.1 Algorithms performance ... 123 5.6.4.2 Path shape ... 124 5.6.4.3 General points ... 124
5.6.4.4 RayBaPP limitations and potential improvements ... 124
5.7 Example application of RayBaPP ...126
5.7.1 Datasets ... 126
5.7.2 Experiments ... 127
5.7.3 Results and discussion ... 130
5.8 Conclusion ...132
CHAPTER 6 ELICITING COGNITIVE PROCESSES UNDERLYING PATTERNS OF HUMAN-WILDLIFE INTERACTIONS FOR AGENT-BASED MODELLING ...133
6.1 Manuscript submission information ...133
6.2 Abstract ...134
6.4 Material and methods ...138
6.4.1 Study area... 138
6.4.2 The Marine Mammal and Maritime Traffic Simulator (3MTSim) ... 140
6.4.2.1 Environment: Geographical Information System (GIS)-based model ... 141
6.4.2.2 Whale movements: Individual-Based Model (IBM) ... 141
6.4.2.3 Boat movements: Agent-Based Model (ABM) ... 142
6.4.3 Description of the whale-watching ABM with the ODD protocol ... 143
6.4.3.1 Overview ... 143
6.4.3.2 Design concepts ... 147
6.4.3.3 Details ... 151
6.4.4 Model selection and validation: Pattern-oriented modelling (POM) ... 152
6.4.4.1 POM process ... 152 6.4.4.2 Simulation experiments ... 158 6.5 Results ...158 6.6 Discussion ...163 6.7 Conclusion ...165 6.8 Acknowledgments ...167
CHAPTER 7 INSIGHTS FROM AGENT-BASED MODELLING TO SIMULATE WHALE-WATCHING TOURS: INFLUENCE OF CAPTAINS’ STRATEGY ON WHALE EXPOSURE AND EXCURSION CONTENTS ...169
7.1 Manuscript submission information ...169
7.2 Introduction ...170
7.3 Overview of 3MTSim ...173
7.3.1 Spatial environment ... 173
7.3.2 Whale individuals ... 174
7.3.3 Whale-watching boat captain agents ... 175
7.4 Methods ...177
7.4.1 Rules considered by whale-watching captains to choose a whale to observe ... 177
7.4.2 Alternative decision making strategies ... 179
7.4.2.1 Preference for less crowded observation sites (DMM-1) ... 180
7.4.2.2 No preference ranking of whale species (DMM-2) ... 180
7.4.3 Design of experiment and simulation parameters ... 181
7.4.4 Variables observed ... 182
7.4.4.1 Variables characterizing whales’ exposure to whale-watching boats... 182
7.4.4.2 Variables characterizing excursions’ dynamics ... 183
7.5 Results and discussion ...184
7.5.1 Whale exposure ... 184
7.5.2 Excursion dynamics ... 186
7.6 Conclusion ...188
CHAPTER 8 THE SHIPPING MODEL ...191
8.1 Compulsory pilotage ...191
8.2 Data ...191
8.3 Shipping model description ...192
8.3.1 General characteristics of 3MTSim ... 192
8.3.2 Ship interactions with other agents ... 193
8.3.3 Conceptual model ... 194
8.3.4 Shipping model dynamics ... 196
8.4 Model validation ...202
8.4.1 Static attributes and transit frequency verification ... 202
8.4.1.1 Total number of trips instantiated ... 202
8.4.1.2 Number of trips by month and vessel type (frequency) ... 203
8.4.1.3 Ships’ characteristics ... 203 8.4.2 Spatial validation ... 204 8.4.2.1 Overall performance ... 204 8.4.2.2 Error map ... 205 8.4.3 Speed validation ... 206 8.4.3.1 Overall performance ... 207 8.4.3.2 Histogram of errors ... 207 8.4.3.3 Error map ... 209
8.5 Discussion and future work ...209
CONCLUSION ...211
FUTURE WORK ...215
APPENDIX I PORTRAIT DE LA NAVIGATION DANS LE PARC MARIN DU SAGUENAY–SAINT-LAURENT––CARACTÉRISATION DES ACTIVITÉS SANS PRÉLÈVEMENT DE RESSOURCES ENTRE LE 1ER MAI ET LE 31 OCTOBRE 2007 ...219
APPENDIX II APPROVAL OF THE SURVEY CAMPAIGN BY ETHICS COMMITTEES ...307
APPENDIX III WHALE-WATCHING EXCURSIONS’ DYNAMICS ...311
1 Whale-watching companies’ potential activities ... 311
2 Success in observing whales ... 311
3 Species relative attractiveness for observation ... 312
4 Spatial patterns of activity relative to homeport ... 313
5 Boat aggregation in the vicinity of whales by species ... 314
6 Other activities ... 315
APPENDIX IV SPATIOTEMPORAL PATTERNS OF WHALE SPECIES’ DYNAMICS ...316
1 Temporal presence of whale species in the SSLMP region ... 316
3 Short-term spatiotemporal stability of species in the region ... 318
APPENDIX V PSEUDO-CODE OF THE RAYBAPP ALGORITHM ...321
APPENDIX VI PSEUDO-CODE OF THE SMOOTHING FUNCTION ...323
APPENDIX VII BOUNDED RATIONALITY AND COGNITIVE HEURISTICS ...324
1 Principle ... 324
2 Cognitive heuristics for decision making ... 325
2.1 Formalism ... 325
2.2 Satisficing ... 326
2.3 Tallying ... 326
2.4 Take The Best ... 327
LIST OF TABLES
Page Table 0.1 Overview of the objective and methodology relative to the building
process of a model useful for management ... 17 Table 1.1 Summary of data used in the 3MTSim project. Adapted from (Parrott
et al., 2010) ... 24 Table 3.1 Description of the SSLMP whale-watching SES using Ostrom’s
terminology (Ostrom 2009) ... 76 Table 3.2 Mechanisms favoring the three issues of whale exposure to
whale-watching boats and their links with subsystems. For U, we differentiate captains from companies ... 84 Table 4.1 Summary of data collection, analyses, and extracted knowledge about
whale-watching captains’ decision making ... 93 Table 4.2 Approximate species-dependant detection distance under ideal and
average weather conditions (Sarah Duquette, GREMM, personal communication) ... 97 Table 5.1 Summary of A* and RayBaPP performances for the six selected
trajectories shown in Figure 5.8. The values in bold identify the algorithm that produced the most realistic trajectory in terms of total length, whereas underlined values identify the shortest simulated
trajectory ... 131 Table 6.1 Details of the tested decision making models ... 156 Table 6.2 “Global ranking” approach for the selection of the best-performing
decision making model ... 159 Table 6.3 Decision making models’ performance on the boat density pattern
(Kolmogorov-Smirnov statistics, KS; Normalized Mean Absolute Error, NMAE). Values in boldface indicate the best performance
amongst models ... 162 Table 7.1 Whale species’ setting used for simulations ... 182 Table 7.2 Increase in the total number of individual whales observed each
simulated day for both alternative DMM in comparison to the reference model ... 184
Table 7.3 Contribution of each species to overall observation of activities ... 186 Table 7.4 Average and standard deviation of proportion of time spent in
observation during excursions ... 186 Table 7.5 Proportion of the total observation time an excursion is alone (1) or
with another boat (2) observing a pod ... 187 Table 8.1 Overall NMAE and NME for ships’ speed values, for model’s cells
LIST OF FIGURES
Page
Figure 0.1 Study area. ... 6
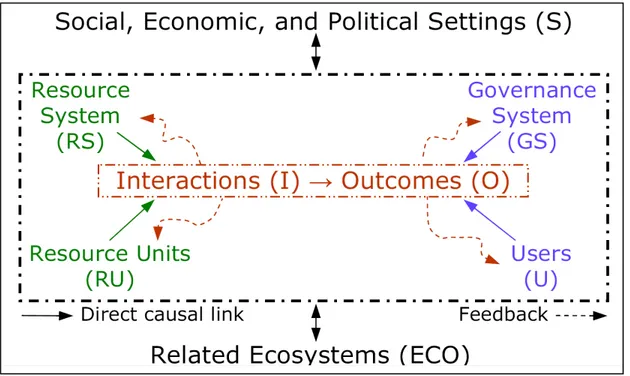
Figure 0.2 Core subsystems in a social-ecological system. ... 8
Figure 0.3 Illustration of the concept of boat-whale spatiotemporal co-occurrence (or encounter) at a distance d < dref , with dref a reference distance fixed for a given analysis. ... 14
Figure 0.4 Overview of the modelling process. ... 15
Figure 1.1 The 3MTSim system. Reproduced from Parrott et al. (2010) ... 23
Figure 1.2 INNAV list of codes used for vessel type. ... 27
Figure 1.3 Snapshot of the 3D visualization mode showing 3MTSim agents and environment ... 37
Figure 1.4 Snapshot of the NASA World Wind based visualization mode showing agents and environment ... 37
Figure 1.5 Snapshot showing the parameters panel (red box) within the 3MTSim’s interface ... 38
Figure 1.6 Interface of the 3MTSim ArcToolbox ... 39
Figure 2.1 Components and properties of an ABM. ... 47
Figure 2.2 Different views of rationality. ... 59
Figure 3.1 Ostrom’s general framework for the analysis of SESs’ sustainability. ... 67
Figure 3.2 A conceptualization of bounded rationality applied to the study of SESs centered on natural resource users (U). This schema symbolizes the coarse adaptation of users (U) to the complex decision task defined by external subsystems (RU+RS+S+GS), producing the observed outcomes (O). The terminology used for the description of SES’s subsystems is drawn from Ostrom (2009). ... 70
Figure 3.3 Study area. The toponyms in bold are towns serviced by whale-watching companies. The triplet (a;b;c) under toponyms stands for the number of a: companies; b: commercial excursion permits; and c: active boats in 2010. ... 72
Figure 3.4 Overview of the major stakeholders and their interactions in the social-ecological system of whale-watching in and around the Saguenay–Saint Lawrence Marine Park (SSLMP). ... 74 Figure 4.1 Conceptual model of factors influencing whale-watching captains’
decisions relative to the task of whale localization. Dark grey boxes relate to the external environment, whereas light grey boxes relate to the captain’s inner environment including his sensory and cognitive
abilities. ... 95 Figure 5.1 Example (sketch) of the creation of the coarse waypoints list. Starting
from point O, the agent’s goal is to reach D avoiding the grey dotted area (non passable zones). A first ray is cast from O to D (thin black dashed line) keeping track of the first segment [AB] that crosses the obstacle (thick plain line). From the midpoint of [AB] a ray is cast perpendicularly in each direction (thick dashed line), and only the attainable point P1 is recorded since no passable point is found in the
alternate direction. Then P1 is inserted in a waypoints list Lw between
O and D. Then from P1 the same procedure is repeated between P1
and D and P2 is found and introduced within Lw between P1 and D.
Finally, the ray cast between P2 and D crosses the obstacle between F
and G, giving two alternate points P4 and P3 and therefore two
alternate paths Lw={O;P1;P2;P3;D} and Lw’={O;P1;P2;P4;D}. Since Lw
is complete and allows the agent to join O to D, the algorithm stops and returns Lw as the final coarse waypoints list of the planned
trajectory. ... 115 Figure 5.2 Computational time in milliseconds (ms) for different environment
structures and dimensions. Time assessment accuracy is approximate
for durations less than 1 ms. ... 119 Figure 5.3 Memory requirement for different environment structures and
dimensions. The memory is computed as the difference between the maximum and minimum free memory available during the path search
process. ... 120 Figure 5.4 Number of cells explored during the path search for different
environment structures and dimensions. ... 121 Figure 5.5 RayBaPP (left), A* (center) and Dijkstra (right) trajectories returned
for an environment with square-shaped obstacles. Obstacles are white,
traversable cells are black and the output path is grey. ... 122 Figure 5.6 RayBaPP (left), A* (center) and Dijkstra (right) trajectories returned
for a U-shaped environment. Obstacles are white, traversable cells are
Figure 5.7 RayBaPP (left), A* (center) and Dijkstra (right) trajectories returned for a spiral environment. Obstacles are white, traversable cells are
black and the output path is grey. ... 123 Figure 5.8 The six maps above present real boat trajectories (black thick lines)
extracted from one of the three independent datasets at hand. For each real trajectory, the corresponding one returned by A* is plotted with a black thin line whereas a dashed line represents the one produced by RayBaPP. The binary back ground is white when navigable, and grey otherwise (the threshold value is chosen according to the draught of
the vessel). ... 128 Figure 6.1 Study area. ... 139 Figure 6.2 Simulator overview. 3MTSim is made of three distinct blocks that are
an individual-based model (IBM) of whale movements, a geographical information system (GIS) of the physical environment, and an agent-based model (ABM) of boat movements guided by operators’ decision making; the boat model itself is made of five
submodels, the whale-watching ABM being the one described here. ... 141 Figure 6.3 Conceptual model of whale-watching captains’
sensing-objective-decision-action process. This Figure shows the sequence of operations performed by each whale-watching captain at each time step during
the simulation. ... 146 Figure 6.4 POM approach for the selection and validation of the whale-watching
ABM. ... 153 Figure 6.5 Performance of the four decision making models on the set of primary
patterns for the ABM selection process. For each pattern, the error (%) is based on a metric (KS statistics for activity and species, NMAE for
length, and % overlap for home range). ... 159 Figure 6.6 Comparison between the real whale-watching spatial distribution (left)
and the aggregated outputs of 45 replications of the whale-watching model with the Take The Best decision making heuristic (right). The whales’ distribution and abundance scenario is from July 1st to 25th in
2007. The kernel is created with a 3 km radius and a resolution of 1 km, based on GPS tracking of real excursions (left) and model output
(right), with a 1-minute resolution. ... 161 Figure 6.7 Emergent observation sites (circled in black) for a 1-day simulation
with Take The Best. This secondary pattern is consistent with field
Figure 7.1 The study area encompassing the Saguenay–Saint-Lawrence Marine
Park and the projected Saint-Lawrence Estuary marine protected area. ... 172 Figure 7.2 Sequence of actions (from top to bottom) that each captain agent goes
through at each time step during the simulation. ... 176 Figure 7.3 Boxplots of observation sequence durations for the three tested
DMMs. No statistical difference was noticed between the distributions. ... 185 Figure 7.4 Boxplots representing the number of boats on observation sites for
each tested DMM. ... 188 Figure 8.1 Model area. ... 192 Figure 8.2 Monte-Carlo method for the stochastic selection of values from a
continuous variable X given its cumulative distribution function cdfx,
and a random number vi uniformly drawn on [0,1). ... 195
Figure 8.3 Monte-Carlo method for the stochastic selection of values from a discrete variable X given its cumulative histogram hist_cumulx, and a
random number vi uniformly drawn on [0,1). ... 196
Figure 8.4 Flowchart of the shipping model dynamics. ... 197 Figure 8.5 Extraction procedure of the closest AIS points to PREVISION
waypoints. ... 200 Figure 8.6 Proportion of trips from each class for the four months (simulation vs.
reality). ... 203 Figure 8.7 Results for the Vmax attribute of ship trips for classes M and T only, for
the June to September period. ... 204 Figure 8.8 Comparison between the kernel density of real observations of
maritime traffic (left) and model output (right). Results are presented qualitatively but the colour scale established from density values is the
same for both maps. ... 205 Figure 8.9 Error map computed from name maps. ... 206 Figure 8.10 Histogram of NMAE for the 1000m×1000m cells... 208 Figure 8.11 Histogram of NMAE weighted by the number of points in each cell. ... 208 Figure 8.12 Histogram of NME for the 1000m×1000m cells. ... 208 Figure 8.13 Error map (NME) for ship speed (1000m×1000m cells). ... 209
LIST OF ABBREVIATIONS
3MT-SES Marine mammal and maritime traffic social-ecological system 3MTSim Marine mammal and maritime traffic simulator
ABM Agent-based model(ing)
ACCOBAMS Agreement on the Conservation of Cetaceans in the Black Sea, Mediterranean Sea, and contiguous Atlantic area
AI Artificial intelligence
AIS Automatic identification system
AOM Activités d’observation en mer (i.e. observation activities at sea) CLSLP Corporation of Lower St. Lawrence Pilots
COSEWIC Committee on the status of endangered wildlife in Canada DAI Distributed artificial intelligence
DPS Distributed problem solving
CCG Canadian coast guard
COLREGS Collision avoidance regulations DFO Department of Fisheries and Oceans
GIS Geographic information system
GREMM Group for research and education on marine mammals
IBM Individual-based model(ling)
IDE Integrated Development Environment IMO International Maritime Organization INNAV Information on navigation system
MAS Multiagent system
MCTS Marine Communication and Traffic Services
MPA Marine protected area
NDM Naturalistic decision making NMAE Normalized mean average error
NME Normalized mean error
POM Pattern oriented modelling
RQUMM Réseau québécois d’urgence pour les mammifères marins SDE Software development environment
SES Social-ecological system
SLEMPA St. Lawrence Estuary marine protected area SSLMP Saguenay–St. Lawrence marine park
INTRODUCTION
0.1 Context
0.1.1 Human impact on ecosystems
Whether it be on the ground, underwater, or up in the air, humans have colonized all dimensions of our living environment (Vitousek et al., 1997). Human expansion comes with a variety of problems for ecosystems exposed to anthropogenic activities. Deforestation, overfishing, and overgrazing are some of the visible consequences of human over-consumption or mismanagement of natural resources observed worldwide (Dietz, Ostrom and Stern, 2003; Halpern et al., 2008; Rapport, Costanza and McMichael, 1998; Vitousek et al., 1997).
The human impact on ecosystems is easily detectable in the case of harvest activities (e.g. clearcutting in forestry). However, some apparently non-consumptive activities have proved to have insidious impacts on ecosystems in the long-term, invisible in the short-term. Widely known examples of such long-term costs include watercourse slow poisoning by poorly treated wastewater, ozone layer depletion caused by aerosols, and global warming induced by greenhouse gas emissions. At a more local scale, this is also the case of negative impacts of human-wildlife interactions, either deliberate (e.g. wildlife viewing activities) or fortuitous (e.g. roadkills). Effects of repeated interaction between human beings and wildlife have proved deleterious for numerous exposed populations (e.g. Bejder et al., 2006; Bugoni, Krause and Petry, 2001; Forman and Alexander, 1998; Wilson et al., 2006) leading some conservation biologists to argue that human disturbance should be considered a part of the predation risk (Frid and Dill, 2002).
The context of the present project is precisely related to the study of human-wildlife interaction, specifically the case of boat-whale encounters within the St Lawrence River Estuary and the Saguenay River in Québec, Canada. Thereafter, details about this specific issue are considered.
0.1.2 Boat-whale interactions
Human impact on marine ecosystems is occurring worldwide in many forms (Halpern et al., 2008). In this section, the issue of boat-whale fortuitous (i.e. collisions and noise) and deliberate (i.e. whale-watching) interactions potentially harmful to marine ecosystems are discussed.
0.1.2.1 Collisions
Ship strikes are the first type of interactions that come to mind due to their visible, dramatic outcomes (Jensen and Silber, 2004; Laist et al., 2001). Accurately quantifying the number of collisions with whales and the impact at the population level is challenging. Ship strikes are not systematically reported or even noticed by mariners and several factors certainly lead to an underestimation of these events (Laist et al., 2001). For instance, 40% of the endangered North Atlantic right whale (Eubalaena glacialis) mortality is attributable to collisions with boats, with a detection rate of carcasses as low as 17% for this population (Kraus et al., 2005). This suggests that ship strikes are more common than previously thought, which could compromise the long-term recovery of some exposed endangered whale populations (Kraus et al., 2005; Laist et al., 2001). Serious and lethal injuries mostly imply ships longer than 80 m (Laist et al., 2001), with approximately 80% of mortality at speeds greater than 15 knots (Vanderlaan and Taggart, 2007). Among the 11 whale species involved in collisions, the most reported are fin (Balaenoptera physalus), right, and humpback whales (Megaptera novaeangliae), although several biases apply to this portrait (Laist et al., 2001).
Mitigation measures to decrease the risk of lethal injuries have been proposed (Vanderlaan and Taggart, 2007) and successfully implemented worldwide to reduce human induced mortality of the North Atlantic right whales (Vanderlaan and Taggart, 2009) and other marine mammal populations (e.g. Laist and Shaw, 2006). Ongoing scientific efforts occur in several regions to better characterize the collision issue and address it through mitigation measures (e.g. Betz et al., 2010; Panigada and Leaper, (in press); Williams and O'Hara, 2010). The recent holding of a workshop dedicated to the reduction of the risk of collisions
between vessels and cetaceans (International Whaling Commission and ACCOBAMS, 2010) along with the guidance document recently published by IMO to minimize the risk of ship strikes (International Maritime Organization (IMO), 2009) demonstrate the importance of this issue worldwide.
0.1.2.2 Noise
Collisions do not represent the only navigation-related deleterious side effect on whale populations. Ship noise, one of the top-most contributors in background ocean noise with seismic exploration and sonars (Nowacek et al., 2007), is also a stressor for marine wildlife. Noise is of special concern for cetaceans that strongly rely on sound for communication and echolocation (Weilgart, 2007). Typically, large mysticetes (i.e. baleen whales such as blue, fin, minke, and humpback whales) use low frequencies (infrasonics) ranging from 10 to 2000 Hz, whereas odontocetes (i.e. tooth whales such as belugas and sperm whales) use mid to high frequencies ranging from 1 to 150 kHz (Richardson et al., 1995).
Boat noise is mostly generated by propellers and by hull vibration induced by inside machinery. Noise frequencies mostly depend on the size of the boat with the general rule that larger (resp. smaller) boats produce more sounds in low (resp. high) frequencies (Richardson et al., 1995).
The response of whales to noise falls into three categories (Nowacek et al., 2007):
1) Behavioural: change in surfacing, diving, and heading patterns, as well as abandonment/disruption of an activity.
2) Acoustic: change of type or timing of vocalization, masking effect.
3) Physiological: increased stress level, change in heart rate, temporary and permanent threshold shifts (i.e. hearing damage).
Whale exposure to noise has been shown to be related to other long-term effects such as stranding and habitat abandonment in some cases (Weilgart, 2007).
Whale-watching activities have also been associated with noise disturbance. Erbe (2002) studied the impact of whale-watching proximity to killer whales and found that a zodiac with twin 150-hp engines (low-average power) at 51 km/h (~27.5 knots) in a calm sea is audible at 16 km underwater and has the potential to mask whale calls at up to 14 km, inducing behavioural changes at 200 m and provoking temporary and in some cases permanent hearing damages after sufficiently long expositions. Despite evidence that noise can cause major damage to whales, it is not yet possible to establish acceptable levels of noise exposure for each of the 84 species of whales (Nowacek et al., 2007), of interest for management purpose.
0.1.2.3 Whale-watching
According to Hoyt (2007), “Whale watching is defined as tours by boat or air or from land, with some commercial aspect, to see or listen to any of the 84 species of whale, dolphin, or porpoise”. Whereas the first commercial whale-watching excursions can be traced back to 1955 in San Diego, its dramatic rise coincides with the post-1986 moratorium on commercial whaling by the International Whaling Commission (IWC). From an economic point of view, whale-watching is a non-consumptive alternative to whaling bringing in more than US$1.25 billion a year to more than 500 local communities of some 87 countries all around the world, getting more than 10 million tourists closer to marine mammals (Hoyt, 2001; 2007). A study requested by the Australian government, released in 2009, concluded that “whales are worth more alive than dead” (Syneca Consulting Pty Ltd, 2009).
Despite the interesting nature of whale-watching as an alternative to commercial whaling, two decades of research have begun to reveal the hidden cost of this non-consumptive activity (Baker and Herman, 1989; Lusseau and Bejder, 2007). Although short-term behavioural changes (e.g. change in diving pattern) have been noticed in targeted marine mammal populations in many places all around the world due to whale-watching (e.g. Constantine, Brunton and Dennis, 2004; Corkeron, 1995), establishing a link between short-term individual effects and long-short-term population-wide impact is challenging (Corkeron,
2004). However, several researches already came up with conclusions of long-term deleterious effects of boat-based whale-watching activities on targeted populations (Bejder et al., 2006; Lusseau, Slooten and Currey, 2006; Williams, Lusseau and Hammond, 2006). Long-term effects on marine mammal populations include habitat abandonment (Lusseau, Slooten and Currey, 2006), changes in the whales’ energetic budget (Williams, Lusseau and Hammond, 2006), and decrease in their reproductive success (Bejder et al., 2006). These results have crucial implications: Sustainability of whale-watching can no longer be taken for granted and management efforts must be done to identify and minimize its impact (e.g. whale disturbance) while maximizing its benefits (e.g. tourist educative experience, payoff for local communities) (Higham, Bejder and Lusseau, 2009; Hoyt, 2007).
0.1.3 Study area
0.1.3.1 Portrait
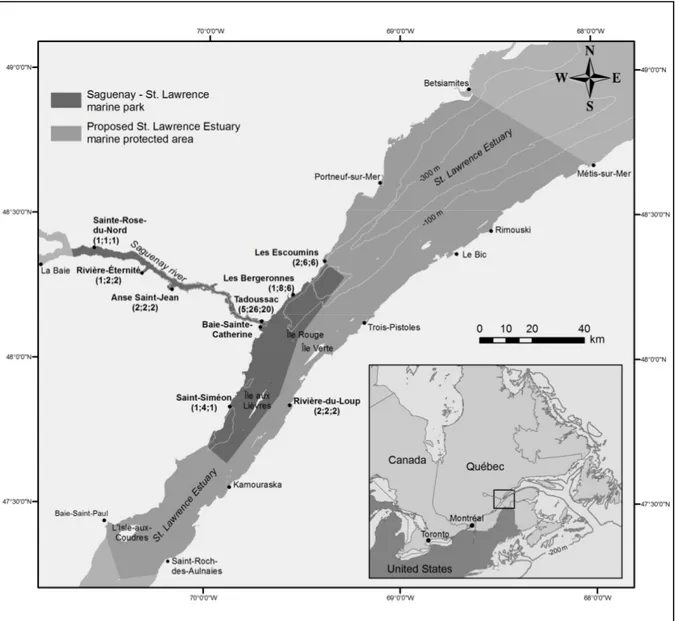
The study area encompasses the portion of the St Lawrence River Estuary from Baie-Saint-Paul to Betsiamites on the North shore, and from Saint-Roch-des-Aulnaies to Métis-sur-Mer on the South shore along with the Saguenay Fjord (cf. Figure 0.1). An exceptional oceanographic phenomenon occurs in the region: The upwelling of cold salty water driven by tides in the Laurentian channel meets with the fresh and warmer waters from the Saguenay River at its mouth, between Tadoussac and Baie-Sainte-Catherine (Simard, Lavoie and Saucier, 2002). This favours the primary productivity of plankton, leading to high concentrations of pelagic fish (e.g. capelin) and euphosiids (e.g. krill), making it an attractive summer feeding ground for marine mammals (Simard and Lavoie, 1999; Simard, Lavoie and Saucier, 2002).
This region is an important habitat for several whale species of critical status according to the Committee on the Status of Endangered Wildlife in Canada (COSEWIC): The resident St. Lawrence beluga (Delphinapterus leucas) is “threatened” (COSEWIC, 2010), and the migratory species North Atlantic blue whale (Balaenoptera musculus) and fin whale (Balaenoptera physalus) are respectively listed “endangered” (Beauchamp et al., 2009) and
of “special concern” (COSEWIC, 2010). In total, up to 13 marine mammal species can be found in the St. Lawrence Estuary which is known to be a summer feeding ground for migratory species (Saguenay–St. Lawrence Marine Park, 2010). Apart from the blue, fin, and beluga whales, two whale species, namely the minke whale (Balaenoptera acutorostrata) and humpback whale (Megaptera novaeangliae), complete the list of the regular visitors: The present study is solely concerned with these five species. Therefore, the generic term whales used in the context of this project will refer to any or all of these five species, if no other mention. Several species of seals, porpoises and dolphins add to the impressive biodiversity of marine mammals present in the area but will not be considered in the current project, either because navigation does not represent an identified threat to them or because of a lack of data.
Figure 0.1 Study area.
The St. Lawrence River is a major commercial seaway linking the Atlantic Ocean with the Great Lakes with approximately 6000 ships taking this route every year, thus passing through the study area. During the summer season (May to October) when whales are abundant in the Estuary, some 23 000 ferry trips, 13 000 commercial excursions, 9200 pleasure craft outings, and 3100 shipping trips take place in the study area for a total of more than 51 000 movements in locations where whale mostly congregate (see Chion et al., 2009 in APPENDIX I for a complete description). The region attracts more than 1 million tourists a year (Gosselin and Priskin, 2009; Gosselin, 2006), being considered by specialists as one of the best places in the world to observe whales in the wild (Scarapaci, Parsons and Lück, 2008).
Added to other environmental issues such as water pollution (e.g. Lebeuf et al., 2004; Martineau et al., 2002; Michaud and Pelletier, 2006), maritime traffic is posing serious threats to the conservation of marine ecosystems. To address the urgent need to protect the St. Lawrence beluga whale population now reduced to approximately 1000 individuals, a long process of public pressure followed by consultations by Parks Canada and Parcs Québec led to the creation of the Saguenay–St. Lawrence Marine Park (SSLMP) in 1998. This national park is jointly managed by the governments of Canada (jurisdiction related to body of water) and of Quebec (jurisdiction related to lands) (Guénette and Alder, 2007), and covers more than 1245 km2 (Figure 0.1). In 2002, based on scientific studies (Michaud and Giard, 1997; 1998), the first version of the Marine Activities in the Saguenay–St. Lawrence Marine Park Regulations was adopted with law enforcement by a team of park wardens (Parks Canada, 2002). In 2004, the Department of Fisheries and Oceans (DFO) identified a 6000 km2 area buffering the SSLMP as a priority for the establishment of a Marine Protected Area (MPA) (Savaria et al., 2003; Tecsult Environnement Inc., 2000) under the Oceans Act (Oceans Act, 1996). The establishment of the proposed St. Lawrence Estuary Marine Protected Area (SLEMPA), identified in Figure 0.1, is still a work in progress.
0.1.3.2 A social-ecological system
The complex system composed of boats, whales, and institutions in the study area falls into the category of social-ecological systems (SESs) (Ostrom, 2009) sometimes referred to as coupled human and natural systems (CHAN) (Liu et al., 2007) or human-environment systems (Clarke, 2002). This section presents the concepts related to the study of SESs along with a description of the studied system according to Ostrom’s framework (Ostrom, 2007; 2009).
Figure 0.2 is an illustration of the core components that make up SESs, after Ostrom’s general framework developed to study the sustainability issue of such systems (Ostrom, 2009). In the rest of this dissertation, the SES of navigation, whales, and related institutions in both the SSLMP and the SLEMPA will be labelled the 3MT-SES standing for marine mammal and maritime traffic social-ecological system.
Figure 0.2 Core subsystems in a social-ecological system. Reproduced from Ostrom (2009)
Using the terminology presented in Figure 0.2, the 3MT-SES can be described as follows: • Resource system (RS): Two contiguous MPAs (SSLMP + SLEMPA).
• Resource units (RU): Marine mammals including the five whales species of interest (cf. section 0.1.3).
• Governance systems (GS): Parks Canada and Fisheries and Oceans Canada federal institutions propose the regulations (after public consultations) and ensure law enforcement over the body of water.
• Users (U): All navigation activities interacting with whales either deliberately (i.e. whale-watching activities, commercial or private) or fortuitously (e.g. shipping industry, ferries, service boats…). Fishing activities, whether recreational or commercial, are marginal in the area so they are not considered in this study.
These four subsystems affect and can be affected by smaller and larger socioeconomic and political settings (S) and ecosystems (ECO). The following examples for the 3MT-SES can be given:
• S: For instance whale-watching tourism demand can be influenced by the international economic context (e.g. the 2008 economic crisis). National-level laws (e.g. Oceans Act), fundamental principles (e.g. free-enterprise principle), and government guidelines (e.g. in 2007, due to poaching issues in Northern national parks, all Parks Canada’s wardens and rangers were temporarily relieved of law enforcement duties) can also interfere with (favour or impede) conservation efforts at the local level.
• ECO: The downstream Gulf of St. Lawrence ecosystem is directly connected to the Estuary. All whales present in the area went through the Gulf at one point in time. Some of the whale’s preys found in the Estuary (e.g. krill) partly come from the Gulf’s primary productivity, influencing in turn the abundance of whale species feeding on them (e.g. blue whale). Moreover, since many whale species feeding in the area are migratory, the recovery of certain stocks may have an impact on the number of individuals visiting the region. For instance, the recovery of the North Atlantic humpback whale population coincides with an increase in the number of observations of this species in the area since the early 2000’s (Stevick et al., 2003).
The four subsystems (RS, RU, GS, and U) are interconnected with each other via such interactions (I) as, for instance, whale disturbance by boats, information exchange between whale-watching captains, or water use conflict between shipping and whale-watching industries. Outcomes (O) either social (e.g. mariners’ compliance level to the regulations) or ecological (e.g. collisions with whales) resulting from these interactions can be measured or tracked to a certain extent.
There exist numerous feedback loops that can affect the dynamics of SESs, identified in Figure 0.2 by unidirectional arrows stemming from O towards the four subsystems. For instance, the recurrence of undesirable behaviours (O) from whale-watching captains (U) in the 1990’s partly contributed to the justification of the SSLMP creation in 1998 (GS) and to regulations in 2002 (Parks Canada, 2002) to limit abuses. Resource-wise, habitat abandonment could hypothetically be observed in whale populations exposed to disturbance if energetic costs would reveal greater than the energetic benefits drawn from foraging preys in the area. The complex set of feedback loops driving the dynamics of an SES must be understood to diagnose correctly some undesirable outcomes (Liu et al., 2007).
0.1.3.3 Special concerns
Both SSLMP and SLEMPA aim to ensure the conservation of marine mammals including their habitat. Several sources of concern have been identified in relation with the maritime traffic in the area. The threatened St. Lawrence beluga (~1000 individuals) and endangered Northwest Atlantic blue whale (~250 mature individuals) populations do not show any sign of recovery despite 30 years of conservation efforts (Beauchamp et al., 2009; Hammill et al., 2007). It is challenging and perhaps futile to try identifying a sole factor responsible for the stagnation or decrease in whale populations since cumulative impacts apply. Noise, collisions, entanglement in fishing gears, and water pollution are commonly identified as major threats for the St Lawrence whales (Beauchamp et al., 2009; Hammill et al., 2007; Savaria et al., 2003).
Currently, the only speed restricted area within the study region is 25 knots in the SSLMP (no limit elsewhere). However, at 25 knots, any collision would be lethal for a struck whale (Vanderlaan and Taggart, 2007). In the St. Lawrence Estuary, at least 46 collisions (including non-lethal) have been recorded (reports and carcass necropsies) between 1993 and 2009 (Parks Canada, Group for Research and Education on Marine Mammals-GREMM, Réseau québécois d'urgences pour les mammifères marins-RQUMM, unpublished data) with an average of approximately 3 detected collisions a year: Fin whales account for 43% of the collisions, beluga whales for 23%, with 28% for the other rorqual species altogether. Moreover, collision scars have been observed on at least 5% of the individual blue whales observed in the St Lawrence waters (Beauchamp et al., 2009). Since evidence suggest that these data reflect only a fraction of all collision events, mitigation measures are needed to protect whale populations for which the loss of any individual is critical to their recovery (Beauchamp et al., 2009; Kraus et al., 2005) and to prevent healthy populations from becoming impacted critically.
Regarding the St. Lawrence beluga, whereas specialists consider that a major factor explaining the lack of recovery in the population is related to their polluted habitat (16% primary cause of death due to carcinoma vs. 6% for collisions) (Hammill et al., 2007, p. 6), they agree that collisions, boat noise and disturbance are actual threats that must be mitigated (Demers, Bouchard and Beauchamp, 2010). However, several studies have highlighted the need to mitigate whale disturbance by boats in the St. Lawrence (Lesage et al., 1999; Michaud and Giard, 1997; 1998). Other studies on anthropogenic noise within the St. Lawrence led to the identification of zones where whales are subject to high levels of such noise (Simard, Lepage and Gervaise, 2010; Simard, Roy and Gervaise, 2008). Despite the regulations enforced by the SSLMP wardens (Parks Canada, 2002), the high number of whale-watching excursions in the region (Chion et al., 2009; Michaud et al., 1997) and the frequency of their close encounters with belugas are adding to the list of stressors exerted on targeted populations (Beauchamp et al., 2009).
In summary, large ship strikes seem to occur mainly with large whales (rorquals) and to a lesser extent with belugas (possibly due to the difficulty to detect them) in the study area. Detected collisions with belugas have been reported mostly for small commercial fast-moving vessels in areas where they congregate. Marine protected area managers from both Parks Canada Agency and DFO came to the conclusion that, whether or not collisions affect belugas in a major way, the number of co-occurrences should be reduced and boat speed lowered to decrease whale exposure, whatever the species. They expressed some needs regarding the management of navigation activities, detailed thereafter.
0.1.3.4 Management needs
Canadian marine protected areas (MPAs) function under the adaptive management paradigm obliging managers to update their policy according to the most recent scientific advancements and knowledge. Incidentally, SSLMP managers are updating the 2002 regulations on marine activities at sea (Parks Canada, 2002), with the revised version expected in 2012. For their part, SLEMPA managers aim to gain a better understanding of the risk of ship strikes with marine mammals within the proposed MPA, in preparation of their upcoming policymaking agenda.
These management concerns have resulted in the following four explicit needs expressed by the managers of both MPAs:
1) Assess the effects of increased whale-watching boat traffic, particularly expanding the capacity of the Tadoussac marina, at the mouth of the Saguenay.
2) Assess the effects of rerouting maritime shipping vessels to the southern channel (i.e. southeast of Île Rouge) in the St. Lawrence so as to avoid the SSLMP area where rorquals congregate in large numbers to feed.
3) Assess the effects of the proposed zoning plan on traffic in the SSLMP and on the collisions potential between boats and whales.
4) Evaluate the effects of different shipping vessel speed scenarios and changes in maritime traffic lanes on the probability of collisions with whales.
For each of these four questions, several scenarios need to be tested; therefore the tool developed in this project should offer this functionality. Moreover, to assess correctly the performance of alternative management scenarios, some metrics need to be developed to facilitate comparisons. According to the concerns expressed about whale conservation, the exposure of whales to boats in the area must be measurable. Whale exposure to boat is illustrated in Figure 0.3 with the concept of spatiotemporal co-occurrence between a boat and a whale (co-occurrence and encounter will be used interchangeably to refer to this concept). Several variables can be tracked to characterize such interactions in space and time, including the following:
• Type of boat involved in the encounter. • Whale species involved in the encounter.
• Minimal distance between the boat and the whale during the encounter. • Boat speed at the minimal distance during the encounter.
• Duration of the encounter closer than a given distance. • Localization of the encounter.
• Overall risk of whale mortality in case a collision occurs (by species). • Overall number or/and total time of encounters.
Figure 0.3 Illustration of the concept of boat-whale spatiotemporal co-occurrence (or encounter) at a distance d < dref , with dref a reference distance fixed for a given analysis.
Therefore, the development of a spatially-explicit simulator of boat and whale movements and interactions has been proposed to address the needs expressed by MPA managers. The present thesis is part of this modelling endeavour.
0.2 Thesis goal
SESs can be modelled using the agent-based modelling (ABM) technique (Bonabeau, 2002; Janssen and Ostrom, 2006b; Parrott, 2008). A prototype of whale-watching activities in the SSLMP was developed using this approach prior to the current project (Anwar et al., 2007). This prototype was a proof of concept addressing the issue of cooperative vs non-cooperative behaviour of whale-watching captains with related impacts on whales. The prototype was not
based on behavioural data either for whales or for captains, nor was it validated: hence, it could not be used to address the above-mentioned management needs.
Incidentally, the ultimate purpose of this thesis project is to implement a spatially explicit agent-based model (ABM) of the critical maritime traffic components coupled with an individual-based model (IBM) of the St. Lawrence whales (Lamontagne, 2009), suitable to support MPA managers by shedding light on the four aforementioned issues (section 0.1.3.4). The larger project of which this work is a part is named the Marine Mammals and Maritime Traffic Simulator (3MTSim) project, described in CHAPTER 1.
The development of any simulation model (such as an ABM) of a real system dedicated to a real-life application is much more than programming (Sargent, 2005). It requires acquiring an in-depth understanding of the system to be modelled as illustrated by the modelling process in Figure 0.4.
Figure 0.4 Overview of the modelling process. Reproduced from Sargent (2005)
The development of the ABM of boat movements presented thereafter followed the process presented in Figure 0.4 (Sargent, 2005). Valid data lie at the center of the modelling process.
Analyses of valid data about the system to model (i.e. the 3MT-SES) lead to the development of a conceptual model that must be valid (i.e. relying on reasonable theories and assumptions). Then, the model can be implemented from the conceptual model according to a set of specifications. Model verification must lead to the correspondence between the conceptual model and the effective computerized model. Finally, the operational validity related to the modelling purpose is checked through analyses made on the simulation results. An overview of the problematic and methodology associated with these different steps is presented thereafter with an in-depth discussion in section 1.3 (in CHAPTER 1).
0.3 ABM problematic and methodology
Several challenges underlie the building process of an ABM dedicated to the management of a SES. These challenges belong to one of the following three broad categories:
1) Build a valid model.
2) Ensure model acceptance and trust by the future end-users. 3) Technology transfer.
Each of these issues must be dealt with appropriately to give the model/simulator the opportunity to be used for management purposes. Conversely, a failure to tackle one of them may jeopardize the final application of the model. A description of general objectives and methodology to follow in order to tackle these issues is presented in Table 0.1. The specific challenges and the methodology followed to build the 3MTSim’s boat model are discussed later on in section 1.3 (CHAPTER 1).
Table 0.1 Overview of the objective and methodology relative to the building process of a model useful for management
Problematic Objectives (challenges) Methodology
Building a valid model
UNDERSTAND THE SYSTEM • Identify key people and
institutions.
• Gather existing knowledge about the studied system. • Gather existing and available
data.
• Conduct appropriate analyses. • Identify missing data, plan
field campaigns complying with ethical rules, and extract needed knowledge.
1) Gain an in-depth understanding of the system’s dynamics. 2) Elicit major interactions
between system’s entities, driving the dynamics. 3) Identify important factors
affecting the system’s dynamics.
IMPLEMENT THE MODEL • Ensure that the level of
complexity induced by the conceptual model is
manageable (appropriate level of abstraction).
• Identify patterns of the system’s dynamics through data analysis.
1) Build a valid conceptual model Acquire modelling skills. 2) Represent adequately human
decision making in the model. 3) Use an appropriate validation
framework.
Ensuring model acceptance by the future
end-users
1) Work in collaboration to develop a common
understanding of the system’s dynamics.
2) Stimulate end-users’ active participation in modelling decisions (including interface). 3) Ensure that end-users’ needs are
well understood and accounted for.
• Communication and agreement of the concepts underlying the model (through regular meetings).
• Communication and
transparency about model’s limitations.
• Avoid modelling’s technical details and jargon.
• Share a common vocabulary.
Technology transfer
DELIVER A USABLE SOFTWARE • Favour a cross-platform
programming language (e.g. Java, Lisp).
• Clean all unnecessary details from the model’s interface. • Use a versioning system to facilitate the management of model updates.
• Organize training sessions with end-users.
1) Design a user-friendly and ergonomic model interface. 2) Ensure cross-platform
compatibility on basic operating systems.
3) Build easily runnable installers. 4) Maintenance and debugging.
Some of the challenges presented in Table 0.1 must be tackled simultaneously during the whole process. The first objective is to build a valid model able to address managers’ needs. As previously discussed, data play a prominent role in the modelling process (cf. Figure 0.4). Collaborations for data sharing may take a while to be effective and should not be taken for granted until an agreement has been reached. Most of time, available data have not been collected for modelling purposes. Moreover, there could be some issues never investigated so far but crucial to address the management needs. Consequently, additional data may have to be collected in the field to meet this need. Once a fairly good understanding of the target system has been gained via data analyses, a conceptual model can be built followed by the programming phase.
The best model could be useless if managers do not feel comfortable with the idea of using it. This highlights the importance of information sharing with end-users during regular meetings. The degree of end-users’ involvement in the modelling process will have an impact on their willingness to use it.
Finally, if the model is to be hosted on the end-users’ systems, attention should be paid to technology transfer early in the process. Some software-related aspects such as the compatibility with various operating systems, visualization aesthetics, and a user-friendly and ergonomic interface could be necessary.
0.4 Outline
The 3MTSim simulator has been jointly developed by Philippe Lamontagne (whale model) (Lamontagne, 2009) and the author, Clément Chion, (boat model) with the contribution of several professors and students from École de techonologie supérieure (Montréal), Université de Montréal, University of Calgary, and non-academic partners: An updated list of contributors can be found in (Parrott, 2010). This manuscript-based thesis dissertation presents the key steps leading to the implementation of the 3MTSim’s boat model as part of the 3MTSim project, fully described in CHAPTER 1. This dissertation is organized as