UNIVERSITÉ DU QUÉBEC
DISSERTATION PRESENTED TO ÉCOLE DE TECHNOLOGIE SUPÉRIEURE
IN PARTIAL FULFILLMENT OF THE REQUIREMENTS FOR A MASTER’S DEGREE IN MECHANICAL ENGINEERING
M.Eng.
BY
César Augusto Corrêa ALBA
IMAGE ACQUISITION AND PROCESSING IN AN ATTEMPT TO AUTOMATE THE FLUORESCENT PENETRANT INSPECTION
MONTREAL, MAY 6 2011 c
THIS THESIS HAS BEEN EVALUATED BY THE FOLLOWING BOARD OF EXAMINERS:
Mr. Martin Viens, Thesis Supervisor
Departement de génie mécanique à l’École de technologie supérieure
Mr. Jean-Luc Fihey, President of the Board of Examiners
Departement de génie mécanique à l’École de technologie supérieure
Mr. Xavier Maldague, External Examiner
Departement de génie électrique et de génie informatique à l’Université Laval
THIS THESIS WAS PRESENTED AND DEFENDED BEFORE A BOARD OF EXAMINERS AND PUBLIC
ON JUNE 15, 2011
I would like to express my gratitude to many people who have provided assistance and inspira-tion during my master study. First of all, I am very grateful to my supervisor, Dr. Martin Viens. His contribution to my project has been essential for achieving my research goals. I would like to thank as well Dr. Xiao-Wei Tu. He has been always prompt to provide me immediate as-sistance. I would like to acknowledge all other members of the project CRIAQ MANU418. These people have been adding significant contribution to my research.
It is a pleasure to thank the members of my examining committee: Dr. Jean-Luc Fihey and Dr. Xavier Maldague, who have kindly agreed in reading, analyzing this dissertation.
Many thanks also to my friends in the LIVIA (Laboratoire d’imagerie, de vision et d’intelligence artificielle) who have helped me providing an initial guidance in my master studies. I am very grateful to Dominique Rivard, Eduardo Vellasques, Éric Thibodeau, George Eskander, Jean-François Connoly, Jonathan Bouchard, Idrissa Coulibaly, Luana Batista, Marcelo Kapp, Paulo Cavalin, Philippe LaMontagne, Vincent Doré, and Wael Khreich. Special thanks to Dr. Robert Sabourin and Dr. Éric Granger. Their ideals have had a notorious influence on this work. I would like to acknowledge my friends in the LIPPS (Laboratoire d’ingénierie, des produits, procédés et systèmes). Abbasali Saboktakin and Louis-Alexandre Généreaux became great friends during my graduate study.
I would like to express my thankfulness to all members of AIESEC located worldwide (es-pecially in Canada and in Brazil) who have helped to adapt to this country. People from this organization have become very good friends since my arrival in Montreal.
I would like to give thanks to César Gemelli, Danielle Van der Kay, Diego Mattos, Douglas Moreira, Eduardo França, Francesca Capitanio, Francisco Fincheira, Gustavo Spanholi, Jean-Maxime Lemerise, Jennifer Vachon, Juliana Davi, Lisiane Saraiva, Louis Phillip Choquette, Luís Vitório Cargnini, Marie-Catherine Dremers, Marie-Hélène Le Rossignol, Maryse Rabeau,
Brisebois. I definitely would not have completed this project without their contribution. They have provided all necessary equipment for conducting my research, giving advices as needed. I manifest my gratefullness to M.Sc. Christian Belleau, Dr. Éric David, Dr. Véronique François, Chantal Gamache and Nicole Brasseur. They have never hesitated to give assistance. I am pleased to acknowledge Dr. Berenice Dedavid and Dr. João Carlos Beck. They have been encouraging me to pursue the graduate studies. Since my bachelor degree in Engineering, they have had a valuable influence on my career.
I would like to demonstrate my infinite gratitude to my parents, Plínio and Raquel. They have been always encouraging and inspiring me with their hardwork and love. Thanks to my sisters, grandparents, godmother, godfather, niece and other relatives who have been loving me. I dedicate this work to all of them.
Furthermore, I am glad to thank the École de Technologie Supérieure for supporting me finan-cially. This assistance has been important for the conclusion of this work.
Last, I express all my thankfulness to God for giving me endless motivation, providing me energy to work hard during these three years. You surely have been generous, giving me plenty of opportunities.
L’AUTOMATISATION DU RESSUAGE César Augusto Corrêa ALBA
RÉSUMÉ
Une défaillance mécanique dans les pièces d’aéronefs est susceptible de se produire s’il y a des discontinuités de surface qui comprennent des régions de concentration de contraintes. Le ressuage (FPI) est une méthode de contrôle non destructif (NDE), sensible qui permet de vérifier la présence des indications dans la surface des matières premières ou des pièces soumises à des efforts de service.
En général, une fois que l’inspection FPI est en cours, l’inspecteur effectue l’évaluation d’une surface traitée en fonction de ses connaissances et de son expérience en contrôle non destructif, la détection des défauts étant une décision qualitative selon jugement de l’inspecteur. Dans ce cas, l’acuité de sa vision, son attitude et sa motivation peuvent compromettre l’analyse en matière d’inspection. L’automatisation de l’inspection peut améliorer la reproductibilité de cette méthode NDE, en ce qui concerne le classement des pièces par le système de vision industrielle, compte tenu de l’analyse quantitative des données objectives. Les algorithmes d’extraction des caractéristiques sont exécutés pour offrir des donnés à une procédure d’analyse de données qui classifie les indications détectées comme des indications pertinentes ou non, selon les spécifications ou le code. Par conséquent, les systèmes de vision par ordinateur, lorsqu’ils sont appliqués au ressuage, améliorent la fiabilité technique globale, garantissent le stockage automatique des données, la récupération et le retour des informations de contrôle de la fabrication et de la maintenance des équipements.
Dans la littérature, il existe plusieurs exemples de systèmes de vision industrielle: Par exem-ple, le système de balayage laser, tel que proposé dans Tracy et Moore (2001), est une bonne approche pour l’automatisation et l’inspection. Dans ce système, un spot laser focalisé est dé-placé sur la surface de l’échantillon et un photodétecteur mesure la quantité de fluorescence dans la zone éclairée, dont la puissance est directement proportionnelle à la quantité de péné-trant piégé dans des cavités de surface (Tracy et Moore (2001)). Une autre approche, proposée par Armstrong (1986), est d’éclairer un échantillon traité avec une lampe UV standard dans une cabine sombre et d’obtenir des images formées par indications fluorescentes à l’aide d’une caméra.
Dans ce travail, un système ultraviolet de détection d’indications a été développé pour au-tomatiser l’inspection en FPI. Seules les indications de surface peuvent être détectées par le système. Il mesure la distance euclidienne maximum, mesure l’aire de surface et classifie la forme des indications. Ces caractéristiques peuvent être évaluées selon les normes de qualité prédéfinies. Les courbes de probabilité de détection ont été tracées et ont montré leur capacité de 21.6 microns de profondeur avec 100% de fiabilité.
THE FLUORESCENT PENETRANT INSPECTION César Augusto Corrêa ALBA
ABSTRACT
Mechanical failure in aircraft workpieces is likely from happening, if open to surface discon-tinuities which comprise stress concentration regions are present. The fluorescent penetrant inspection (FPI) is a sensitive nondestructive evaluation (NDE) method capable to verify the presence of indications in surface of raw materials or of processed parts or parts submitted to service charges.
In general, when FPI inspection is being conducted, an inspector performs an evaluation of a treated surface based on his knowledge and experience in nondestructive testing, being the de-fect detection a qualitative decision according to his/her judgment. In this case, the inspector’s vision acuity, attitude and motivation can compromise the analysis in inspection. The automa-tion in inspecautoma-tion may improve the repeatability of this NDE method, regarding that machine vision systems classify parts considering quantitative analysis of objective data. Algorithms for the feature extraction are run, providing features for a data analysis procedure which classifies the detected indications as relevant or irrelevant indications according to specification or code. Therefore, the machine vision systems, when applied to fluorescent penetrant inspection, im-prove the overall technique reliability, guaranteeing automatic storage, retrieval and feedback of data for controlling the manufacturing and maintenance of equipments.
In the literature, there are several examples of machine vision systems: For example, the laser scanning systems, as proposed in Tracy and Moore (2001), is a good approach for the inspec-tion automainspec-tion. In this system, a focused laser beam spot is translated over the specimen sur-face and a photodetector measures the amount of fluorescence in that illuminated area whose power is directly proportional to the quantity of penetrant trapped in surface cavities (Tracy and Moore (2001)). Other manner which was proposed by Armstrong (1986) is to illumi-nate a treated sample with a standard UV lamp in dark booth and acquire images formed by fluorescent bright indications using a camera.
In this work, an ultraviolet indication detection system was developed for the automation of the inspection stage in FPI. Only open to surface indications are capable to be detected through the system. It measures the area and maximum euclidean distance and classifies the shape of indications. They are feasible to be evaluated according to predefined quality standards. Metrics such as the probability of detection curves were traced, obtaining a capability of 21.6 microns of depth with 100% of reliability.
Page
INTRODUCTION . . . 1
CHAPTER 1 MANUFACTURING METHODS, DISCONTINUITIES AND SERVICE DEGRADATION . . . 7
1.1 Casting . . . 9
1.2 Forming (plastic deformation shaping) . . . 13
1.3 Machining . . . 16
1.4 Welding and Thermal Processing . . . 19
1.5 Service Degradation of Mechanical Parts . . . 24
1.6 Summary . . . 24
CHAPTER 2 METHODS OF NONDESTRUCTIVE EVALUATION . . . 27
2.1 Nondestructive Testing in Aircraft Fleet Maintenance . . . 28
2.2 Liquid Penetrant Testing (PT) . . . 29
2.3 Magnetic Particle Inspection (MT) . . . 30
2.4 Eddy Current Testing (ET) . . . 32
2.5 Ultrasound (UT) . . . 34
2.6 Radiography (RT). . . 35
2.7 Summary . . . 36
CHAPTER 3 THE STATE OF THE ART IN LIQUID PENETRANT INSPECTION . 39 3.1 Physical Phenomena related to PT . . . 42
3.2 Pre-Cleaning and Effectiveness of the PT testing . . . 44
3.3 Penetrant types and application modes . . . 45
3.4 Dwell Time and Modes . . . 48
3.5 Excess Penetrant Removal and Inspection Sensitivity . . . 49
3.6 Developers . . . 51
3.7 Mechanism of Fluorescence in Penetrants. . . 52
3.8 Inspection and Evaluation . . . 53
3.9 Comparators and Reference Panels . . . 54
3.10 The Capability and Reliability in PT inspection . . . 56
3.11 Fluorescent Penetrant Inspection in Aerospace . . . 57
3.12 Safety Concerns. . . 59
3.13 Summary . . . 60
CHAPTER 4 FLUORESCENT PENETRANT INSPECTION - INSPECTION SYS-TEM CONFIGURATIONS - AUTOMATION FEASIBILITY. . . 63
5.3 Image Segmentation Based on Edge Detection . . . 77
5.4 Image Segmentation Based on Thresholding . . . 79
5.5 Feature Extraction . . . 80
5.6 Summary . . . 82
CHAPTER 6 EXPERIMENTAL PROTOCOL . . . 85
6.1 Indication Detection System (IDS) . . . 86
6.1.1 Software of Image Acquisition, Image Filtering and Detection of Indi-cations . . . 86
6.2 Sample Description for setting the parametersα and C and plotting POD curves 89 6.3 Sample Description for the Measurement of Area, Maximum Euclidean Dis-tance and Shape Classification of Indications . . . 89
6.4 Sample Preparation . . . 90
6.5 Experiment I - Selection of the most suitable angleα and distance C in image acquisition . . . 93
6.6 Experiment II - Probability of Detection Curves Plot . . . 94
6.7 Experiment III - Measurement of Area, Maximum Euclidean Distance and Shape Classification Experiments . . . 95
6.8 Summary . . . 95
CHAPTER 7 RESULTS, ANALYSIS AND DISCUSSION . . . 97
7.1 Analysis of the influence of the illumination angle in image acquisition . . . 98
7.2 Analysis of the influence of the distance C in image acquisition . . . 100
7.3 Probability of Detection Curves of the Detection System . . . 103
7.4 Measurement of Maximum Euclidean Distance, Area and Classifying Shapes of Indications. . . 111
7.5 Discussion . . . 114
CONCLUSION . . . 119
Page
Table 1.1 Summary of the main defects which can be detected through PT . . . 25 Table 2.1 Summary of PT, MT, ET, UT and RT technique descriptions . . . 37 Table 2.2 Advantages and disadvantages of PT, MT, ET, UT and RT techniques . . . . 38 Table 6.1 Summary of the proposed experiments . . . 96 Table 7.1 Probabilities of detection obtained with each inspected panel with
the threshold set to 70 . . . .107 Table 7.2 Probabilities of detection obtained with each inspected panel with
the threshold set to 150 . . . .108 Table 7.3 Probabilities of detection obtained with each inspected panel with
the threshold set to 200 . . . .109 Table 7.4 Shape Classification Table. L and R stand for linear and rounded
respectively. The classifications (a),...,(e) are related to the
images (a),...,(e) in figures 7.31 and 7.32 . . . .114 Table 7.5 Area in mm2 obtained with the threshold set to 70. The
abbreviations Avg., Disc., S.D. and P.U. stand for respectively Average, Discontinuity, Standard Deviation and Precision Uncertainty calculated with 90% of level of confidence. The measurements (a), (b),...,(e) are related to the images (a),
(b),...,(e) in figures 7.31 and 7.32 . . . .115 Table 7.6 Maximum euclidean length in mm obtained with the threshold
set to 70. The abbreviations Avg., Disc., S.D. and P.U. stand for respectively Average, Discontinuity, Standard Deviation and Precision Uncertainty calculated with 90% of level of confidence. The measurements (a),...,(e) are related to the images (a),...,(e) in
Page
Figure 1.1 Typical case of part failure due to crack propagation. A crack formed on the top of the surface propagated slowly and a rapid
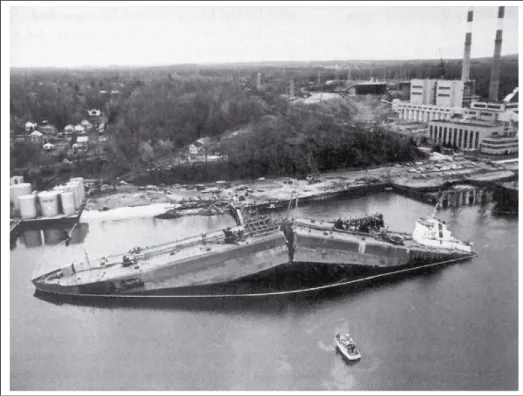
fracture happened. Reproduced from the book Callister Jr (2007) . . . 9 Figure 1.2 Oil tanker which suffered a fracture due to crack propagation.
Reproduced from Callister Jr (2007). . . 10 Figure 1.3 Forged alloy 7075-T6 part which contains shrinkage cavities and
internal cracks formed during the solidification during the casting.
Reproduced from American Society for Materials (2002b) . . . 10 Figure 1.4 Example of gating systems typically used in casting molds.
Reproduced from American Society for Nondestructive Testing (1981). . . 11 Figure 1.5 Casting mold containing risers for controlling shrinkage.
Reproduced from American Society for Nondestructive Testing (1981). . . 11 Figure 1.6 Casting mold containing a core which is supported by chaplets.
Reproduced from American Society for Nondestructive Testing (1981). . . 12 Figure 1.7 Sketch demonstrating the shrinking cavity, bridging and piping
which can occur under inappropriate solidification conditions.
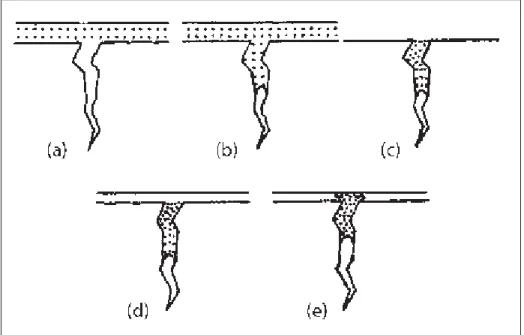
Reproduced from American Society for Materials (2002b) . . . 13 Figure 1.8 In (a), there is a representation of lack of fusion in a casting; in (b),
of cold shut; in (c), of cold shot; in (d), of hot tears and in (e), of
blowholes. Reproduced from American Society for Materials (2002b) . . . 13 Figure 1.9 The most common forming tasks. In (a), forging; in (b), rolling; in
(c), extruding; and in (d), drawing. Reproduced from Callister Jr (2007) . . . 15 Figure 1.10 This picture depicts the rolling operation. The hatched volume
illustrated on the left of the figure is flattened to the volume on
the right. Reproduced from American Society for Materials (2010a). . . 15 Figure 1.11 This picture depicts the extrusion process. The hot billet is inserted
into a container and it is pressed by a ram against a die opening.
Figure 1.14 This sketch depicts the milling in the fabrication of a part.
Reproduced from American Society for Materials (2002a) . . . 18 Figure 1.15 This schematics illustrates a radial drilling machine with the
compounds. Reproduced from American Society for Materials (2002a) . . . . 18 Figure 1.16 These figures illustrates the broaching. In (a), the broach is
removing material internally; in (b), the broaching is executed on an external surface. Reproduced from American Society for
Materials (2002a) . . . 19 Figure 1.17 This figure represents the heat-affected zone. Reproduced from
Callister Jr (2007) . . . 20 Figure 1.18 Weld joint most important features. The letter A represents the leg;
B, the face; C, the root; D, the toe; E, the throat; F, the penetration; G, the face reinforcement; H, the root reinforcement; I, the size of
weld. Reproduced from American Society for Materials (2002c) . . . 21 Figure 1.19 Lack of fusion in a single-V-groove and double-V-groove weld
joints and lack of penetration in a single-V-groove and double-V-groove weld joints are represented in (a), (b), (c) and (d)
respectively. Reproduced from American Society for Materials (2002b) . . . . 21 Figure 1.20 In a fillet weld, undercut and overlap are represented in (a). In (b),
undercut and overlap are depicted in a groove weld. In (c) and (d), there is an illustration of underfill in groove welds. Reproduced
from American Society for Materials (2002b) . . . 22 Figure 1.21 Crack types which may be found in a weld joint. 1) is a crater crack
in weld metal; 2), transverse crack in weld metal; 3) transverse crack in HAZ; 4) longitudinal crack in weld metal; 5) toe crack in base metal; 6) underbead crack in base metal; 7) fusion-line crack; 8) root crack in weld metal; 9, hat cracks in weld metal.
Reproduced from American Society for Materials (2002b) . . . 23 Figure 2.1 Hysteresis cycle. In the state (a), the saturation condition of B is
Figure 2.2 ET inspection equivalent system. The circuit on the left is the "circuit 1"; the circuit on the right, the "circuit 2". Reproduced
from NDT Resource Center (2010) . . . 33 Figure 2.3 ET probe executing the inspection in a conductive material.
Reproduced from NDT Resource Center (2010) . . . 33 Figure 2.4 Workpiece inspected through ultrasound technique. Once the part
contains a discontinuity, the corresponding echo is detected by the
transducer. Reproduced from NDT Resource Center (2010) . . . 35 Figure 2.5 Radiography testing. Radiation reaches a surface containing a
discontinuity. Variations in radiation absorption are registered on a
radiographic film. Reproduced from Bray and Stanley (1997) . . . 36 Figure 3.1 Liquid Penetrant Inspection Steps. In (a), the penetrant is
applied in a clean surface; in (b), the penetrant is drawn into a discontinuity; in (c), the penetrant excess is removed from the surface; in (d), the developer application to the surface; in (e), the surface is ready for interpretation and detection of discontinuities.
Reproduced from Shull (2002) . . . 40 Figure 3.2 Interface among liquid, solid and gas. Ad is the attractive force
from the fluid to the solid; θ is the contact angle; γgl, γls, γsg are
respectively the surface tension between gas and liquid, liquid and
gas and solid and gas. Reproduced from Shull (2002) . . . 43 Figure 3.3 Capillary action of a fluid in a container. In (a) the fluid rises a
distance h in the container forming a meniscus; in (b), it falls into
the container a distance h. Reproduced from Shull (2002) . . . 44 Figure 3.4 Three surface crack microscope photographies with diverse
magnification. The crack opening is closed by the metallic residual
particles. Reproduced from NDT Resource Center (2010) . . . 46 Figure 3.5 Inspection under UV light in a treated surface. Reproduced from
NDT Resource Center (2010) . . . 47 Figure 3.6 Indication formed using type II penetrant. Reproduced from NDT
Resource Center (2010) . . . 48 Figure 3.7 Example of liquid penetrant chemicals application. In (a), there is
a picture of liquid penetrant application in a dip tank. The parts contained in the basket are immersed in it; in (b), the dry powder
Figure 3.9 Draining station picture. Part of penetrant excess is drawn back to the penetrant application dip tank. This guarantees less penetrant waste, once part of the excess removed is reused. Reproduced from
NDT Resource Center (2010) . . . 51 Figure 3.10 Schematics representing often detected indication patterns. In
(a), an opening which may be a surface crack; in (b), a thin indication which may represent a tight open to surface crack or a surface cold shut; in (c), there is a partially welded lap; in (d), the indications rounded in the shape of bubble may be porosities or
pits. Reproduced from Tracy and Moore (2001) . . . 54 Figure 3.11 In (a), there is a schematics of twin NiCr tapered test panel; in
(b), the effect of two different penetrant is evaluated with the twin
panels. Reproduced from Shull (2002) . . . 55 Figure 3.12 In (a), twin known defect test panels with 5 star-shaped cracks
each; in (b), there are two pictures of the PT patterns of two cracks
contained in the panels of (a). Reproduced from Shull (2002) . . . 56 Figure 3.13 Example of Probability of Detection (%) X Actual crack length
(mm(in.)) curve whose detection threshold was set 3.5 millimeters
(0.14 inches) of crack length. Reproduced from Tracy and Moore (2001) . . 57 Figure 3.14 This schematics represents a typical aircraft wing structure made of
aluminium honeycomb core and graphite epoxy skin. Reproduced
from Tracy and Moore (2001) . . . 58 Figure 4.1 Magnaflux portable kit for the fluorescent penetrant inspection.
The kit contains all required chemicals for the FPI, UV lamp and
an instructions manual. Reproduced from McMaster et al. (1982) . . . 65 Figure 4.2 Stationary non automated fluorescent penetrant inspection system
configuration widely used in non mechanized industry. In 1, there is a representation of a dip tank for the penetrant application; in 2, a drain pan is used for draining the excess of liquid penetrant allowing the desired dwell time (drain dwell mode); in 3, there is a rinse tank for excess penetrant removal; in 4, there is a drier; in 5, there is a small station for the developer application and in 6, there
is an inspection booth with black light lamp. Reproduced from
McMaster et al. (1982) . . . 66 Figure 4.3 Automatic washing machine that can be used for pre-cleaning and
post-cleaning processes. Reproduced from McMaster et al. (1982) . . . 67 Figure 4.4 Picture of an automatic electrostatic spray gun system controlled
by a computer processor. This automated system guarantees the repeatability required for the inspection of high safety workpieces.
Reproduced from McMaster et al. (1982) . . . 68 Figure 4.5 Laser-scanning system. The laser spot is translated over the surface
aided by a scanning mirror. A light-collecting mirror transmits fluorescent indications to a photocell. The signal captured by the photocell is conditioned by an amplifier and threshold gate.
Reproduced from Tracy and Moore (2001). . . 71 Figure 4.6 Laser-scanning system developed by General Electric. The
rotation of the scanning mirror translates the focused spot over the
treated surface. Reproduced from Burkel (1990) . . . 72 Figure 5.1 This schematics depicts the effect of the digitization. In (a), there
is an example of workpiece with defects indicated in black. In (b), the pixels in the image are indicated by the red lines. In (c), the fluorescent green regions illustrate where defects are illuminated and trapped by liquid penetrant and developer. In (d), the digitized
intensity per pixel obtained during image acquisition . . . 75 Figure 5.2 Examples of smoothing masks. In (a), there is a nonweighted
averaging mask; in (b), there is a weighted averaging mask.
Reproduced from Gonzalez and Woods (2008) . . . 76 Figure 5.3 Masks which are convolved with images for obtaining horizontal
gradients. In (a), Prewitt operator mask; and in (b), Sobel operator
mask. Reproduced from Gonzalez and Woods (2008) . . . 77 Figure 5.4 Masks which are convolved with images for obtaining vertical
gradients. In (a), Prewitt operator mask; and in (b), Sobel operator
mask. Reproduced from Gonzalez and Woods (2008) . . . 77 Figure 5.5 Edge profiles representation. In (a), there is a representation of
a step edge; in (b), of a ramp edge; and in (c), of roof edge.
Figure 5.7 This figure depicts the effect of the segmentation threshold setup. The same sample sketched in figure 5.1 was considered for this analysis. The squares in fluorescent green illustrate the segmented pixels according to the set segmentation threshold. In (a), (b) and
(c), it was respectively adjusted to 100, 200 and 253.. . . 80 Figure 5.8 Boundary extraction algorithm example. In (a), there is an example
of an image which indicates the classes of the pixels. The pixels in blank belong to class 0; the others, to class 1. In (b), with the starting point b0, from c0, in clockwise direction, the first b0’s neighbour which belong to class 1 is searched; in (c), after
assigning c= c1 and b= b1, from c, in clockwise direction, the
first b’s neighbour which belongs to class 1 is searched; in (d), the subsequent search for b’s neighbours; and in (e), the detected boundary is colored in gray. Reproduced from Gonzalez and
Woods (2008) . . . 81 Figure 6.1 This figure illustrates the proposed system for conducting
experiments for this work. The distance C and the angle α are the parameters which have been selected through the experiments
described in section 6.5. The distance A has been set to 179mm . . . 87 Figure 6.2 Radiography of Coarse Test Panel containing open to surface
cracks used to trace a POD curve. . . 90 Figure 6.3 Radiography of the Medium Test Panel containing open to surface
cracks used to trace a POD curve. . . 91 Figure 6.4 Radiography of Fine Test Panel containing open to surface cracks
used to trace a POD curve. . . 92 Figure 7.1 Image of the coarse sensitivity test panel that has been acquired
through IDS. The angle α and C have been set to 75◦and 30
centimeters respectively. . . 98 Figure 7.2 Image of the coarse sensitivity test panel that has been acquired
through IDS. The angle α and C have been set to 45◦and 30
Figure 7.3 Image of the coarse sensitivity test panel that has been acquired through IDS. The angle α and C have been set to 25◦and 30
centimeters respectively. . . 99 Figure 7.4 Image of the coarse sensitivity test panel that has been acquired
through IDS. The angle α and C have been set to 10◦and 30
centimeters respectively. . . .100 Figure 7.5 Image of the fine sensitivity test panel that has been acquired
through IDS. The angle α and C have been set to 25◦and 30
centimeters respectively. . . .100 Figure 7.6 Image of the fine sensitivity test panel that has been acquired
through IDS. The angle α and C have been set to 10◦and 30
centimeters respectively. . . .101 Figure 7.7 Image of the fine sensitivity test panel that has been acquired
through IDS. The angle α and C have been set to 65◦and 30
centimeters respectively. . . .101 Figure 7.8 Image of the fine sensitivity test panel that has been acquired
through IDS. The angle α and C have been set to 45◦and 30
centimeters respectively. . . .102 Figure 7.9 Image of the medium sensitivity test panel that has been acquired
through IDS. The angle α and C have been set to 25◦and 30
centimeters respectively. . . .102 Figure 7.10 Image of the medium sensitivity test panel that has been acquired
through IDS. The angle α and C have been set to 75◦and 30
centimeters respectively. . . .103 Figure 7.11 Image of the coarse sensitivity test panel that has been acquired
through IDS. The angle α and C have been set to 45◦and 10
centimeters respectively. . . .103 Figure 7.12 Image of the coarse sensitivity test panel that have been acquired
through IDS. The angle α and C have been set to 45◦and 40
centimeters respectively. . . .104 Figure 7.13 Image of the coarse sensitivity test panel that has been acquired
through IDS. The angle α and C have been set to 45◦and 50
α
centimeters respectively. . . .105 Figure 7.16 Image of the fine sensitivity test panel that has been acquired
through IDS. The angle α and C have been set to 45◦and 40
centimeters respectively. . . .106 Figure 7.17 Image of the fine sensitivity test panel that has been acquired
through IDS. The angle α and C have been set to 45◦and 50
centimeters respectively. . . .106 Figure 7.18 Image of the fine sensitivity test panel that has been acquired
through IDS. The angle α and C has been set to 45◦and 10
centimeters respectively. . . .107 Figure 7.19 Image that illustrates the effect of the convolution of a weighted
averaging mask to the image in figure 7.12. . . .107 Figure 7.20 Image that illustrates the effect of the convolution of a weighted
averaging mask to the image in figure 7.15. . . .108 Figure 7.21 Image that illustrates the effect of the convolution of a weighted
averaging mask to the image in figure 7.16. . . .108 Figure 7.22 Histogram that has been traced based on the filtered image
demonstrated figure 7.19 . . . .109 Figure 7.23 Histogram that has been traced based on the filtered image
demonstrated in figure 7.20 . . . .109 Figure 7.24 Histogram that has been traced based on the filtered image
demonstrated in figure 7.21 . . . .110 Figure 7.25 Magnified histogram that has been traced based on the filtered
image in figure 7.19. . . .110 Figure 7.26 Magnified histogram that has been traced based on the filtered
image in figure 7.20. . . .111 Figure 7.27 Magnified histogram that has been traced based on the filtered
Figure 7.28 Probability of detection curve obtained with the threshold set to 70 . . . .112 Figure 7.29 Probability of detection curve obtained with the threshold set to 150. . . .112 Figure 7.30 Probability of detection curve obtained with the threshold set to 200. . . .112 Figure 7.31 Images of the samples described in section 6.3 that have been
acquired through IDS . . . .113 Figure 7.32 Images that have been obtained after running the Procedures II and
AC Alternating Current
ASM American Society for Materials
ASNT American Society for Nondestructive Testing
Avg Average
CC Continuous Current
CCD Charge-Coupled Device
CGSB Canadian General Standards Board
CINDE Canadian Institute of Nondestructive Evaluation
Disc. Discontinuity
ET Eddy Current Testing
FPI Fluorescent Penetrant Inspection
HAZ Heat Affected Zone
IDS Indication Detection System ISP Indication Starting Point
L Linear Indication
LIPPS Laboratoire d’Ingénierie des Produits, Procédés et Systèmes LIVIA Laboratoire d’Imagerie, de Vision et Intelligence Artificielle
LOF Lack of Fusion
NDI Nondestructive Inspection NDT Nondestructive Testing
NRCan Department of Natural Resources Canada
OW Oil and Whiting Method
POD Probability of Detection PSM Penetrant System Monitor
PT Liquid Penetrant Testing
PU Precision Uncertainty
R Rounded Indication
ROI Region of Interest
SD Standard Deviation
UT Ultrasound Testing
UV Ultraviolet
A Distance between the camera focusing lens and specimen
Ad Adhesive Force
α Illumination Angle
B Magnetic Flux Density
C Distance between the UV lamp and the specimen
φ Magnetic Flux
g Acceleration of gravity
γab Surface tension among a and b interface
H Magnetic Force h Meniscus height L Self Inductance M Mutual Inductance μ Magnetic permeability r Meniscus radius
r(x,y) Gradient magnitude at(x,y)
ρ Liquid density
SP Set containing the indication starting points
θ Contact angle or wetting ability
From 1930 to 1940, the techniques called nondestructive testing, due to the development of aerospace industries, became notorious as an important tool for the quality control. The cost in production and maintenance of aircrafts, if evaluated in terms of requirements for ensuring the safe service started to have a lesser importance at that time (Betz (1963)).
In 1920, the radiography was the only NDT employed for the verification of soundness in workpieces. It became an excellent method for the evaluation of internal discontinuities. In a casting, forging and machined parts, fine surface cracks, seams were not detected at that time with this technique (Betz (1963)). Around 1930’s the magnetic particle was introduced in the market with the trade name Magnaflux and immediately became important for the analysis of surface discontinuities in ferromagnetic workpieces. However, due to the increasing number of parts made of nonmagnetic materials, the necessity for the development of a cost-effective, instantaneous analysis, portable and easy NDT technique for ensuring the integrity of surfaces became obvious (Betz (1963)).
Before liquid penetrant, several etching methods were applied for the analysis of nonmagnetic surfaces. The inspected workpiece was often damaged by the application of acid and alkali so-lutions and only large size discontinuities were successfully detected through it (Betz (1963)). The oil and whiting method (OW) was the actual forerunner of the current liquid penetrant inspection (Betz (1963)). The main purpose of OW was to detect open to surface cracks using penetrating elements (Betz (1963)). The penetrant was a high density lubricating oil whose trade name was "600 W" (Betz (1963)). This chemical fluid was thinned with kerosene or any other low-density oil resulting into a dark light solution (Betz (1963)). The developer was a mixture containing white chalk and denaturated alcohol (Betz (1963)). Even though the tech-nique allowed significant progress, the lack of control related to the amount and concentration of involved materials, cleaning and excess removal leaded to bad performances in detection of shallow and thin cracks (Betz (1963)). The brightness ratio between the penetrant and whiting mixture often did not offer good contrast for perfect seeability of indications (Betz (1963)).
of fluorescent and color-contrast penetrant methods for detecting indications in solid materials (Betz (1963)). In February 1942, under his approval, Magnaflux obtained full rights of the Switzer Brothers patent. Together, Magnaflux Corporation staff including Greer Ellis Taber de Forest, F. Catlin and R. Ward with the Switzer Brothers made significant improvements to the research regulated in the patent. In July 1942, the fluorescent penetrant inspection started to be an option in the market, once the product whose trade name was Zyglo became manufactured in large scale by Magnaflux Corporation. The patent of Zyglo was only issued in July 30th of 1946 to Mr. R. Ward (Betz (1963)).
Before the release of Zyglo, several manufacturing enterprises that demanded surface inspec-tion of nonmagnetic parts attempted to execute a technique called hot oil which was based on leaked information from Magnaflux and Switzer Brother’s research. This method employed hot lubricating oil as penetrant, quick excess penetrant removal aided with solvent and analysis under black light illumination. The glare of the indications was observed by the inspector’s eyes. Some aircraft and marine engine companies, under the pursuit of quality caused by War, were satisfied with the hot oil performance. Nonetheless, some companies did not achieve sat-isfactory inspection results. When Zyglo came out for purchasing, it immediately replaced the hot oil method.
Nowadays, the penetrant testing evolved. It is widely used for ensuring high quality in aerospace production and maintenance. It became a cost-effective, simple, fast and powerful nondestruc-tive testing (NDT) method capable to detect the presence of open to surface discontinuities which are either already in the raw material or resulted from the fabrication/service. The uti-lization of fluorescent penetrants was consolidated. The fluorescent penetrant inspection (FPI) is largely performed for guaranteeing the airworthiness of aircrafts.
Problem Statement
A large portion of aerospace parts are made of nonmagnetic materials. In these workpieces, the PT is the most convenient NDT method capable to detect surface discontinuities which are high stress concentration areas and possible initiation sites for part failure. Due to this reason, the correct PT inspection is essential for the airworthiness of aircrafts.
Even though the materials which are involved in PT such as penetrant, developer, and emul-sifier evolved over the past years, in manual inspection, the performance is still extremely de-pendent on the human inspectors. He/she pre/post cleans the specimen and applies the required chemical products manually (Betz (1963)), analyzes the detected indications, being influenced by his/her experience, vision acuity, attitude and motivation (Larson (2002)). Such process, in these circumstances, is prone to erroneous interpretation. Once the aerospace industry de-mands outstanding quality, the sensitivity, capability and repeatability are important concerns. The automation provides more reproducible results, eliminating inconvenients inherent to hu-man inspectors.
Research Goals and Contributions
This research comprises a preliminary investigation which is part of the CRIAQ MANU418 project. This main study aims at automating the fluorescent penetrant inspection (FPI), eddy current testing (ET) and infrared thermography, improving the sensitivity, reliability and re-peatability of the methods. The aerospace industries L-3 MAS and Pratt & Whitney Canada are the partners involved in this research and will benefit from the development of the auto-mated system.
For this master project, an indication detection system is developed for automating the inspec-tion stage in FPI in an attempt to eliminate the influence of the inspector’s attitude, motivainspec-tion and vision acuity which are intrinsic to the manual process. Steps prior and posterior such as precleaning, postcleaning, part drying & cool-off, liquid penetrant and developer application, penetrant excess removal are not automated, being conducted manually in the experiments.
the system. The precision uncertainties related to the measurement of maximum euclidean distance and area of indications are evaluated for analyzing the variability of the automated inspection.
Organization of the dissertation
This dissertation consists of seven chapters. In chapter 1, the discontinuities which are likely to be detected through liquid penetrant testing are described. They are analyzed in terms of causes (e.g. manufacturing processes and/or service which generated them) and the corresponding effects in workpieces.
In chapter 2, a general overview of nondestructive evaluation techniques that are most applied in the aerospace industry is explained. Techniques such as liquid penetrant, magnetic particles, eddy current, ultrasound and radiography are briefly described. A maintenance program for the aircraft fleet is exemplified.
In chapter 3, we investigate the liquid penetrant testing in details. The physical phenomena which are responsible for the penetrant entrapment into discontinuities are explained. The types of penetrant, emulsifier and developer and most used methods for applying these chemicals are presented. The metrics and reference panels for evaluating the performance in PT inspection are introduced.
The automation of the fluorescent penetrant inspection, in terms of hardware, is analyzed in chapter 4. Stations in automated systems for loading, cleaning and drying parts and applying the PT chemicals to them are described. Diverse configurations of inspection systems with ultraviolet illumination are explained, providing introduction background for the system that has been developed for this work.
Important factors for the FPI automation related to software for detecting indications are out-lined in chapter 5. It introduces 3 image acquisition techniques and indicates two image seg-mentation approaches for extracting relevant objects of the image. A feature extraction proce-dure is suggested for obtaining characteristics such as maximum euclidean distance, area and shape of indications.
The experimental protocol is described in chapter 6. The samples, the adopted procedure for preparing them and the respective experiments are indicated. The steps for tracing probabil-ity of detection curves and evaluating the system performance in terms of measurement and classification of indications are related. The results are reported in chapter 7. Finally, our conclusions are exposed and guidelines for future work are suggested.
MANUFACTURING METHODS, DISCONTINUITIES AND SERVICE DEGRADATION
The nondestructive testing methods aims at detecting and interpreting indications with certified personnel and specialized equipment classifying them as relevant, non-relevant or false indi-cations (American Society for Materials (2002b)). The false indiindi-cations comprise all formed due to incorrect practice of NDT technique (American Society for Materials (2002b)). For in-stance, in penetrant testing, it would be represented by any region where the excess of penetrant has not been well removed after the dwell time (American Society for Materials (2002b)). The
non-relevant indications consist of discontinuities that do not involve the rejection of a part.
This group includes surface roughness, sealing joint, fasteners, etc. The relevant indications are discontinuities that may be evaluated by an inspector or machine vision system. Based on technical specification or quality code, the part is accepted or rejected (American Society for Materials (2002b)).
In NDT, it is important to know beforehand the history of the workpiece being inspected ( i. e. the manufacturing processes that are involved for the part production and the service to which it was submitted). This provides useful information for verifying critical areas and typical dis-continuities that may be detected. Several are formed during the casting process either in the molten metal (e. g. inclusions) or during solidification (e. g. shrinkage). An analysis of casting ingots is important, once several imperfections and service problems found in forged, rolled, drawn, extruded parts are attributed to conditions that already existed in the ingot, sometimes even before the its primary reduction. In addition, the discontinuities can be formed through all fabrication operation from the casting of the raw material to the finishing of a part. Depending on its type and size, it can result in serious consequences (Shull (2002)). For instance, an ingot with chemical segregation is characterized by composite structures with fragile elements. In metals, the presence of localized regions that deviate from nominal composition can deteriorate the corrosion, mechanical and fatigue resistances as well as fracture toughness, compromising
Among the NDT techniques that are dedicated to the verification of the surface integrity (which includes PT), open to surface cracks are important to be localized. The cracks are long nar-row discontinuities which are found internally or on the surface of materials (Shull (2002), Callister Jr (2007), American Society for Materials (2002b)) as illustrated in figure 1.1. The presence of open to surface discontinuities is the startup of the failure of a mechanical part, once they act as stress concentrators sometimes leading to fracture. As long as cyclic stresses are maintained, the cracks tend to be enlarged in the direction and orientation of the stress concentration. If it grows at a critical level, the part must be discarded, assuming that the final failure is reached (Callister Jr (2007)). Otherwise, if safety is an important issue, disasters as the picture in figure 1.2 may happen (Callister Jr (2007)). Stress concentration areas in a part could be exemplified by sharp fillets, keyways, threads, dents, scratches, roughness, corrosion, laps, bursts, laminations, seams, stringers, the flash line, undercut, heat affected zone (HAZ), porosities, shrinkage, etc (Callister Jr (2007), American Society for Materials (2002b)). Ther-mal cycling during the welding and machining results in high residual stresses. During the service, if cyclic load is applied to these regions, extremely small cracks on the surface may be generated due to these initiation sites. Inadequate conditions of manufacturing operations like casting, forming (see figure 1.3), machining, joining may result into cracks as well. The appli-cation of stresses in corroded areas may also initiate these discontinuities (American Society for Materials (2002b)).
In this chapter, some fabrication techniques and service degradation processes are explained. The comprehension of them is crucial for the analysis of discontinuities caused during the manufacturing and service of parts. Several types are analyzed in terms of causes and effects. At the end, there is a summary of the main topics which are discussed in this chapter.
Figure 1.1 Typical case of part failure due to crack propagation. A crack formed on the top of the surface propagated slowly and a rapid fracture happened.
Reproduced from the book Callister Jr (2007) 1.1 Casting
The casting is a manufacturing process in which a fully molten metal fills, through a pouring technique, a mold cavity that provides the shape of final part after solidification. The casting is chosen as fabrication method, if a quite large or very complicated geometry part must be produced, and/or if the material is an alloy whose ductility is extremely low for forming. The most common casting techniques are the sand casting, die casting, investment casting, lost
Figure 1.2 Oil tanker which suffered a fracture due to crack propagation. Reproduced from Callister Jr (2007)
Figure 1.3 Forged alloy 7075-T6 part which contains shrinkage cavities and internal cracks formed during the solidification during the casting.
Reproduced from American Society for Materials (2002b)
foam casting and continuous casting. In figures 1.4, 1.5 and 1.6, there are examples of casting molds containing important compounds (American Society for Nondestructive Testing (1981)).
Figure 1.4 Example of gating systems typically used in casting molds. Reproduced from American Society for Nondestructive Testing (1981)
Figure 1.5 Casting mold containing risers for controlling shrinkage. Reproduced from American Society for Nondestructive Testing (1981)
In a casting mold, the riser is a reservoir located outside the casting which aims at supplying molten metal as necessary, compensating the shrinkage before the end of solidification. The runner is a channel that allows the liquid metal to be distributed over receptacles. The gate is a region of the runner that connects with the mold cavity. The sprue is a channel that is linked
Figure 1.6 Casting mold containing a core which is supported by chaplets. Reproduced from American Society for Nondestructive Testing (1981)
to the runner. The core is an element whose function is to generate an internal cavity in the casting. The chill is a metallic component which is designed for increasing the cooling rate of certain walls in the casting. The chaplets constitute metallic supports used for the sustentation of the core during the pouring. They must be made by the same metal as the one filled, because, as it is exposed to the poured metal temperature, it should melt and become part of the same casting (American Society for Materials (2010b)).
The regular nondestructive inspection results in detection several inappropriate casting condi-tions. For instance, the bridging and piping as depicted in figure 1.7 is usually due to high solidification velocity or to insufficient quantity of molten metal to feed the whole mold cavity. Another important example which indicates an incorrect casting process is the presence of cold shut (also known as cold lap) as illustrated in figure 1.8 (b). It is a smooth, generally half-moon shaped discontinuity which happens when two streams of molten metal do not fuse properly. It occurs more often when there is more than an unique gating system which causes an in-terrupted pouring technique. One metal stream solidifies before the second and consequently, there is a lack of fusion. A third indication of improper casting technique is the presence of a surface inclusion usually coated with oxides known as cold shot being represented in figure 1.8 (c). This is due to the extremely quick pouring and to its very small amount of base metal that does not fuse with the casting part. Other evidence of lack of casting control is the detection of a crack-like shaped discontinuities on the surface named as hot tears as shown in figure 1.8 (d). This indicates that the part walls were cooled at different rates. It is likely from happening, if the mold wall thickness varies along its extension. It is the only type of crack observed in castings. The detection through NDT of internal porosities called blowholes (depicted in figure
1.8 (e)) and even the explosion of the casting mold, indicates that it contains elements such as chaplets, chills, inserts, etc made with contaminant materials. Other types of porosities in the casting are due to entrapped gases in the solidifying metal and must be unacceptable in high safety workpiece (American Society for Materials (2002b)).
Figure 1.7 Sketch demonstrating the shrinking cavity, bridging and piping which can occur under inappropriate solidification conditions.
Reproduced from American Society for Materials (2002b)
Figure 1.8 In (a), there is a representation of lack of fusion in a casting; in (b), of cold shut; in (c), of cold shot; in (d), of hot tears and in (e), of blowholes.
Reproduced from American Society for Materials (2002b)
1.2 Forming (plastic deformation shaping)
The forming operations comprise all techniques which deform plastically a part through in-duced forces or stresses without exceeding the strength of the part material. In general, metals can be, with certain control, deformed by these techniques due to its ductility without fracture or crack generation. This group includes manufacturing processes like forging, rolling, draw-ing and extrusion. If the formdraw-ing is conducted under hot temperatures (settdraw-ing often specified
ties, surface finish, and dimension control are achieved. This is explained by smaller ductility levels caused by the higher metal strain hardness (Callister Jr (2007), American Society for Materials (2010a)).
The forging is a process which modifies plastically a metallic piece either by successively blowing or continuously squeezing it with localized compressive hammers and/or presses for obtaining a desired shape. It is mostly conducted under hot temperatures. This operation is divided into closed or open-die forging. In the former, (see figure 1.9 (a)) a force is imposed on several dies halves whose shape contains a cavity which will deform the part into the desired shape. In the latter, in general applied in large parts, two dies whose geometry is quite simple are compressed (Callister Jr (2007), American Society for Materials (2010a)).
The rolling is an operation which reduces the thickness of a metallic part using pairs of rotating rollers as depicted in figures 1.10 and 1.9 (b) . A series of roller pairs gradually reduces the size through compressive stresses. After the last rolling step, a piece with the desired cross-sectional area is obtained (Callister Jr (2007), American Society for Materials (2010a)). The extrusion is a process in which a billet, using a ram, is pressed against a die orifice whose cross-sectional outline is smaller than the original billet diameter (or height and width) as shown in figures 1.11 and 1.9 (c). It is usually employed when the desired cross-section is uniform along the billet length. Similarly to extrusion, the drawing reduces the stock of a larger geometry pulling the part against a die orifice as illustrated in figure 1.9 (d) (Callister Jr (2007), American Society for Materials (2010a)).
If safety is an important concern, an adequate program which establishes a regular NDT in-spection of forging, rolling, extrusion and drawing operations, must be executed in the industry. For example, a burst which is depicted in figure 1.12 determines that the forming is being
con-Figure 1.9 The most common forming tasks. In (a), forging; in (b), rolling; in (c), extruding; and in (d), drawing.
Reproduced from Callister Jr (2007)
Figure 1.10 This picture depicts the rolling operation. The hatched volume illustrated on the left of the figure is flattened to the volume on the right.
Reproduced from American Society for Materials (2010a)
ducted with a force above the workpiece load capacity or at a temperature below the required. If a forged part contains a folded surface (as illustrated in figure 1.13, there is misalignment of the die halves in the forging operation, characterizing a discontinuity known as lap. In
ad-Figure 1.11 This picture depicts the extrusion process. The hot billet is inserted into a container and it is pressed by a ram against a die opening.
Reproduced from American Society for Materials (2010a)
dition, after any forming operation, the NDT may be efficient for revealing indications which were not detected immediately after the solidification of ingots or billets. For instance, if a part contained internal cracks, pipes, inclusions, segregations, blowholes or porosities, etc prior to plastic deformation shaping, these discontinuities are flattened out becoming thinner and parallel-aligned with the surface material, being referred as laminations. Through the same manner, discontinuities called seam and stringer can be formed (American Society for Materi-als (2002b)). The former is located on the surface of the processed part. It is long and similar to a crack. The latter is originally just below the surface, but it can be brought to the surface, if machining is executed. It is short and found in groups (American Society for Materials (2002b)).
1.3 Machining
Machining processes designate the material removing operations aided with sharp cutting tools generating particles of swarf, resulting into parts with diverse shapes and dimensions (Ameri-can Society for Materials (2002a)). To conduct these operations, relative motion between the tool and the part subjected to them is mandatory (American Society for Materials (2002a)). This displacement, the shape of the cutting tool and its penetration generates a machined part
Figure 1.12 Picture of a burst located in a forged bar. Reproduced from American Society for Materials (2002b)
Figure 1.13 Schematics of a lap formed during the forging operation. Reproduced from American Society for Materials (2002b)
with the desired shape (American Society for Materials (2002a)). The most important machin-ing operations are explained below (American Society for Materials (2002a)):
1. The lathe modifies the shape of a dowel, rotating it around its own axis and translating a sharp cutting tool which removes material at the same time. The final product is a part whose shape is either conical or cylindrical (American Society for Materials (2002a)). 2. The milling changes any piece geometry using a rotating cutting tool (called milling
cut-ter) with diverse number of cutting teeth. It allows the manufacturing of different shaped parts. The piece remains static in this process (American Society for Materials (2002a)). In figure 1.14, there is an sketch of a milling cutter removing material.
Figure 1.14 This sketch depicts the milling in the fabrication of a part. Reproduced from American Society for Materials (2002a)
3. Through the drilling, a tool with one or several flutes called drill perforates a cylindrical cavity in the part. The tool is rotated and it is moved in the direction of the axis of hole which is being generated (American Society for Materials (2002a)). The figure 1.15 replicates one example of a drilling machine.
Figure 1.15 This schematics illustrates a radial drilling machine with the compounds. Reproduced from American Society for Materials (2002a)
4. The broaching is a machining operation in which material is removed through the trans-lation of a multiple cutting edges tool. The machined part remains static in most cases (American Society for Materials (2002a)). It provides a good finishing quality, but it is costly due to the price of the cutting tool. The broaching can be external and internal as exposed in figure 1.16 (American Society for Materials (2002a)).
Figure 1.16 These figures illustrates the broaching. In (a), the broach is removing material internally; in (b), the broaching is executed on an external surface.
Reproduced from American Society for Materials (2002a)
The discontinuities most likely from happening during the machining operations are the cracks. The incorrect choice of tool, tools with blunt edges and wrong machining parameters (cutting speed, feed and depth of cut) are the main causes for their generation.
1.4 Welding and Thermal Processing
Welding is the most wordwidely used operation for joining materials such as metals in man-ufacturing and maintenance of parts, equipments and structures. Applications of this process go from the assembly of electronic components to complex metallic structures of ships, tube vessels, vehicles, bridges, etc. Theorically the welding is conducted by the approximation of at least two parts at a short distance allowing chemical bonding between atoms. For some ma-terials and parts, the welding becomes complicated due to factors like roughness, oxide layers, moisture, grease, dust and other contaminants. Arc and gas welding require the melting of filler and base metal around the joint, resulting in a single joint around them. After cooling and solidification of the heated metals, both workpieces are permanently fused together. Due to this thermal cycle, the mechanical properties of the material in the adjacent area may have been affected. This region is known as the heat-affected zone (HAZ), being represented in
minimum distance among the toe and the root and between the face to root in joints such as fillets and laps; the size of a weld (known as penetration in a butt weld) is the depth of the root penetration (in other words, the vertical distance from the toe to the root, disregarding the root reinforcement) (Callister Jr (2007), American Society for Materials (2002c)).
Figure 1.17 This figure represents the heat-affected zone. Reproduced from Callister Jr (2007)
Figures 1.19, 1.20 and 1.21 show typical discontinuities that may result from incorrect welding procedure. As illustrated in figure 1.19, the lack of fusion (LOF) indicates that the base metal did not melt in order to fuse with the filler metal for obtaining a safe weld joint. In the case of lack of penetration (LOP), there was not enough fusion between filler and base metals in the root of the joint. As demonstrated in figure 1.20, the undercut is characterized as groove melted on the base metal surface adjacent to the weld toe or root. The overlap is an excess of filler material which has not been fused with the base metal located beyond the toe or face of a weld. The underfill is a depression of the weld joint due to lack of filler material, being found on the face or on the root of a weld. All of these discontinuities indicate that the welding has not been conducted with proper electrode handling, filler metal or power parameters (American Society for Materials (2002b)).
Figure 1.18 Weld joint most important features. The letter A represents the leg; B, the face; C, the root; D, the toe; E, the throat; F, the penetration; G, the face reinforcement; H,
the root reinforcement; I, the size of weld.
Reproduced from American Society for Materials (2002c)
Figure 1.19 Lack of fusion in a single-V-groove and double-V-groove weld joints and lack of penetration in a single-V-groove and double-V-groove weld joints are represented
in (a), (b), (c) and (d) respectively.
Reproduced from American Society for Materials (2002b)
Once the welding process demands hot temperatures for melting the weld metal followed by its cooling and solidification, the joint suffers from residual stresses caused by hot shortness. This phenomenon, if not properly controlled, may result in cracks in the weld metal or along the base metal near the HAZ. There are several types of welding cracks. The most common are: transverse, longitudinal, crater, hat, underbead, toe, root, HAZ and cold cracks. The figure
Figure 1.20 In a fillet weld, undercut and overlap are represented in (a). In (b), undercut and overlap are depicted in a groove weld. In (c) and (d), there is an illustration of
underfill in groove welds.
Reproduced from American Society for Materials (2002b)
1.21 exemplifies sorts of crack which may be found in welding joints (American Society for Materials (2002b)).
Transverse cracks are due to stress contraction in the direction of the weld axis. They are perpendicular to the axis of the weld, often open to the surface, extending to the base metal near HAZ. They propagate into the weld or beyond the HAZ in order to relieve the residual stresses. The underbead cracks are caused the same way, but they are located in the base metal. The longitudinal cracks are found on the surface, extending from the root to the face, being also consequence of stress contraction (American Society for Materials (2002b)).
Crater crack happens when the joint is not properly formed, resulting into joint craters. Re-garding that a crater is shallow and thinner, it has a faster cooling rate than the remaining joint. Consequently, tensile stresses appear, originating a crack. The hat cracks, as the name says,
Figure 1.21 Crack types which may be found in a weld joint. 1) is a crater crack in weld metal; 2), transverse crack in weld metal; 3) transverse crack in HAZ; 4) longitudinal
crack in weld metal; 5) toe crack in base metal; 6) underbead crack in base metal; 7) fusion-line crack; 8) root crack in weld metal; 9, hat cracks in weld metal.
Reproduced from American Society for Materials (2002b)
have the shape similar to an inverted hat. This defect is located close to the weld face (about halfway up) and extends into the weld metal. It is caused by excessive electrode voltage or welding speed. Toe and root cracks may occur in high residual stresses welding locations. These cracks primarily propagate through the HAZ and may extend to more ductile regions of the base metal. The HAZ cracks are formed due to inadequate prior heating of the parts being joined. Due to it, during the cooling of the joint, the unmelted material shrinks which implicates in contraction stresses in the HAZ, forming cracks (American Society for Materials (2002b)).
In addition, several material properties may be adjusted through thermal processing methods. Annealing consists in submitting a part to high temperature (below the fusion temperature) for a long period and letting it cool slowly. It can be an efficient method for adapting the material microstructure according to the working requirements, relieving stresses, increasing the duc-tility and toughness. In steels, most of the heat treatments are for hardness improvement. In
Aircraft components which are regularly in service are subjected to degradation. The assess-ment of the integrity of parts must be conducted preventively. Otherwise catastrophic failure will happen suddenly and without any warning. The fatigue is a sort of failure which is ob-served in structures submitted to dynamic and fluctuating stresses, occurring after long periods of cyclic load (Callister Jr (2007)). Under these conditions, fatigue cracks are formed and the failure of a part may be developed at stress levels below the tensile or yield strength for a static load (Callister Jr (2007)). Open to surface discontinuities aggravate these effects, once comprise stress raising sites.
Furthermore, the corrosion deteriorates mechanical properties of workpieces, compromising their service as well (American Society for Nondestructive Testing (1981), Callister Jr (2007)). It consists of a degradation of metals due to the chemical action of a medium ( which can be a liquid, gas or both) that is likely from developing along the service (American Society for Nondestructive Testing (1981), Callister Jr (2007)). The impact of the corrosion depends on the combination of metals and the involved corrosive agents (American Society for Nonde-structive Testing (1981), Callister Jr (2007)). Accompanied by corrosion, the fretting is one type of wear which compromises drastically the serviceability of workpieces (American Soci-ety for Nondestructive Testing (1981)). It is caused by movements of mating surfaces under load (American Society for Nondestructive Testing (1981)). The stress corrosion cracks are susceptible to be formed if the they are submitted to cyclic and small amplitude movements, leading to mechanical failure (American Society for Nondestructive Testing (1981)).
1.6 Summary
This chapter was an introduction to defects that are likely to occur due to improper manu-facturing parameters and hostile service condition. Even though some internal discontinuities
were briefly described, only surface indications are revealed through liquid penetrant testing. For verifying the integrity of workpieces internally, radiography and ultrasound are the most recommended methods. Therefore, PT testing is capable to detect the cold shot, laps, flash line tears, LOP, seam and stringers. Cracks, cold shuts, porosities, inclusions, hot tears, bursts, blowholes and LOF, if open to surface, can be observed through PT. Table 1.1 contains causes and effects of discontinuities feasible to be detected through penetrant testing.
Table 1.1 Summary of the main defects which can be detected through PT
Discontinuity Causes Effects
Porosity Gases which are entrapped either in the mold or in the molten metal
Low density part, more fragile structure, stress ris-ing area generation
Cold Shut Metal streams and poured at different ve-locities, interrupted pouring
Stress raising area
Cold Shot Extremely quick pouring technique Fragile casting structure, stress raising area
Hot Tear Inadequate cooling of the mold, bad mold design
Stress raising area Lap It is likely from happening, if
misalign-ment of hammers or die halves (forging) or rollers (rolling)
Stress raising area
Burst Forming executed over the strength ca-pacity of the material and over the recom-mended temperature
Stress raising area
Seam and
Stringer
Any forming operation is conducted in a part which contains an internal disconti-nuity
Stress raising area
Crack Any manufacturing operation or service condition that induce stresses in the work-piece
Stress raising area
LOF, LOP,
Overlap, Un-derfill and Undercut
Incorrect electrode handling, lack of filler metal and bad power parameters
METHODS OF NONDESTRUCTIVE EVALUATION
The nondestructive evaluation techniques (NDE) also referred as nondestructive inspection (NDI) and nondestructive testing (NDT) comprise physical methods for analysis of material properties without causing any sort of damage to the service and integrity of mechanical parts. The NDE may be employed as a powerful tool for increasing reliability, guaranteeing the safety of workpieces. The NDT equipment can be purchased in stationary/laboratory or portable configurations. Due to it, the inspector is capable to execute analysis on site with a kit, if workpieces are complicated to be transported to a laboratory (Shull (2002), Canadian Institute for NDE (2010)).
The inspectors must be certified according to rules specified in the standards of country where the inspection is being conducted. The Canadian General Standards Board (CGSB) is respon-sible for the standard CGSB-48.9712 which is applicable in Canada. In the United States of America, the adopted standard is SNT-TC-1A. A code which is valid for one country is, in gen-eral, not accepted in other. The CGSB delegates to the Canadian Institute of Nondestructive
Evaluation (CINDE) the task of providing training according to CGSB-48.9712 for personnel
seeking certification. Minimum periods of experience are mandatory, varying between NDT methods and level of certification (Canadian Institute for NDE (2010)).
In Canada, the Department of Natural Resources Canada (NRCan) is the certifying agency which elaborates written and practical certification exams on behalf of CGSB. NRCan is re-sponsible for judging if candidates match with all CGSB certification requirements. Only people with successful scores in examination, minimum training and practical experience is al-lowed to be certified. The certification in NDT is regarded as a privilege delegated to qualified personnel (Canadian Institute for NDE (2010)).
In this chapter, a general overview of the main nondestructive techniques is described. In section 2.1, a general program for aircraft fleet maintenance is analyzed. The techniques of


![Risiko- & [und] Schutzfaktoren der psychischen Gesundheit humanitärer Einsatzhelfer : eine systematische Literaturübersicht](data:image/gif;base64,R0lGODlhAQABAIAAAP///wAAACH5BAEAAAAALAAAAAABAAEAAAICRAEAOw==)