Technology researchers and makes it freely available over the web where possible.
This is an author-deposited version published in: https://sam.ensam.eu
Handle ID: .http://hdl.handle.net/10985/8681
To cite this version :
Laurent GUILLON, Abdel-Ouahab BOUDRAA - Image source detection for geoacoustic inversion by Teager-Kaiser energy operator - Journal of the Acoustical Society of America - Vol. 135, n°6, p.EL258-EL264 - 2014
Image source detection for geoacoustic inversion by
Teager-Kaiser energy operator
Achraf Drira, Laurent Guillon & Abdel-Ouahab Boudraa
Ecole navale, IRENav
BCRM Brest, CC 600, 29240 Brest Cedex 9, France
[email protected]
Abstract
This letter presents an improvement of the image source method (ISM) for geoacoustic inversion. The new algorithm is based on the Teager-Kaiser Energy Operator which amplifies the discontinuities in signals while the soft transitions are reduced. This property is exploited for accurate detection of time arrivals and thus for location of the image sources. The effectiveness of the method is shown on both synthetic and real data and the inversion results are, overall, in good agreement with ground truth and other inversion results with a significant reduction of computation time.
c
2011 Acoustical Society of America
1
Introduction
Image Source Method (ISM) is a recently developed technique for geoacoustic inversion3 which provides the sound speed profile locally with good resolution and with low computa-tional cost compared to classical approaches (see e.g.1 or2). This local inversion strategy requires only one measurement of a signal emitted by a broadband source and recorded by an array of hydrophones. The effectiveness of the ISM has been shown on synthetic and real data.3, 4 However ISM is conditioned by some parameter settings. For further improvement of the computational time and the reduction of the false positive sources, a new time arrival estimation strategy is introduced. This strategy is based on the Teager-Kaiser energy oper-ator (TKEO)5 which is a differential operator well dedicated for peaks detection of signals such as those reflected by the seafloor. Using the arrival times, estimated by the TKEO, arrival angles are calculated by a triangulation method. Once the times and the angles of arrival are estimated, the velocity profile is calculated using the same inversion strategy as described in.3
2
Image sources method
2.1
Principle
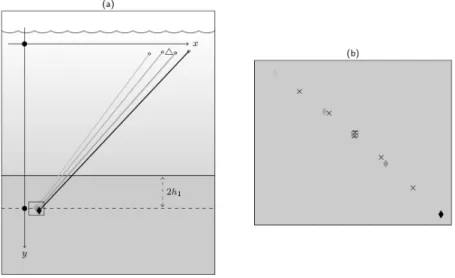
ISM inversion is based on the analysis of an acoustic wave emitted by a point source and reflected by a layered seafloor3 where only one array recording of the seabed reflected path for one shot of the source is used (Fig. 1a). Under the Born approximation, the reflected signal can be modeled as a sum of contributions coming from image sources which are symmetric of the real source with respect to the seabed layers (Fig. 1b). Location of these image sources are related to the sound-speed profile; it is therefore possible to inverse this structure by detecting the image sources.
2.2
Detection algorithm
The first step of ISM is the detection and location of the image sources. In the original work, two maps are reconstructed from the recorded signals: migration map and semblance maps.3 The combination of these maps provides a location of the image sources accurate enough for inversion. This method is later called ISM-MS. The maps are processed in an homogeneous medium, water, so the image sources are not aligned on the source nadir because the refraction is not taken into account (Fig. 1b). Nevertheless, times (ti,j) and
angles (θi,j) of arrival from each image source i to each hydrophone j of the array are
correct.
2.3
Inversion algorithm
At the resolution of the signal which is roughly the wavelength, the number of layers is directly given by the number of detected image sources. The first image source, corresponding to travel only in water, can be used to obtain the system geometry.4 Then, the arrival time and angle of the second image source give the sound speed and thickness of the first layer using Snell-Descartes laws.4 In a recursive way, these quantities are then obtained for all the layers.
3
New algorithm for detection and location
In this section, we show that ti,j and θi,j parameters can be determined in a simple way
with a reduced computational time and with a good precision using a strategy based on the TKEO.5 This method is latter called ISM-TK.
3.1
Teager-Kaiser Energy Operator
TKEO is a nonlinear tracking energy operator and its output to a given signal x(t) is the actual physical energy required to generate x(t).5 It has mainly be used for its demodulation
properties of signals6 but rarely for its self-properties.7 In this work the TKEO output is exploited for detection purpose. In continuous time, it is defined as:
Ψ[x(t)] = ( ˙x(t))2− x(t)¨x(t) . (1)
For discrete time signal x(n), the TKEO can be approximated as follows,7:6
Ψ[x(n)] = x2(n)− x(n + 1)x(n − 1) . (2)
Equation (2) shows that the TKEO computes a running estimate of the signal energy at each instant that takes into account the signal strengths at is immediate neighbors. An important aspect of the TKEO is that it amplifies discontinuities and sudden changes in amplitude while the smooth transitions between the samples are reduced. This property is mainly attributed to the use of second order derivative and is exploited here for the estimation of arrival time by identification of peaks of TKEO output.
3.2
Arrival time estimation
The TKEO-based detection is illustrated on simulated and real data (Sec. 4). Synthetic signals are computed by a numerical evaluation of the Sommerfeld integral with the Born approximation in a stratified fluid. The signals are corrupted with white Gaussian noise of
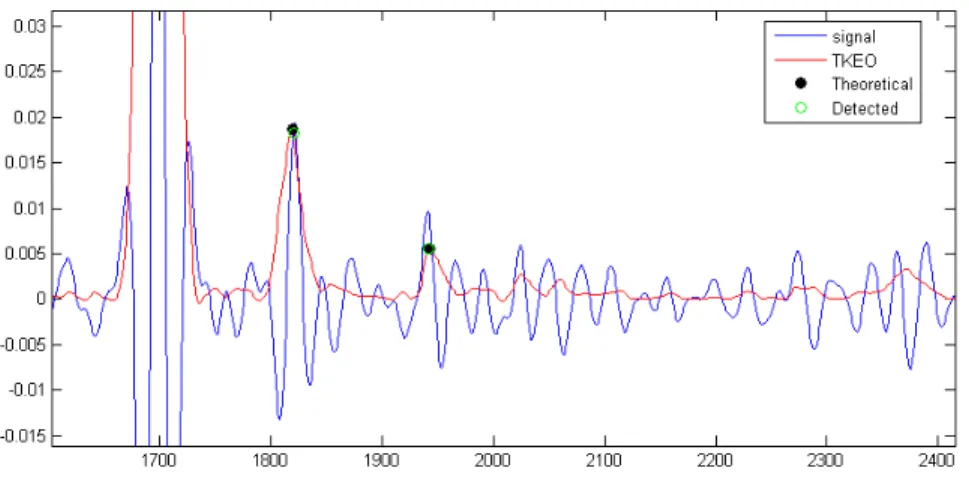
SNR'3 dB and deconvoluted by a cross-correlation with the source signal. The peaks of
the TKEO output (Fig. 2) correspond to arrival times but can also be attributed to noise. To overcome this problem, a threshold, T , is used to isolate the most prominent peaks that are considered as the reflexion of the waves on the surface. More precisely, this threshold is introduced to minimize missing of true peaks, while keeping the number of false detected of peaks, caused by noise, within a reasonable limit. For this, T value is taken as a scaled
version of the mean of the TKEO output: T = C N N X n=1 Ψ[xk(n)] , (3)
where xk is the signal received by the kth hydrophone, N is the number of samples and
C is the scaling factor. This scaling value depends essentially on the input SNR. For the
present synthetic signal the true peaks are successfully detected with C set to 0.9 (Fig. 2). Simulation results also show that TKEO-based approach is also effective for synthetic signals with linear chirp and impulsion sources, horizontal and vertical array and at low SNR. For more robustness of arrival time estimation, the identified peaks of hydrophones are aligned to those of the first hydrophone. This step ensures that each peak corresponds to arrival time of the associated source image. A good resolution of arrival time values is required for better parameters estimation. This method is quite simple, but still sensitive to errors of arrival time estimation. Consequently, for better resolution of peak position an oversampling of the deconvoluted signal is necessary. In practice oversampling of noisy signals can induce fluctuations on peaks which in turn complicates their detection. To remedy to this problem, a smoothing strategy based on the Savitzky-Golay (SG) filter is used. This filter performs a local polynomial regression to determine the smoothed value for each data point.8 This smoothing is superior to the moving average because it preserves the characteristics of the data such as height and width of peak, which are usually washed by moving average.
3.3
Arrival angle estimation
In this work, θ estimation is given by a triangulation method. The calculated arrival times tij
(Sec. 3.2) are converted to distances dij with respect to the water sound-speed c0. Since the sound-speed profile is unknown, dij is the distance between hydrophone j and an equivalent
source image, located in the same direction than the arrival angle of the real source image (Fig. 1b). But unlike the real source images, the equivalent source images locations depend
on the hydrophone position (Fig. 3a). Instead of seeing a single source, the array perceived an extended source. This could be interpreted as a blurring process due to the sound-speed profile.
To obtain an accurate arrival angle for inversion, the intersections located near the nadir of the sources of the pairs of distances dij and dik between image source i and hydrophones
j and k are first computed. This produces M (M − 1)/2 locations M being the number of
hydrophones. The image source position is taken as the median of all these locations (Fig. 3). The median of the hydrophones positions is similarly calculated. Finally, for inversion, the distance di, the arrival time ti, and the arrival angle θi of image source i are computed from
these two median locations.
4
Results
4.1
Synthetic data
The configuration used is similar to that of the data acquired in Clutter 09 experiment4 where an omnidirectional source and an horizontal array of 32 hydrophones with a spacing of 1.05 m are towed by an AUV 12 m above the seafloor. The source transmits a linearly frequency modulated pulse, in the band 1600-3500 Hz, of 1 second duration.
The bottom is composed of two layers of homogeneous thickness and of constant sound speed (Table 1), over a basement. To accurately estimate the arrival time, the signal emitted by the source must be a pulse of a zero-phase. Thus, the same preprocessing is applied to find the emitted signal for the zero-phase impulse response. The estimated geoacoustic parameters from the signals by ISM-TK and ISM-MS methods are reported in Table 1. These results show that, overall, the ISM-TK method performs better in terms of estimation of thickness and sound speed parameters compared to the ISM-MS method. Furthermore, the computation time is reduced by a factor ten.
4.2
Real data
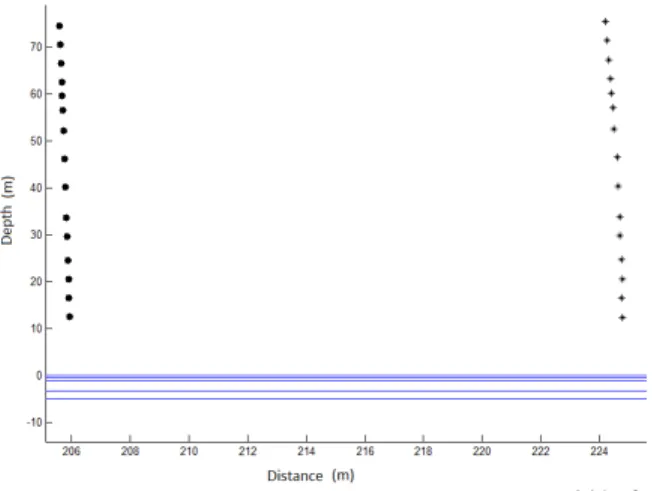
ISM-TK method is tested on data acquired near Elba Island in Italy as part of the SCARAB (Scattering And ReverberAtion from the sea Bottom) experiment series.9 The data are acquired from site 2 where the water depth is 150 m and, from side-scan sonar data, the seabed is flat and featureless; bottom slopes are 0.3 or less. The source is 200 m away from a vertical array of 64 m long and moored on the seafloor. This array is composed of 15 hydrophones where the lowermost one is around 12 m above the seafloor. Due to ocean currents, the array can be distorted. Thus, array inclination must be taken into account and more specifically the experiment geometry. This problem is illustrated by figure 4 where position error is estimated at 24 m. The array correction step is performed with the two arrival time detected with the TKEO on the direct path and the first reflected signal. In this experiment, signal of hydrophone 5 is not be exploitable and thus it has been discarded. Estimation results of the ISM-TK, the ISM-MS and Holland & Osler method9 are compared and are reported in Table 2.
Since the ground truth, provided by coring, is only available for the first fifteen meters of the sediment, comparisons are restricted to this depth. Since Holland & Osler method compares favorably against the ground truth,9 it is used as the reference. Overall, our results confirm the findings of Holland & Osler (Table 2). However, only four layers are identified by ISM-TK method. Also, the first layer has not been identified due to the complexity of the sedimentary stratification of the first meters. However, from the computational point of view, the ISM-TK method is very fast compared to two other methods.
5
Conclusion
In this letter, a new arrival times estimation strategy based on the TKEO is introduced. Arrival times corresponding to each image source are identified as time locations of prominent peaks detected directly on the recorded acoustic signals by the TKEO. The conjunction ISM
and TKEO (ISM-TK) is illustrated on both synthetic and real data. Reported results on synthetic data, show that ISM-TK performs better than IMS-MS in terms of thickness and sound speed parameters estimations and with significantly reduced computational cost by a factor varying from 10 to 50 depending on the medium complexity. The effectiveness of ISM-TK is also illustrated on real data and the obtained inversion results are, overall, in good agreement the ground truth. Based on the TKEO, which is an instantaneous operator, the computation burden of the inversion is largely reduced that makes ISM-TK as a good candidate for real time inversion.
Acknowledgements
The authors would like to thank Charles Holland from Penn State University for making real data available.
References
1 J. Detmer and S. Dosso, ”Trans-dimensional matched-field geoacoustic inversion with hierarchical error models and interacting Markov chains”, J. Acoust. Soc. Am. 132, 2239-2250, (2012).
2 J. Bonnel and N.R. Chapman , ”Geoacoustic inversion in a dispersive waveguide using warping operators ,” J. Acoust. Soc. Am. 130(2), EL101-EL107, (2011).
3 S. Pinson and L. Guillon, ”Sound speed profile characterization by the image source method,” J. Acoust. Soc. Am. 128(4), 1685-1693 (2010).
4 S. Pinson, L. Guillon and C.W. Holland, ”Range dependent sediment sound speed profile measurements using the image source method,” J. Acoust. Soc. Am. 134(1), 156-165 (2013).
5 J.F. Kaiser, ”Some useful properties of Teager’s energy operators,” Proc. ICASSP 3, 149-152 (1993).
6 P. Maragos and T. Quatieri and J.F. Kaiser, ”Speech nonlinearities, modulation and energy operators,” Proc. ICASSP 1, 421-424 (1991).
7 A.O. Boudraa and J.C. Cexus and K. Abed-Meraim, ”Cross-Psi-energy operator-based signal detection,” J. Acoust. Soc. Am. 132(6), 4283-4289 (2008).
8 A. Savitzky and M.J.E. Golay, ”Smoothing and differentiation of data by simplified least squares procedures,” Analytical Chemistry 8(36), 1627-1639 (1964).
9 C.W. Holland and J. Osler, ”High resolution geoacoustic inversion in shallow water: A joint time- and frequency-domain technique,” J. Acoust. Soc. Am. 107(3), 1263-1279 (2010).
Table 1: Sound speed and thickness values of synthetic data estimated by ISM-TK and ISM-MS methods.
Parameters Input values ISM-TK ISM-MS
Layer1 Thickness (m) 2 1.98 2.3
Sound speed (m/s) 1650 1650.1 1658.7
Layer2 Thickness (m) 4 3.98 4
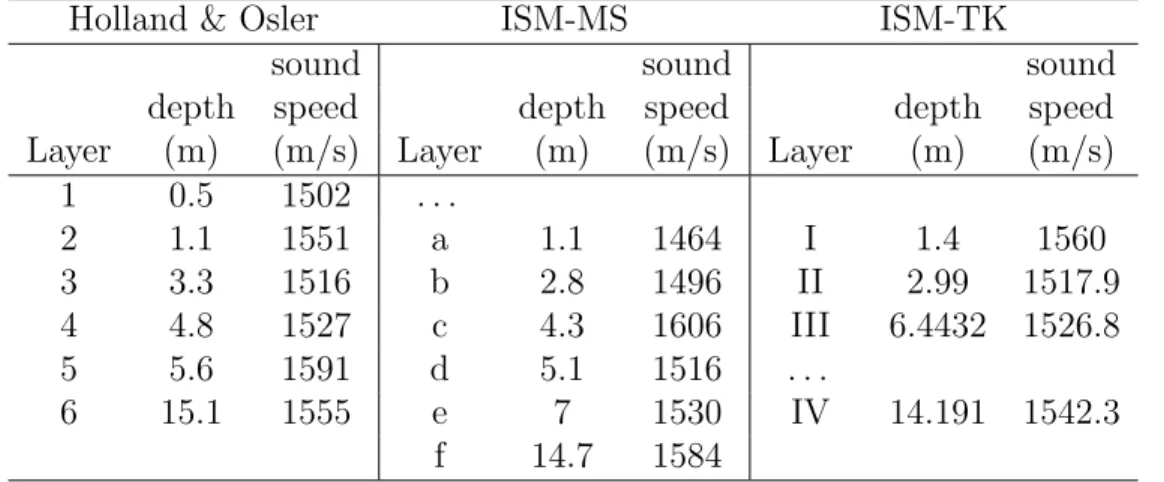
Table 2: Sound speed and thickness values of SCARAB data estimated by ISM-TK, ISM-MS and Holland & Osler methods. ”. . . ” indicate that the layer has not been identified.
Holland & Osler ISM-MS ISM-TK
sound sound sound
depth speed depth speed depth speed Layer (m) (m/s) Layer (m) (m/s) Layer (m) (m/s)
1 0.5 1502 . . . 2 1.1 1551 a 1.1 1464 I 1.4 1560 3 3.3 1516 b 2.8 1496 II 2.99 1517.9 4 4.8 1527 c 4.3 1606 III 6.4432 1526.8 5 5.6 1591 d 5.1 1516 . . . 6 15.1 1555 e 7 1530 IV 14.191 1542.3 f 14.7 1584
List of Figures
1 (a) Reflection of a spherical source over a stratified bottom under Born ap-proximation. (b) Equivalent system with image sources by taking into account the refraction (black circle) or not (black diamond). . . 14 2 Peaks detection on TKEO output. . . 15 3 (a) Location of the equivalent source images relative to different hydrophone
positions, with median position labeled by the triangle. (b) Blowup of the rectangle in left figure. The× label the found positions by the algorithm and the square labels the median of these positions. . . 16 4 Hydrophones positions labeled * from data and + after correction. . . 17
Figure 1: (a) Reflection of a spherical source over a stratified bottom under Born approx-imation. (b) Equivalent system with image sources by taking into account the refraction (black circle) or not (black diamond).
Figure 3: (a) Location of the equivalent source images relative to different hydrophone positions, with median position labeled by the triangle. (b) Blowup of the rectangle in left figure. The × label the found positions by the algorithm and the square labels the median of these positions.

![[PDF] Microsoft Access pour apprendre et réviser ensemble | Cours informatique](data:image/gif;base64,R0lGODlhAQABAIAAAP///wAAACH5BAEAAAAALAAAAAABAAEAAAICRAEAOw==)