HAL Id: hal-02049698
https://hal-univ-rennes1.archives-ouvertes.fr/hal-02049698
Submitted on 18 Dec 2019
HAL is a multi-disciplinary open access archive for the deposit and dissemination of sci-entific research documents, whether they are pub-lished or not. The documents may come from teaching and research institutions in France or abroad, or from public or private research centers.
L’archive ouverte pluridisciplinaire HAL, est destinée au dépôt et à la diffusion de documents scientifiques de niveau recherche, publiés ou non, émanant des établissements d’enseignement et de recherche français ou étrangers, des laboratoires publics ou privés.
Arnaud Hubert, Nicolas Girerd, Hervé Le Breton, Elena Galli, Ichraq Latar,
Maxime Fournet, Philippe Mabo, Frédéric Schnell, Christophe Leclercq,
Erwan Donal
To cite this version:
Arnaud Hubert, Nicolas Girerd, Hervé Le Breton, Elena Galli, Ichraq Latar, et al.. Diagnostic accuracy of lung ultrasound for identification of elevated left ventricular filling pressure. International Journal of Cardiology, Elsevier, 2019, 281, pp.62-68. �10.1016/j.ijcard.2019.01.055�. �hal-02049698�
ACCEPTED MANUSCRIPT
Diagnostic accuracy of Lung Ultrasound for identification of
elevated left ventricular filling pressure
Arnaud Hubert, M.D.1,2,3, Nicolas Girerd, M.D., PhD.4, Hervé Le Breton, M.D., PhD. 1,2,3, Elena
Galli, M.D., PhD. 1,2,3, Ichraq Latar 4, Maxime Fournet, M.D. 1,2,3, Philippe Mabo, M.D. 1,2,3
Frederic Schnell M.D., PhD. 1,2,5, Christophe Leclercq, M.D., PhD. 1,2,3, Erwan Donal, M.D.,
PhD. 1,2,3
1 CHU Rennes, Service de Cardiologie et Maladies Vasculaires et CIC-IT 1414, Rennes,
35000, France
2 Université de Rennes 1, LTSI, Rennes, 35000, France
3 INSERM, U1099, Rennes, 35000, France
4 INSERM, Centre d’Investigations Cliniques 1433, Université de Lorraine, CHU de Nancy, Institut Lorrain du Cœur et des Vaisseaux, Nancy, France and INI-CRCT (Cardiovascular and
Renal Clinical Trialists) F-CRIN network, Nancy, France.
5 CHU Rennes, Service de Médecine du Sport, Rennes, 35000, France
Corresponding author:
Erwan Donal,
Service de Cardiologie et Maladies Vasculaires
CHU de Rennes
2 rue Henri Le Guilloux, 35000 Rennes, France.
E-mail: erwan.donal@chu-rennes.fr
ACCEPTED MANUSCRIPT
Abstract: (193 words)
Aims: The current algorithm in transthoracic echocardiography (TTE) proposed in the 2016
ASE/EACVI recommendation for the estimation of left ventricular filling pressure (LVFP) is
quite complex and time-consuming. B-lines, in lung ultrasonography (LUS), could constitute
an interesting tool for LVFP evaluation in clinical practice, although data regarding their
association with invasive haemodynamics are lacking. The purpose of this study was to explore
the diagnostic accuracy of B-lines in identifying elevated left ventricular end-diastolic pressure
(LVEDP).
Method and results: 81 adults with significant dyspnoea (NYHA2) were prospectively
analyzed by LUS in four areas in each hemithorax and a complete TTE within four hours prior
to coronary angiography. Twenty-eight patients had elevated LVEDP. Clinical variables
yielded a C-index of 79% to identify elevated LVEDP. The number of total B-lines was higher
in the elevated LVEDP group (1.0vs17.0, p<0.0001) and significantly increased the diagnostic
accuracy (C-index increase=10.5%, p=0.002) and net reclassification index (NRI=145.4,
113.0-177.9, p<0.0001) on top of clinical variables.
Conclusion: This study demonstrates the substantial diagnostic capacity of B-lines to identify
elevated LVEDP, which appears superior to that of classical echocardiographic strategies. This
tool should be considered in a multi-parametric approach in patients with heart failure.
Conflicts of interests: None
Running title: B-lines and left ventricular filling pressure
Keywords: B-lines, lung ultrasonography, left ventricular filling pressure, echocardiography Word count (without tables and figures): 4415 words
ACCEPTED MANUSCRIPT
Introduction
Echocardiography is currently the gold standard in the routine evaluation of left
ventricular filling pattern in patients with dyspnoea and/or heart failure. The 2016 American
Society of Echocardiography (ASE) and European Association of Cardiovascular Imaging
(EACVI) guidelines for the evaluation of left ventricular diastolic function[1] reported a new
algorithm to assess the presence and severity (grade 1 to 3) of diastolic dysfunction (DD) and
to estimate Left Ventricular Filling Pressure (LVFP). This algorithm, based on the estimation of left atrial volume, E wave, velocity, e’ septal and lateral velocity by Tissue Doppler Imaging
(TDI), and maximal tricuspid velocity is quite complex and time-consuming.
B-lines (also called “comet-tail artefacts” or “lung comet”) are linear artefacts that are
observed during lung ultrasonography (LUS), reflecting extravascular lung water [2]. LUS is simple and can be applied quickly at a patient’s bedside with the same probe that is used for
echocardiography. The utility of B-line quantification for the diagnosis of acute pulmonary
oedema has been demonstrated in multiple studies. B-line number shows a good correlation with chest radiography findings, brain natriuretic peptide levels and E/e’ ratio [3–6]. In patients
with subclinical pulmonary congestion, the assessment of B-lines allows the diagnosis of
subclinical pulmonary congestion and is strongly associated with clinical outcome[7–9]. With
regard to the ASE/EACVI joint recommendations which can be difficult to apply in the
presence of severe valvulopathy and/or atrial fibrillation, B-line quantification can be
performed in these clinical conditions and is associated with clinical outcome regardless of
underlying heart disease [10]. Moreover, echocardiographic algorithms are influenced by
ageing given its strong association with diastolic function impairment; this may decrease the
diagnostic accuracy for elevated LVFP in these patients[11]. B-lines could therefore constitute
a valuable bedside tool for LVFP evaluation in routine clinical practice. A previous study[12]
ACCEPTED MANUSCRIPT
evaluate diagnostic accuracy per se and included mostly young patients (a third of the patients
were included after heart transplant). Data regarding the association between B-lines and left
cardiac haemodynamics in non-transplanted elderly patients are still lacking.
The purpose of this study was to explore the diagnostic accuracy of B-lines to identify
elevated left ventricular end-diastolic pressure (LVEDP), as assessed by left heart
catheterization (LHC).
Methods
Study sample
We prospectively included 93 adults (18 years old) with significant dyspnoea
(NYHA2) who underwent a coronary angiography with left heart catheterization from May
2016 to July 2017. Patients with mitral stenosis (because of significant differences in LVEDP
compared to other heart disease), known pulmonary fibrosis, pneumonia, active lung cancer or
a history of recent chest trauma were excluded. Patients who had any change in diuretic
treatment between Transthoracic Echocardiography (TTE) and LHC were also excluded. These
exclusion criteria were chosen among conditions that alter B-line counting[13]. Clinical and
demographic data were obtained from the review of medical records. N-terminal Pro-Brain
Natriuretic Peptide (NT-ProBNP) testing was performed within routine care prior to the
angiography and recorded when available. The study protocol was approved by our local ethics
committee (authorization number: 2014-A01331-456).
Transthoracic Echocardiography
All patients underwent a standard TTE prior to LHC using a Vivid S6, E7 or E9
ultrasound system (General Electric Healthcare, Horten, Norway). Images were recorded on a
remote station for off-line analysis by dedicated software (EchoPAC PC, version BT 13,
ACCEPTED MANUSCRIPT
data. Left ventricular ejection fraction (LVEF) was measured by biplane Simpson’s method,
and LVEF50% was considered to constitute a preserved ejection fraction [14]. Typical
diastolic parameters were measured: peak tricuspid regurgitation velocity, right atrial pressure
estimated by inferior vena cava diameter and collapsibility, mitral LV inflow early peak (E)
with the deceleration time and late peak (A), isovolumic relaxation time (IVRT), septal and lateral diastolic early peak velocity of mitral annulus (e’) and left atrial volume index
(LAVi)[1].
Lung Ultrasonography
Lung ultrasonography was performed immediately before a comprehensive TTE with
patients in supine or near-to-supine position, as previously described [2]. Four different areas
for each hemithorax were explored during five seconds (Figure 1, panel B-1). The probe was
placed in sagittal orientation, in the intercostal space, at an imaging depth of 10 to 14 cm. Loops
were recorded in order to maximize the number of B-lines for each zone by adjusting the gain
to allow for optimal visualization of the pleural line and B-lines (Figure 1, panel B-2). The
scanning lasted less than 3 minutes. Loops were stored on a remote station to perform off-line
analysis with the same tools as those used for TTE. For each lung ultrasound zone, the number
of B-lines was quantified from 0 to 10. Consequently, LUS scoring ranged from 0 to 80
(8-zones method). B-line count was used either as a continuous variable or dichotomized using
the following cut-offs: 1) 3, which has been reported to be the best cut-off for the prediction of
stable heart failure (HF) patient outcomes[7,15], 2) 8, which approximately corresponds to a
score of 30 when using the 28-points method, a useful cut-off in patients at discharge from HF
hospitalization[16], and 3) the presence of one or two bilateral positive zones (> 2 B-lines on a
ACCEPTED MANUSCRIPT
Haemodynamic data
LHC was performed, within four hours after TTE, via a retrograde approach from the
radial artery. Before coronary angiography, transducers were calibrated, with a 0-level set at
the mid-axillary line. The LVEDP was recorded continuously (25 mm/s) with a 5 French Judkin
R4 catheter (ICU Medical, San Clemente, CA, USA) placed at the mid-LV cavity using
fluoroscopic screening. Waveform analysis was performed from paper tracings and was blinded
from lung and heart ultrasonographic data. The LVEDP was calculated as the mean value of 4
consecutive heart cycles.
An elevated LVEDP was defined by a LVEDP > 20 mmHg[17]. In our experience, a LVEDP
cut-off of 16 mm Hg is not strongly associated with symptoms and signs of congestion.
Inter- and intra-observer variability
Interpretation of LUS loops was repeated in 10 random patients (>10% of the total
population). An inter-observer reproducibility assessment was performed by 4 independent
observers. For the intra-observer reproducibility assessment, the second reading was performed
at least 2 months after the initial evaluation. During these repeated measurements, all observers
were blinded to previous analysis and were unaware of patient clinical and haemodynamic data.
Statistical analysis
Continuous data are presented as the mean standard deviation, and categorical data
are presented as numbers. The distributions of variables were assessed visually. Comparisons
between both groups (LVEDP 20 mm Hg or > 20 mm Hg) were performed using an unpaired
t-test or a Mann-Whitney test for continuous variables and a χ2 test or Fisher’s exact test for
categorical variables, as appropriate. Correlation between parameters and LVEDP was tested
ACCEPTED MANUSCRIPT
under the curves (AUC) were calculated for the ability of each parameter to identify patients
with a LVEDP > 20 mmHg. In addition, continuous net reclassification improvement (NRI)
was performed to assess the additional value of ultrasonography parameters on top of clinical
variables in predicting LVEDP>20 mmHg. A diagnostic accuracy increase on top of these
clinical variables was assessed using C-index differences extracted from logistic models.
Inter- and intra-observer variabilities of B-line counting were expressed by intra-class
correlation coefficients.
Tests with p-values less than 0.05 were considered to be statistically significant.
Statistical analysis was performed using SAS (SAS institute, North Carolina, US).
Results
Patient characteristics
Among the 81 analysed patients (Figure 1, panel A), 28 had elevated LVEDP (Table 1).
Patients with elevated LVEDP were more likely to have diabetes, chronic obstructive
pulmonary disease (COPD) and heart failure. There were no significant differences in the
proportion of history of chronic kidney disease, severe heart valve diseases, atrial fibrillation
(AF) and coronary disease.
Differences in lung and heart ultrasonography variables according to LVEDP
A marked difference was identified in B-line count according to LVEDP level (median
B-line count 1.0 (0.0 - 4.0) in patients with LVEDP<20 vs. 17.0 (9.0 - 24.0) in patients with
LVEDP ≥ 20 mmHg, p<0.0001, Table 2). This significant difference persisted upon
dichotomization of B-lines (all p<0.001). The 8 B-line cut-offs yielded marginally fewer true
positive patients than the 3 B-line cut-offs (78.6% vs. 85.7%, respectively) although with
ACCEPTED MANUSCRIPT
Overall, LV diastolic parameters were more impaired in the elevated LVEDP group
(Table 2): E/A ratio and average mitral E/é ratio were higher (1.3 vs. 0.8, p=0.001 and 15.6 vs.
11.6, p=0.014, respectively), and E wave deceleration time and isovolumic relaxation time were
shorter (167 vs. 216 ms, p=0.004 and 106.3 vs. 125.0 ms, p=0.035, respectively). Of note, LAVi
was not significantly different across groups (45.7 vs. 49.1 ml.m-2, p=0.51).
The following parameters were significantly higher in the elevated LVEDP group: peak
Tricuspid Regurgitation (TR) velocity (2.9±0.6 cm.s-1 vs. 2.5±0.4, p=0.002), inferior vena cava
diameter (18.5 mm vs. 11.0, p<0.0001) and estimated systolic pulmonary artery pressure (50.0
vs. 30.0 mmHg, p=0.0007).
Correlation of lung and heart ultrasonography variables with LVEDP
The correlation between B-line count and LVEDP was higher than that observed for all
echocardiographic parameters (r=0.62 for B-line count vs. r<0.50 for all right- or left-sided
echocardiographic parameters, Table 3). Among LV parameters, the highest correlation was
observed for E/A ratio (r=0.338). Peak tricuspid regurgitation velocity, inferior vena cava
diameter and estimated systolic pulmonary artery pressure exhibited correlations with LVEDP
ranging from 0.40 to 0.50.
Diagnostic accuracy for elevated LVEDP of lung and heart ultrasonography variables (Figure
1-panel C)
None of the clinical and echocardiographic parameters significantly increased the
diagnostic accuracy for elevated LVEDP in addition to clinical variables (namely, age, NYHA
class, signs of pulmonary congestion, diabetes, COPD and history of heart failure) except for
IVC diameter C-Index increase of 7.1 (0.3 to 14.0), p=0.042, Table 3 and PASP C-Index
ACCEPTED MANUSCRIPT
significant increase in C-index (C-Index increase of 0.8 (-5.6 to 7.2), p=0.81). In contrast,
B-line count used either as a continuous or dichotomous variable significantly increased the
diagnostic accuracy C-index increase of 10.5 (3.7 to 17.3), p=0.002 for total B-line count; 5.9
(-0.1 to 11.9), p=0.053 for B-lines 3; 8.6 (2.4 to 14.8), p=0.007 for B-lines 8, Table 3. The
diagnostic accuracy obtained with the joint use of clinical variables and B-lines was excellent C-index=95.5 (90 to 100). These results remained consistent in subgroup analysis in the AF population or decreased ejection fraction (LVEF < 30%; LVEF<40%) (table in supplementary
materials 2).
Reclassification was not significantly increased when using left-sided recorded
ultrasonography parameters. In contrast, IVC diameter, peak tricuspid regurgitation velocity
and estimated systolic pulmonary arterial pressures as well as lung ultrasonography parameters
significantly increased reclassification.
Of note, the integration of the last recommendations in the evaluation of LV pressure
did not increase either the reclassification NRI 45.0 (-5.6 to 95.6), p=0.081 or diagnostic
accuracy C-index increase of -0.2 (-1.6 to 1.3), p=0.82.
Lastly, intra- and inter-observer reproducibility was excellent, with ICCs > 0.9 for both
measurements (graphs in supplementary materials).
Discussion
In this study, B-line count as measured by lung ultrasonography (LUS) was the variable
most strongly correlated with invasively measured LVEDP, and significantly increased both
diagnostic accuracy and reclassification for elevated LVEDP. Strikingly, none of the left-sided
recorded echocardiographic parameters correlated well with LVEDP or were associated with a
similarly important increase in diagnostic accuracy for elevated LVEDP. In contrast, peak TR
ACCEPTED MANUSCRIPT
significantly increased the diagnostic accuracy for elevated LVEDP. Taken together, these
results suggest the usefulness of LUS and IVC diameter quantification for evaluating LV filling
pressures.
Lung ultrasonography to identify elevated filling pressures
Our study is the first to demonstrate an association between elevated LVEDP measured
by LHC and B-line count. In a previous study, Platz et al., reported a fair association of B-line
count with right-sided haemodynamic variables [12], whereas no significant association was
identified with wedge pressures. In contrast, in the present study, we found a moderate
association between B-line count and LV filling pressures. The mismatch between wedge
pressures and pulmonary congestion observed in some patients [18] could account for these
discrepancies. Furthermore, Halpern et al. recently questioned the relevance of wedge pressure
to correctly classify pre- and post-capillary hypertension[19]; thereby casting some doubt on
the ability of wedge pressure to appropriately identify pulmonary oedema. Consequently, our
study strengthens the case of LUS for the correct assessment of heart haemodynamics that are
relevant for congestion evaluation (i.e., LVEDP).
A 28-zone LUS is usually used in ambulatory or hospitalized patients with heart failure
during their hospital stay [6,10,16]. In this study, we used a simplified technique using 8
scanning zones, similar to the imaging strategy used by Platz et al. in ambulatory patients[12].
However, B-line quantification using a score graded on a scale of 80 was used as opposed to
the diagnosis algorithm used in the emergency department. The strong association and
diagnostic accuracy of this semi-quantitative simplified technique, which can be performed in
a few minutes, suggest its adequacy for routine clinical practice. The finding of 0.3 B-lines or
more per scanning site does appear as a reliable threshold to identify high-risk ambulatory HF
ACCEPTED MANUSCRIPT
p<0.001). Our study provides the haemodynamic background for this observation as patients
with 0.3 B-lines or more are very likely to have a LVEDP higher than 20 mmHg.
On the other hand, the use of 8 B-lines as a cut-off for a 28-point technique (i.e., a
similar 0.3 B-lines per scanning site) could provide similar diagnostic accuracy with a reduced
risk of misclassification[15], but at the expense of a moderately longer acquisition time.
Echocardiography to identify elevated filling pressures
IVC diameter and peak TR velocity were found to be relevant markers of elevated
LVEDP. Ommen et al. demonstrated a clear correlation between IVC diameter and right atrial
pressure [21] that could be increased as a result of LV diastolic dysfunction, hypervolemia or
both. Peak TR velocity is a marker of elevated pulmonary artery systolic pressure (PASP).
Transthoracic echocardiography ascertains the pre- or post-capillary status of pulmonary
hypertension [22]; however, postcapillary hypertension is the most frequent in patients with HF
and/or LV diastolic dysfunction [23]. When associated with LUS, and based on the results of
our study, IVC does appear to be the best candidate to identify elevated LVEDP since it was
the only parameter to significantly increase diagnostic accuracy on top of clinical variables.
Weaknesses of traditional LV echocardiographic parameters to identify LVEDP
Typical markers of LV diastolic dysfunction that are used as individual markers did not
effectively identify elevated LVEDP. In addition to an international study by Sato et al. [24],
Lancellotti et al., in a recent multicentre European study [25], reported concurring results. Most
importantly, the algorithm recommended in the 2016 ASE/EACVI recommendations yielded
only a moderate performance for elevated LVEDP (C-index 0.78). In our study, the diagnostic
ACCEPTED MANUSCRIPT
2016 ASE/EACVI algorithm (C-index 0.79), suggesting that the algorithm has no additional
clinical relevance to better assess congestion in patients with HF. This result further adds to the
ongoing debate regarding the usefulness of current algorithms to identify elevated LV filling
pressures [26,27].
The poor diagnostic capacity of the aforementioned algorithm in our cohort could be
the consequence of the limitations of echocardiographic evaluation: high E-wave velocity can be observed in patients with mitral regurgitation, e’ can be altered by mitral annulus
calcifications rather than LV filling pressures, etc. For LA volume, numerous confounding
factors could increase atrial size including AF (approximately 30% of the study population),
mitral insufficiency or aortic stenosis. LA volume seemingly constitutes more of a LV
remodelling marker than a LV filling marker, except for a highly selected population. In
contrast, LUS is not influenced by these cardiac conditions, which in turn could translate into
better diagnostic accuracy.
Clinical implications
B-lines are an efficient marker of elevated LVFP. Consequently, they should be more
frequently implemented in the assessment of LV diastolic function and LVFP. Their
implementation could moreover be extremely easy in routine practice, either prior to or
immediately after transthoracic echocardiography, and could be completed within less than 3
minutes.
In addition, because of the portability of recently introduced hand-held devices, LUS
could further be easily performed throughout the course of in-hospital management or in the
outpatient setting. We do believe, as other authors [10,28,29], that LUS is more accurate than
ACCEPTED MANUSCRIPT
extension of clinical examination. Whether this powerful diagnostic tool can help better tailor
HF treatment and improve clinical outcomes remains to be tested in clinical trials.
Limitations
Limitations of this study include its single-centre nature and moderate sample size.
Results herein should therefore be interpreted with caution and warrant confirmation in larger
multicentre studies.
LVEDP was considered to be the gold standard in our study although some authors
consider that the mean LAP provides a better estimation of pulmonary congestion [32].
However, rather than including patients with AF in whom LAP usefulness is questionable,
LVEDP was preferentially used as the outcome of our study. In addition, patients with mitral
stenosis were excluded in order to decrease the risk of error in filling pressure estimation using
LVEDP.
B-lines can have non-cardiogenic origin. Although patients with a high risk of false
positive LUS exams (pulmonary fibrosis, etc.) were excluded, we cannot rule out the possibility
that some of the patients included in this cohort had B-lines of non-cardiac origin. However,
despite these potential measurement caveats, LUS yielded an excellent diagnostic accuracy for
elevated LVEDP.
Conclusion
This study demonstrates the important diagnostic capacity of B-lines in identifying elevated left
ventricular end-diastolic pressure. This tool should be considered in a multi-parametric
approach of patients with HF. The simplicity of LUS and IVC diameter measurement allows
ACCEPTED MANUSCRIPT
Acknowledgements:
ACCEPTED MANUSCRIPT
Bibliography
[1] S.F. Nagueh, O.A. Smiseth, C.P. Appleton, B.F. Byrd, H. Dokainish, T. Edvardsen, F.A. Flachskampf, T.C. Gillebert, A.L. Klein, P. Lancellotti, P. Marino, J.K. Oh, B.A. Popescu, A.D. Waggoner, Recommendations for the Evaluation of Left Ventricular Diastolic Function by Echocardiography: An Update from the American Society of Echocardiography and the European Association of?Cardiovascular Imaging, J. Am. Soc. Echocardiogr. 29 (2016) 277–314. doi:10.1016/j.echo.2016.01.011.
[2] E. Picano, F. Frassi, E. Agricola, S. Gligorova, L. Gargani, G. Mottola, Ultrasound lung comets: a clinically useful sign of extravascular lung water, J. Am. Soc. Echocardiogr. Off. Publ. Am. Soc. Echocardiogr. 19 (2006) 356–363. doi:10.1016/j.echo.2005.05.019. [3] Z. Jambrik, S. Monti, V. Coppola, E. Agricola, G. Mottola, M. Miniati, E. Picano,
Usefulness of ultrasound lung comets as a nonradiologic sign of extravascular lung water, Am. J. Cardiol. 93 (2004) 1265–1270. doi:10.1016/j.amjcard.2004.02.012.
[4] L. Gargani, F. Frassi, G. Soldati, P. Tesorio, M. Gheorghiade, E. Picano, Ultrasound lung comets for the differential diagnosis of acute cardiogenic dyspnoea: A comparison with natriuretic peptides☆, Eur. J. Heart Fail. 10 (2008) 70–77. doi:10.1016/j.ejheart.2007.10.009.
[5] F. Frassi, L. Gargani, P. Tesorio, M. Raciti, G. Mottola, E. Picano, Prognostic Value of Extravascular Lung Water Assessed With Ultrasound Lung Comets by Chest Sonography in Patients With Dyspnea and/or Chest Pain, J. Card. Fail. 13 (2007) 830–835. doi:10.1016/j.cardfail.2007.07.003.
[6] M.H. Miglioranza, L. Gargani, R.T. Sant’Anna, M.M. Rover, V.M. Martins, A. Mantovani, C. Weber, M.A. Moraes, C.J. Feldman, R.A.K. Kalil, R. Sicari, E. Picano, T.L.L. Leiria, Lung Ultrasound for the Evaluation of Pulmonary Congestion in Outpatients: A Comparison With Clinical Assessment, Natriuretic Peptides, and Echocardiography, JACC Cardiovasc. Imaging. 6 (2013) 1141–1151. doi:10.1016/j.jcmg.2013.08.004.
[7] E. Platz, E.F. Lewis, H. Uno, J. Peck, E. Pivetta, A.A. Merz, D. Hempel, C. Wilson, S.E. Frasure, P.S. Jhund, S. Cheng, S.D. Solomon, Detection and prognostic value of pulmonary congestion by lung ultrasound in ambulatory heart failure patients†, Eur. Heart J. (2016). doi:10.1093/eurheartj/ehv745.
[8] M.H. Miglioranza, E. Picano, L.P. Badano, R. Sant’Anna, M. Rover, F. Zaffaroni, R. Sicari, R.K. Kalil, T.L. Leiria, L. Gargani, Pulmonary congestion evaluated by lung ultrasound predicts decompensation in heart failure outpatients, Int. J. Cardiol. 240 (2017) 271–278. doi:10.1016/j.ijcard.2017.02.150.
[9] C. Cogliati, G. Casazza, E. Ceriani, D. Torzillo, S. Furlotti, I. Bossi, T. Vago, G. Costantino, N. Montano, Lung ultrasound and short-term prognosis in heart failure patients, Int. J. Cardiol. 218 (2016) 104–108. doi:10.1016/j.ijcard.2016.05.010.
[10] S. Coiro, G. Porot, P. Rossignol, G. Ambrosio, E. Carluccio, I. Tritto, O. Huttin, S. Lemoine, N. Sadoul, E. Donal, F. Zannad, N. Girerd, Prognostic value of pulmonary congestion assessed by lung ultrasound imaging during heart failure hospitalisation: A two-centre cohort study, Sci. Rep. 6 (2016). doi:10.1038/srep39426.
[11] E.G. Abinader, D.S. Sharif, Influence of age on Doppler echocardiographic indices of left ventricular diastolic function, Br. Heart J. 61 (1989) 483.
[12] E. Platz, A. Lattanzi, C. Agbo, M. Takeuchi, F.S. Resnic, S.D. Solomon, A.S. Desai, Utility of lung ultrasound in predicting pulmonary and cardiac pressures, Eur. J. Heart Fail. 14 (2012) 1276–1284. doi:10.1093/eurjhf/hfs144.
ACCEPTED MANUSCRIPT
[13] G. Volpicelli, M. Elbarbary, M. Blaivas, D.A. Lichtenstein, G. Mathis, A.W. Kirkpatrick, L. Melniker, L. Gargani, V.E. Noble, G. Via, A. Dean, J.W. Tsung, G. Soldati, R. Copetti, B. Bouhemad, A. Reissig, E. Agricola, J.-J. Rouby, C. Arbelot, A. Liteplo, A. Sargsyan, F. Silva, R. Hoppmann, R. Breitkreutz, A. Seibel, L. Neri, E. Storti, T. Petrovic, International Liaison Committee on Lung Ultrasound (ILC-LUS) for International Consensus Conference on Lung Ultrasound (ICC-LUS), International evidence-based recommendations for point-of-care lung ultrasound, Intensive Care Med. 38 (2012) 577– 591. doi:10.1007/s00134-012-2513-4.
[14] R.M. Lang, L.P. Badano, V. Mor-Avi, J. Afilalo, A. Armstrong, L. Ernande, F.A. Flachskampf, E. Foster, S.A. Goldstein, T. Kuznetsova, P. Lancellotti, D. Muraru, M.H. Picard, E.R. Rietzschel, L. Rudski, K.T. Spencer, W. Tsang, J.-U. Voigt, Recommendations for Cardiac Chamber Quantification by Echocardiography in Adults: An Update from the American Society of Echocardiography and the European Association of Cardiovascular Imaging, J. Am. Soc. Echocardiogr. 28 (2015) 1-39.e14. doi:10.1016/j.echo.2014.10.003.
[15] N. Girerd, P. Rossignol, Performing lung ultrasound at rest and/or after an exercise stress test to better identify high-risk ambulatory patients with heart failure, Eur. J. Heart Fail. (2017). doi:10.1002/ejhf.965.
[16] S. Coiro, P. Rossignol, G. Ambrosio, E. Carluccio, G. Alunni, A. Murrone, I. Tritto, F. Zannad, N. Girerd, Prognostic value of residual pulmonary congestion at discharge assessed by lung ultrasound imaging in heart failure, Eur. J. Heart Fail. 17 (2015) 1172– 1181. doi:10.1002/ejhf.344.
[17] H. Dokainish, J. Nguyen, R. Sengupta, M. Pillai, M. Alam, J. Bobek, N. Lakkis, New, Simple Echocardiographic Indexes for the Estimation of Filling Pressure in Patients with Cardiac Disease and Preserved Left Ventricular Ejection Fraction, Echocardiography. 27 (2010) 946–953. doi:10.1111/j.1540-8175.2010.01177.x.
[18] M. Gheorghiade, G. Filippatos, L. De Luca, J. Burnett, Congestion in acute heart failure syndromes: an essential target of evaluation and treatment, Am. J. Med. 119 (2006) S3– S10. doi:10.1016/j.amjmed.2006.09.011.
[19] S.D. Halpern, D.B. Taichman, Misclassification of pulmonary hypertension due to reliance on pulmonary capillary wedge pressure rather than left ventricular end-diastolic pressure, Chest. 136 (2009) 37–43. doi:10.1378/chest.08-2784.
[20] M.C. Scali, L. Cortigiani, A. Simionuc, D. Gregori, M. Marzilli, E. Picano, Exercise-induced B-lines identify worse functional and prognostic stage in heart failure patients with depressed left ventricular ejection fraction, Eur. J. Heart Fail. (2017) n/a-n/a. doi:10.1002/ejhf.776.
[21] S.R. Ommen, R.A. Nishimura, D.G. Hurrell, K.W. Klarich, Assessment of Right Atrial Pressure With 2-Dimensional and Doppler Echocardiography: A Simultaneous Catheterization and Echocardiographic Study, Mayo Clin. Proc. 75 (2000) 24–29. doi:10.4065/75.1.24.
[22] M. D’Alto, E. Romeo, P. Argiento, A. Pavelescu, C. Mélot, A. D’Andrea, A. Correra, E. Bossone, R. Calabrò, M.G. Russo, R. Naeije, Echocardiographic Prediction of Pre- versus Postcapillary Pulmonary Hypertension, J. Am. Soc. Echocardiogr. 28 (2015) 108–115. doi:10.1016/j.echo.2014.09.004.
[23] N. Galiè, M. Humbert, J.-L. Vachiery, S. Gibbs, I. Lang, A. Torbicki, G. Simonneau, A. Peacock, A. Vonk Noordegraaf, M. Beghetti, A. Ghofrani, M.A. Gomez Sanchez, G. Hansmann, W. Klepetko, P. Lancellotti, M. Matucci, T. McDonagh, L.A. Pierard, P.T. Trindade, M. Zompatori, M. Hoeper, V. Aboyans, A. Vaz Carneiro, S. Achenbach, S. Agewall, Y. Allanore, R. Asteggiano, L. Paolo Badano, J. Albert Barberà, H. Bouvaist, H. Bueno, R.A. Byrne, S. Carerj, G. Castro, Ç. Erol, V. Falk, C. Funck-Brentano, M.
ACCEPTED MANUSCRIPT
Gorenflo, J. Granton, B. Iung, D.G. Kiely, P. Kirchhof, B. Kjellstrom, U. Landmesser, J. Lekakis, C. Lionis, G.Y.H. Lip, S.E. Orfanos, M.H. Park, M.F. Piepoli, P. Ponikowski, M.-P. Revel, D. Rigau, S. Rosenkranz, H. Völler, J. Luis Zamorano, 2015 ESC/ERS Guidelines for the diagnosis and treatment of pulmonary hypertension: The Joint Task Force for the Diagnosis and Treatment of Pulmonary Hypertension of the European Society of Cardiology (ESC) and the European Respiratory Society (ERS): Endorsed by: Association for European Paediatric and Congenital Cardiology (AEPC), International Society for Heart and Lung Transplantation (ISHLT), Eur. Heart J. 37 (2016) 67–119. doi:10.1093/eurheartj/ehv317.
[24] K. Sato, A.D.M. Grant, K. Negishi, P.C. Cremer, T. Negishi, A. Kumar, P. Collier, S.R. Kapadia, R.A. Grimm, M.Y. Desai, B.P. Griffin, Z.B. Popovi?, Reliability of updated left ventricular diastolic function recommendations in predicting elevated left ventricular filling pressure and prognosis, Am. Heart J. 189 (2017) 28–39. doi:10.1016/j.ahj.2017.03.022.
[25] P. Lancellotti, M. Galderisi, T. Edvardsen, E. Donal, G. Goliasch, N. Cardim, J. Magne, S. Laginha, A. Hagendorff, T.F. Haland, L. Aaberge, C. Martinez, A. Rapacciuolo, C. Santoro, F. Ilardi, A. Postolache, R. Dulgheru, A.D. Mateescu, C.C. Beladan, D. Deleanu, S. Marchetta, V. Auffret, E. Schwammenthal, G. Habib, B.A. Popescu, Echo-Doppler estimation of left ventricular filling pressure: results of the multicentre EACVI Euro-Filling study, Eur. Heart J. - Cardiovasc. Imaging. 18 (2017) 961–968. doi:10.1093/ehjci/jex067.
[26] Y.M. Hummel, L.C.Y. Liu, C.S.P. Lam, D.F. Fonseca-Munoz, K. Damman, M. Rienstra, P. van der Meer, S. Rosenkranz, D.J. van Veldhuisen, A.A. Voors, E.S. Hoendermis, Echocardiographic estimation of left ventricular and pulmonary pressures in patients with heart failure and preserved ejection fraction: a study utilizing simultaneous echocardiography and invasive measurements, Eur. J. Heart Fail. (2017). doi:10.1002/ejhf.957.
[27] E. Donal, E. Galli, A.G. Fraser, Non-invasive estimation of left heart filling pressures: another nail in the coffin for E/e’?, Eur. J. Heart Fail. (2017). doi:10.1002/ejhf.944. [28] G. Bedetti, L. Gargani, A. Corbisiero, F. Frassi, E. Poggianti, G. Mottola, Evaluation of
ultrasound lung comets by hand-held echocardiography, Cardiovasc. Ultrasound. 4 (2006) 34. doi:10.1186/1476-7120-4-34.
[29] E. Agricola, C. Marini, Lung ultrasound predicts decompensation in heart failure outpatients: Another piece to the puzzle but still an incomplete picture, Int. J. Cardiol. 240 (2017) 324–325. doi:10.1016/j.ijcard.2017.04.111.
[30] L.W. Stevenson, J.K. Perloff, The limited reliability of physical signs for estimating hemodynamics in chronic heart failure, JAMA. 261 (1989) 884–888.
[31] S. Chakko, D. Woska, H. Martinez, E. de Marchena, L. Futterman, K.M. Kessler, R.J. Myerberg, Clinical, radiographic, and hemodynamic correlations in chronic congestive heart failure: conflicting results may lead to inappropriate care, Am. J. Med. 90 (1991) 353–359.
[32] R.E. Peverill, “Left ventricular filling pressure(s)” - Ambiguous and misleading terminology, best abandoned, Int. J. Cardiol. 191 (2015) 110–113. doi:10.1016/j.ijcard.2015.04.254.
ACCEPTED MANUSCRIPT
Tables and Figures
Figure 1:
Panel A: Flow chart
Panel B: Method of B-line quantification.
Panel 1: The four explored areas on the right hemithorax; Panel 2: Example of a frozen loop of lung ultrasonography with B-lines; Panel 3: The different analysed cut-offs. A: one bilateral positive zone (defined by ≥ 3 B-lines in the same zone); B: two bilateral positive zones; C: Simplified B-line count: sum of all B-lines in the eight zones using two different cut-offs: ≥3 or ≥8 B-lines.
Panel C: ROC curves of the best indices and ASE/EACVI algorithm for the
diagnosis of elevated LVEDP.
ACCEPTED MANUSCRIPT
Table 1: Baseline characteristics
LVEDP: Left Ventricular End Diastolic Pressure; BMI: Body Mass Index; MR: Mitral regurgitation; AR: Aortic Regurgitation; AF: Atrial Fibrillation; COPD: Chronic Obstructive Pulmonary Disease; MDRD: Creatinine clearance by the MDRD formula (Modification of Diet in Renal Disease); Hb: Haemoglobin; NT-ProBNP: N-terminal-Pro Brain Natriuretic Peptide; ACEi: Angiotensin Conversion Enzyme inhibitors; ARAII: Angiotensin Receptor II Antagonists, SBP: Systolic Blood Pressure; DBP: Diastolic Blood Pressure
Overall n=81 LVEDP < 20 mmHg n=53 LVEDP ≥ 20 mmHg n=28 p-value Age (years) 75 (67 - 80) 75 (70 - 80) 75 (64 - 79) 0.49 Sex, male 55 (67.9%) 34 (64.2%) 21 (75.0%) 0.32 BMI (kg.m-²) 26 (23 - 30) 26 (22 - 30) 26 (23 - 30) 0.65 Smoking 31 (38.3%) 20 (37.7%) 11 (39.3%) 0.89 Hypertension 56 (69.1%) 37 (69.8%) 19 (67.9%) 0.86 Dyslipidaemia 37 (45.7%) 24 (45.3%) 13 (46.4%) 0.92 Diabetes mellitus 17 (21.0%) 6 (11.3%) 11 (39.3%) 0.003 Heart Failure 41 (50.6%) 21 (39.6%) 20 (71.4%) 0.007 Coronaropathy 40 (49.4%) 28 (52.8%) 12 (42.9%) 0.39 Severe Valvulopathy 35 (43.2%) 24 (45.3%) 11 (39.2%) 0.96 Severe Aortic Stenosis 24 (29.6%) 17 (32.1%) 7 (25.0%)
MR ≥ 3/4 9 (11.1%) 5 (9.4%) 4 (14.3%) AR ≥ 3/4 2 (2.5%) 2 (3.8%) 0 (0.0%) AF history 25 (30.9%) 18 (34.0%) 7 (25.0%) 0.41 paroxysmal 12 (14.8%) 8 (15.1%) 4 (14.3%) 1.0 permanent 13 (17.3%) 10 (20.8%) 3 (10.7%) 0.36 COPD 6 (7.4%) 1 (1.9%) 5 (17.9%) 0.017 Renal insufficiency 24 (29.6%) 13 (24.5%) 11 (39.3%) 0.17 Biology MDRD (mL.min-1) 68.2 ± 21.3 69.6 ± 19.8 65.5 ± 24.0 0.41 Hb (g.dL-1) 13.5 (12.2 - 14.8) 13.6 (12.4 - 14.8) 13.4 (12.2 - 14.6) 0.69 NT-ProBNP (pg.mL-1) (n= 49 – 31/18) 2013.9 ± 2448.7 1248.1 ± 1603.2 3332.7 ± 3079.6 0.014 Medications B-blockers 47 (58.0%) 30 (56.6%) 17 (60.7%) 0.72 Calcium channel blocker 4 (4.9%) 2 (3.8%) 2 (7.1%) 0.61 ACEi/ARAII 50 (61.7%) 35 (66.0%) 15 (53.6%) 0.27 Thiazide diuretic 2 (2.5%) 1 (1.9%) 1 (3.6%) 0.49 Spironolactone 9 (11.1%) 7 (13.2%) 2 (7.1%) 0.49 Physical examination Heart rate (bpm) 73 ± 15 71 ± 13 75 ± 19 0.34 SBP (mmHg) 135 ± 22 137 ± 22 131 ± 22 0.25 DBP (mmHg) 74 ± 13 74 ± 13 74 ± 14 0.91 NYHA 0.0001 2 59 (72.8%) 46 (86.8%) 13 (46.4%) 3 – 4 22 (27.2%) 7 (13.2%) 15 (53.6%) Angina 18 (22.2%) 15 (28.3%) 3 (10.7%) 0.070
Right heart failure clinical signs 13 (16.0%) 5 (9.4%) 8 (28.6%) 0.052 Left heart failure clinical signs 10 (12.3%) 2 (3.8%) 8 (28.6%) 0.003
ACCEPTED MANUSCRIPT
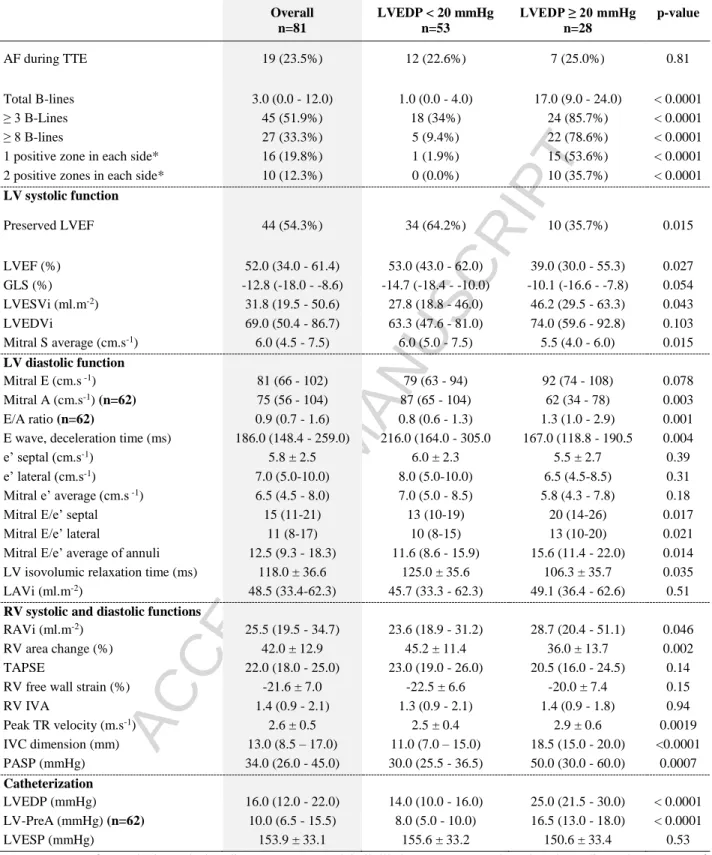
Table 2: Ultrasonographic and catheterization characteristics
Overall n=81 LVEDP < 20 mmHg n=53 LVEDP ≥ 20 mmHg n=28 p-value AF during TTE 19 (23.5%) 12 (22.6%) 7 (25.0%) 0.81 Total B-lines 3.0 (0.0 - 12.0) 1.0 (0.0 - 4.0) 17.0 (9.0 - 24.0) < 0.0001 ≥ 3 B-Lines 45 (51.9%) 18 (34%) 24 (85.7%) < 0.0001 ≥ 8 B-lines 27 (33.3%) 5 (9.4%) 22 (78.6%) < 0.0001 1 positive zone in each side* 16 (19.8%) 1 (1.9%) 15 (53.6%) < 0.0001 2 positive zones in each side* 10 (12.3%) 0 (0.0%) 10 (35.7%) < 0.0001
LV systolic function Preserved LVEF 44 (54.3%) 34 (64.2%) 10 (35.7%) 0.015 LVEF (%) 52.0 (34.0 - 61.4) 53.0 (43.0 - 62.0) 39.0 (30.0 - 55.3) 0.027 GLS (%) -12.8 (-18.0 - -8.6) -14.7 (-18.4 - -10.0) -10.1 (-16.6 - -7.8) 0.054 LVESVi (ml.m-2) 31.8 (19.5 - 50.6) 27.8 (18.8 - 46.0) 46.2 (29.5 - 63.3) 0.043 LVEDVi 69.0 (50.4 - 86.7) 63.3 (47.6 - 81.0) 74.0 (59.6 - 92.8) 0.103 Mitral S average (cm.s-1) 6.0 (4.5 - 7.5) 6.0 (5.0 - 7.5) 5.5 (4.0 - 6.0) 0.015 LV diastolic function Mitral E (cm.s -1) 81 (66 - 102) 79 (63 - 94) 92 (74 - 108) 0.078 Mitral A (cm.s-1) (n=62) 75 (56 - 104) 87 (65 - 104) 62 (34 - 78) 0.003 E/A ratio (n=62) 0.9 (0.7 - 1.6) 0.8 (0.6 - 1.3) 1.3 (1.0 - 2.9) 0.001 E wave, deceleration time (ms) 186.0 (148.4 - 259.0) 216.0 (164.0 - 305.0 167.0 (118.8 - 190.5 0.004 e’ septal (cm.s-1) 5.8 ± 2.5 6.0 ± 2.3 5.5 ± 2.7 0.39
e’ lateral (cm.s-1) 7.0 (5.0-10.0) 8.0 (5.0-10.0) 6.5 (4.5-8.5) 0.31
Mitral e’ average (cm.s -1) 6.5 (4.5 - 8.0) 7.0 (5.0 - 8.5) 5.8 (4.3 - 7.8) 0.18
Mitral E/e’ septal 15 (11-21) 13 (10-19) 20 (14-26) 0.017 Mitral E/e’ lateral 11 (8-17) 10 (8-15) 13 (10-20) 0.021 Mitral E/e’ average of annuli 12.5 (9.3 - 18.3) 11.6 (8.6 - 15.9) 15.6 (11.4 - 22.0) 0.014 LV isovolumic relaxation time (ms) 118.0 ± 36.6 125.0 ± 35.6 106.3 ± 35.7 0.035 LAVi (ml.m-2) 48.5 (33.4-62.3) 45.7 (33.3 - 62.3) 49.1 (36.4 - 62.6) 0.51
RV systolic and diastolic functions
RAVi (ml.m-2) 25.5 (19.5 - 34.7) 23.6 (18.9 - 31.2) 28.7 (20.4 - 51.1) 0.046
RV area change (%) 42.0 ± 12.9 45.2 ± 11.4 36.0 ± 13.7 0.002 TAPSE 22.0 (18.0 - 25.0) 23.0 (19.0 - 26.0) 20.5 (16.0 - 24.5) 0.14 RV free wall strain (%) -21.6 ± 7.0 -22.5 ± 6.6 -20.0 ± 7.4 0.15 RV IVA 1.4 (0.9 - 2.1) 1.3 (0.9 - 2.1) 1.4 (0.9 - 1.8) 0.94 Peak TR velocity (m.s-1) 2.6 ± 0.5 2.5 ± 0.4 2.9 ± 0.6 0.0019 IVC dimension (mm) 13.0 (8.5 – 17.0) 11.0 (7.0 – 15.0) 18.5 (15.0 - 20.0) <0.0001 PASP (mmHg) 34.0 (26.0 - 45.0) 30.0 (25.5 - 36.5) 50.0 (30.0 - 60.0) 0.0007 Catheterization LVEDP (mmHg) 16.0 (12.0 - 22.0) 14.0 (10.0 - 16.0) 25.0 (21.5 - 30.0) < 0.0001 LV-PreA (mmHg) (n=62) 10.0 (6.5 - 15.5) 8.0 (5.0 - 10.0) 16.5 (13.0 - 18.0) < 0.0001 LVESP (mmHg) 153.9 ± 33.1 155.6 ± 33.2 150.6 ± 33.4 0.53
LVEDP: Left Ventricular End Diastolic Pressure; AF: Atrial Fibrillation; TTE: Trans-Thoracic Echocardiography; LVEF: Left Ventricular Ejection Fraction; GLS: Global Longitudinal Strain; LVESVi: Left Ventricular End Systolic Volume index; LVEDVi: Left Ventricular End Diastolic Volume index; LAVi: Left Atrial Volume index; RV: Right Ventricle; RAVi: Right Atrial Volume index; TAPSE: Tricuspid Annular Plane Systolic Excursion; IVA: IsoVolumic Acceleration; TR: Tricuspid Regurgitation; IVC: Inferior Vena Cava; PASP: Pulmonary Artery Systolic Pressure; LV-PreA: Left Ventricular pressure just before A-wave; LVESP: Left Ventricular End Systolic Pressure.
ACCEPTED MANUSCRIPT
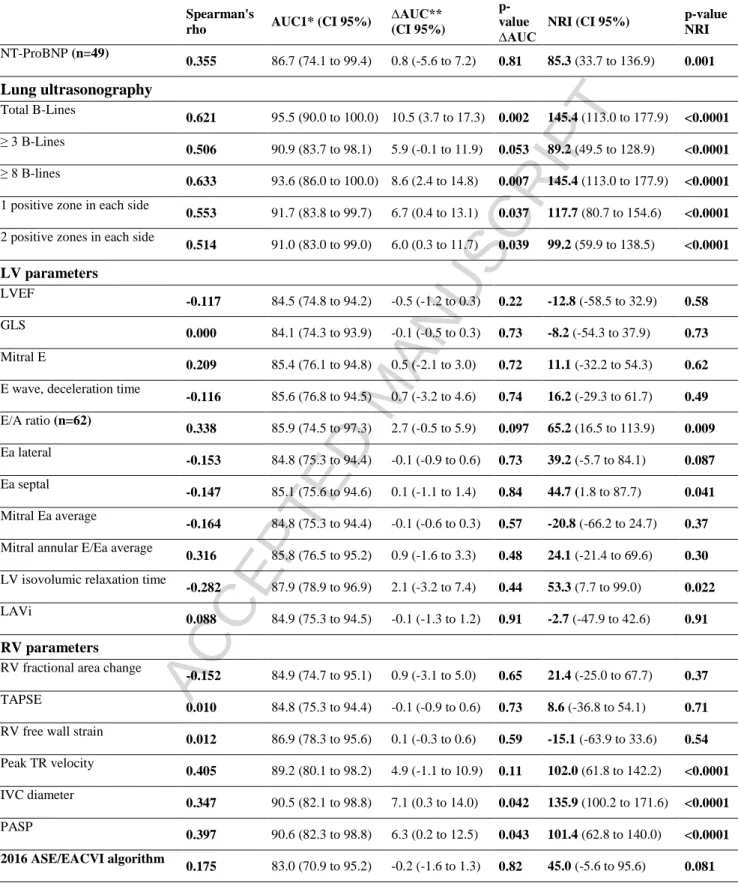
Table 3: Correlations with LVEDP and AUC in predicting an elevated
LVEDP
Spearman's
rho AUC1* (CI 95%)
∆AUC** (CI 95%)
p-value ∆AUC
NRI (CI 95%) p-value
NRI NT-ProBNP (n=49) 0.355 86.7 (74.1 to 99.4) 0.8 (-5.6 to 7.2) 0.81 85.3 (33.7 to 136.9) 0.001 Lung ultrasonography Total B-Lines 0.621 95.5 (90.0 to 100.0) 10.5 (3.7 to 17.3) 0.002 145.4 (113.0 to 177.9) <0.0001 ≥ 3 B-Lines 0.506 90.9 (83.7 to 98.1) 5.9 (-0.1 to 11.9) 0.053 89.2 (49.5 to 128.9) <0.0001 ≥ 8 B-lines 0.633 93.6 (86.0 to 100.0) 8.6 (2.4 to 14.8) 0.007 145.4 (113.0 to 177.9) <0.0001
1 positive zone in each side
0.553 91.7 (83.8 to 99.7) 6.7 (0.4 to 13.1) 0.037 117.7 (80.7 to 154.6) <0.0001
2 positive zones in each side
0.514 91.0 (83.0 to 99.0) 6.0 (0.3 to 11.7) 0.039 99.2 (59.9 to 138.5) <0.0001 LV parameters LVEF -0.117 84.5 (74.8 to 94.2) -0.5 (-1.2 to 0.3) 0.22 -12.8 (-58.5 to 32.9) 0.58 GLS 0.000 84.1 (74.3 to 93.9) -0.1 (-0.5 to 0.3) 0.73 -8.2 (-54.3 to 37.9) 0.73 Mitral E 0.209 85.4 (76.1 to 94.8) 0.5 (-2.1 to 3.0) 0.72 11.1 (-32.2 to 54.3) 0.62
E wave, deceleration time
-0.116 85.6 (76.8 to 94.5) 0.7 (-3.2 to 4.6) 0.74 16.2 (-29.3 to 61.7) 0.49 E/A ratio (n=62) 0.338 85.9 (74.5 to 97.3) 2.7 (-0.5 to 5.9) 0.097 65.2 (16.5 to 113.9) 0.009 Ea lateral -0.153 84.8 (75.3 to 94.4) -0.1 (-0.9 to 0.6) 0.73 39.2 (-5.7 to 84.1) 0.087 Ea septal -0.147 85.1 (75.6 to 94.6) 0.1 (-1.1 to 1.4) 0.84 44.7 (1.8 to 87.7) 0.041 Mitral Ea average -0.164 84.8 (75.3 to 94.4) -0.1 (-0.6 to 0.3) 0.57 -20.8 (-66.2 to 24.7) 0.37
Mitral annular E/Ea average
0.316 85.8 (76.5 to 95.2) 0.9 (-1.6 to 3.3) 0.48 24.1 (-21.4 to 69.6) 0.30
LV isovolumic relaxation time
-0.282 87.9 (78.9 to 96.9) 2.1 (-3.2 to 7.4) 0.44 53.3 (7.7 to 99.0) 0.022
LAVi
0.088 84.9 (75.3 to 94.5) -0.1 (-1.3 to 1.2) 0.91 -2.7 (-47.9 to 42.6) 0.91
RV parameters
RV fractional area change
-0.152 84.9 (74.7 to 95.1) 0.9 (-3.1 to 5.0) 0.65 21.4 (-25.0 to 67.7) 0.37
TAPSE
0.010 84.8 (75.3 to 94.4) -0.1 (-0.9 to 0.6) 0.73 8.6 (-36.8 to 54.1) 0.71
RV free wall strain
0.012 86.9 (78.3 to 95.6) 0.1 (-0.3 to 0.6) 0.59 -15.1 (-63.9 to 33.6) 0.54 Peak TR velocity 0.405 89.2 (80.1 to 98.2) 4.9 (-1.1 to 10.9) 0.11 102.0 (61.8 to 142.2) <0.0001 IVC diameter 0.347 90.5 (82.1 to 98.8) 7.1 (0.3 to 14.0) 0.042 135.9 (100.2 to 171.6) <0.0001 PASP 0.397 90.6 (82.3 to 98.8) 6.3 (0.2 to 12.5) 0.043 101.4 (62.8 to 140.0) <0.0001 2016 ASE/EACVI algorithm 0.175 83.0 (70.9 to 95.2) -0.2 (-1.6 to 1.3) 0.82 45.0 (-5.6 to 95.6) 0.081
ACCEPTED MANUSCRIPT
NRI: Net Reclassification Index; AUC: Area Under the Curve; NT Pro-BNP: N-terminal pro Brain Natriuretic Peptide; LVEF: Left Ventricular Ejection Fraction; GLS: Global Longitudinal Strain; LAVi: Left Atrial Volume index; RV: Right Ventricle; TAPSE: Tricuspid Annular Plane Systolic Excursion; IVA: IsoVolumic Acceleration; TR: Tricuspid Regurgitation; IVC: Inferior Vena Cava; PASP: Pulmonary Artery Systolic Pressure
ACCEPTED MANUSCRIPT
Highlights
Diagnostic accuracy of Lung Ultrasound for identification of
elevated left ventricular filling pressure
ASE/EACVI recommendation for the estimation of left ventricular filling pressure is quite
complex and time consuming. B-lines, in lung ultrasound, could constitute an interesting tool
for LVFP evaluation in clinical practice, but data regarding their association with invasive
hemodynamics are lacking. The purpose of this study is to explore the diagnostic accuracy of
B-lines to identify elevated left ventricular end-diastolic pressure (LVEDP).
About 81 adults with significant dyspnea (NYHA2) were prospectively analyzed. Clinical
variables had a C-index of 79% to identify elevated LVEDP. Total B-lines number was higher in
the elevated LVEDP group (1.0vs17.0, p<0.0001) and significantly increased diagnostic
accuracy (C-index increase=15.5%, p=0.004) and a net reclassification index (NRI=142.0,
108.5-175.6, p<0.0001) on top of clinical variables. In contrast, the 2016 ASE/EACVI
recommendations did not significantly increase neither the reclassification nor the diagnostic
accuracy. There is an important diagnostic capacity of B-lines to identify elevated elevated