Science Arts & Métiers (SAM)
is an open access repository that collects the work of Arts et Métiers Institute of Technology researchers and makes it freely available over the web where possible.
This is an author-deposited version published in: https://sam.ensam.eu
Handle ID: .http://hdl.handle.net/10985/11439
To cite this version :
Julie DIANI, Pierre GILORMINI - Molecular mobility with respect to accessible volume in Monte Carlo lattice model for polymers - Physica A - Vol. 468, p.825-831 - 2017
Molecular mobility with respect to accessible volume in
Monte Carlo lattice model for polymers
J. Diania,∗, P. Gilorminib
aLMS, Ecole Polytechnique, CNRS, Universit´e Paris-Saclay, 91128 Palaiseau, France
bPIMM, ENSAM, CNRS, CNAM, 151 bd de l’Hˆopital, 75013 Paris, France
Abstract
A three-dimensional cubic Monte Carlo lattice model is considered to test the impact of volume on the molecular mobility of amorphous polymers. Assum-ing classic polymer chain dynamics, the concept of locked volume limitAssum-ing the accessible volume around the polymer chains is introduced. The poly-mer mobility is assessed by its ability to explore the entire lattice thanks to reptation motions. When recording the polymer mobility with respect to the lattice accessible volume, a sharp mobility transition is observed as wit-nessed during glass transition. The model ability to reproduce known actual trends in terms of glass transition with respect to material parameters, is also tested.
Keywords: Polymer, Glass transition, Lattice model, dynamic
1. Introduction
Amorphous polymers exhibit a glass transition changing from rubbery state at high temperatures to glassy state at low temperatures. At high temperatures, macromolecular chains are mobile, capable of accommodating large strain due to reptation motions. At low temperatures, chains are in a ‘frozen’ state and show local motions only with restrained cooperative moves [1]. The chain mobility may be linked with the volume surrounding the chains since material volume expands when increasing the temperature. But in the case of polymers, a drastic slowing down of molecular motions is witnessed at the glass transition temperature while the macroscopic volume decreases
continuously. Therefore the direct link between volume and molecular mo-bility is not obvious and proposing a physical theory for the glass transition of polymers remains an open challenge [2, 3, 4]. More modestly, the current contribution aims at exploring the change of molecular mobility according to volume surrounding molecular chains running mere lattice Monte Carlo simulations.
On one hand, molecular dynamics simulations may reproduce realistic chain dynamics but are unable to cover the time frame of glass transition of amorphous polymers. On the other hand, Monte Carlo simulations [5] consider schematic molecular moves but can produce equilibrated configura-tions faster [6] and may help understanding issues that are not reachable by molecular dynamics simulations yet [7]. Therefore, three-dimensional lattice Monte Carlo simulations are considered to study the molecular mobility of the macromolecular chains of a generic amorphous polymer defining original rules to assess for the molecular mobility and to account for temperature changes.
2. Lattice dynamic model
2.1. 3D cubic lattice polymer model
A three-dimensional cube lattice with periodic conditions is considered. The cubic box expands infinitely in the three directions of space defined by the cube edges. Polymer chains are built in lattice using self-avoiding walks (SAW). We will be brief on this aspect since the literature is furnished on the topic, see for instance the recent review [8]. A mere SAW inspired by pruned enriched Rosenbluth sampling [9] was used to build the polymer chains in the periodic lattice. The method was validated by estimating the chain end-to-end distance and the chain gyration radius for long chains. Chains were built simultaneously in order to avoid possible bias. Moreover, in order to avoid statistic aberration, up to ten boxes were built and later tested. Actually, very reproducible results were obtained.
Figure 1 displays an example of periodic lattice of dimension 50x50x50 containing 5 chains, each occupying 10,000 sites of the lattice. Such a ref-erence box defines three parameters, the box dimension N , the number of polymer chains nch, and the volume fraction of polymer fp defined by the
number of sites occupied by the polymer over the number of sites in the lattice. In the polymer box exampling in Figure 1, one reads N = 50, nch=5
Figure 1: Periodic cubic lattice of dimension 503 containing 5 chains occupying 10,000 sites each.
2.2. Polymer chains dynamics
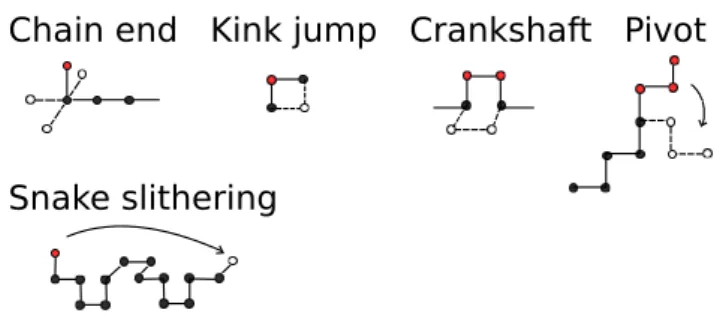
Once built, the polymer chains may show some mobility. Several motions have been proposed in the literature (Figure 2). The chain-end move on one of its free neighbor sites and the kink jump were both proposed by Verdier and Stockmayer [10] and are used frequently. Later, another motion as the 90◦ crankshaft has been added [11]. These dynamic motions are local and suit well the glassy state. The pivot move allowing a long end of the chain to rotate around one of its monomer acting as a pivot has been defined to generate fast large chain motions [12]. Finally, snake-like slithering motions or reptation motions were also considered. See [13] for a description of various slithering motions. Only, the simplest version of reptation, consisting in the progression of the first end forward while the last end is erased, was retained (Figure 2).
Simulations allowing the chains to move randomly according to the vari-ous motions were run, while the polymer mobility was assessed by recording the number of lattice sites visited by the chains within a given duration. First, it was noticed that when the polymer is not highly dilute, the pivot motion is very often denied by the surrounding polymer even when the ex-cluded volume restriction assumption is relaxed. The latter assumption being enforced when non-consecutive monomers cannot be neighbors on the lattice. Second, the chain-end motion, kink jump and crankshaft barely participate
Chain end Kink jump Crankshaft Pivot
Snake slithering
Figure 2: Dynamic motions of the polymer chains.
to the polymer mobility since they do not allow exploring much of the lat-tice. As expected, they are representative of local motions that could take place in the glassy state as well as in the rubbery state but do not add to the polymer mobility. To the contrary, the reptation motion enhanced the molecular mobility favoring the visit of the lattice. In order to illustrate the polymer mobility when reptation moves are considered only, simulations were run allowing at each step every chain to increment a reptation move. Figure 3 shows the ratio of the visited lattice over simulation duration for the system presented in Figure 1. The ratio of visited lattice is defined by the number of initially unoccupied sites that are visited at least once by the polymer over the number of initially unoccupied sites. Therefore it ranges from zero to one. Adding the other motions presented in Figure 2 to the reptation motion does not change Figure 3 noticeably but increases considerably the duration of simulations. Therefore, since our interest focuses on the molecu-lar mobility of the polymer with respect to the volume surrounding it, only the reptation motion was retained reducing severely the simulation duration.
2.3. Lattice locked volume
In order to study the molecular mobility according to the volume sur-rounding the polymer chains, a ratio of lattice sites are chosen randomly among the sites that are not taken by the polymer, and are locked. They are forbidden to the macromolecular chain and therefore act as obstacles. Figure 4 displays a cubic lattice containing one polymer chain that can move freely in it, and the same lattice for which some sites have been locked. One may draw a parallel between lowering the temperature and increasing the number of locked sites. Since, increasing the latter acts as reducing the degree of
0 1 2 3 4 5 Number of steps ×105 0 0.2 0.4 0.6 0.8 1
Rate of visited lattice sites
Figure 3: Cubic lattice volume exploration by snake-like slithering motions over simulation duration.
freedom of the freely moving monomers. Obviously, one expects the molec-ular mobility to be infringed by the locked sites. The interesting question is how the molecular mobility evolves as the number of locked sites grows. For instance, if the mobility decreases proportionally with the increase of locked sites, volume restrain assumption will appear as not enough to witness a fast transition in the molecular mobility as exhibited by polymers at the glass transition. To the contrary, if a molecular mobility threshold is observed for a given locked volume, it will show that mere volume considerations may be enough to witness a molecular mobility drastic change like it occurs at the glass transition. Note that the accessible volume is defined by the lattice sites that are not locked or occupied by polymer chains.
2.4. Lattice simulations
The lattice simulations are run with Matlab [14]. The algorithm is schemed in Figure 5. First, the polymer chains are built simultaneously in the periodic cubic lattice. Second, locked sites are chosen randomly. The ratio of locked sites, noted fl, is defined as the number of locked sites over
the total number of lattice sites. Therefore fl may vary between 0 and
1− fp. Third, at each steps every chain implement a reptation motion on
5 10 15 20 50 25 30 35 40 45 50 40 30 40 50 30 20 20 10 10 5 10 15 20 50 25 30 35 40 45 50 40 30 40 50 30 20 20 10 10
Figure 4: Left: Periodic cubic lattice containing a polymer chain free to explore the whole volume of the lattice. Right: Same periodic lattice with 5% volume restriction by locked sites.
volume restriction was not applied therefore two non-consecutive monomers can appear next to each other. In the case of a chain meeting a dead-end, all the forward sites being locked or taken by the polymer, the chain head and tail are swapped. Note that applying such a head and tail swap randomly, instead of when a dead-end is met only, has for only consequence to expand the duration of simulations. At each step, the amount of visited lattice is calculated by recognizing the sites that have been newly visited. The rep-tation motions are applied within a given duration after which the ratio of locked sites is increased and again randomly chosen. Results are extracted as the ratio of visited lattice with respect to the ratio of locked sites. Note that since the locked sites are randomly chosen for each ratio of locked sites increment, each simulation is independent except for the initial positions of the polymer chains. As a consequence, several polymer chain configurations were considered and it was verified that the polymer chain initial positions did not determine the results.
3. Results
3.1. Chain mobility with respect to open volume
A reference cubic lattice of size N = 50 containing 5 chains occupying 10,000 sites each, and therefore showing a polymer occupation ratio of fp =
Initialization Building Polymer lattice Dynamics For fl = 0 to 1− fp
- Lock fl x N3 free sites chosen randomly
- kstep= 1
While kstep < kmax
- Reptation of the nch chains
- When reptation impossible → head and tail swap - Estimate the ratio of visited sites
- Increment kstep
end
- Increment fl
end
Figure 5: Monte Carlo simulation algorithm
from 105 to 108 steps for ratios of locked sites ranging from 0 (every site of the lattice that is not occupied by the polymer is accessible) to 0.6 (none of the lattice sites is accessible). Figure 6 shows the ratio of visited lattice sites with respect to the ratio of locked sites. For every tested duration, when the amount of locked sites reaches around 38%, the molecular motion is close to null. Above this value, increasing the simulation duration will not increase the polymer mobility, which is in a frozen-like state. The 38% value appears as a threshold below which the molecular mobility is activated and increases quickly. Remarkably, as the simulation duration increases, the change of mobility from null to full occurs in a very narrow span of ratio of locked sites. Another way to present this result, is to look at the duration required to visit a large part of the free sites of the lattice according to the ratio of locked sites. Figure 7 shows the duration needed to visit 95% of the unoccupied sites of the lattice according to the ratio of locked sites for the reference system. As one can read, such a duration grows exponentially after passing 35% of locked sites.
With the proposed model, as long as the chains are surrounded by enough accessible sites, reptation motions happen freely then passing a given thresh-old of unaccessible neighbor sites, reptation motions are not possible any-more. Therefore, mere volume considerations are enough to observe severe motion restrictions as it is witnessed during the glass transition in amorphous polymers. In order to validate this result, the lattice model performance is further tested on issues that can be confronted to known actual behaviors.
0 0.1 0.2 0.3 0.4 0.5 0.6
Ratio of locked sites (fl) 0 0.2 0.4 0.6 0.8 1
Ratio of visited unlocked sites
105 steps 106 steps 107 steps 108 steps
Figure 6: Ratio of the cubic lattice explored by the polymer chains with respect to the ratio of locked sites.
0 0.1 0.2 0.3 0.4 0.5 0.6
Ratio of locked sites (fl) 104 105 106 107 108 109 1010 Duration (# of steps)
Figure 7: Duration to witness the exploration of 95% of the unlocked sites according to the ratio of locked sites.
Note that simulations have been run on larger lattice, up to N = 200, and similar sharp mobility transitions were obtained but not without high computational expense. For indicative comparison, results obtained for a box of N = 50 and reptation duration of 105 steps were matched by duration of 107 steps and a box of N = 100.
3.2. Model ability to reproduce know features
The lattice model is tested for two properties of amorphous polymers that are commonly known. The glass transition temperature depends on the applied hydrostatic pressure, and on the concentration of polymer chain ends or equivalently on the polymer chains length.
The glass transition temperature of an amorphous polymer increases when submitted to hydrostatic pressure [15]. For the lattice model, reducing the size of the lattice for a given polymer, characterized by its number of chains nch and chains length, is equivalent to apply some hydrostatic
pres-sure, the pressure increasing with the contraction of the lattice. Therefore, five polymer chains occupying 10,000 sites each were built in cubic lattices of different sizes N = 60, N = 50 and N = 43. For each lattice, reptation motions were simulated while increasing ratio of locked sites. Figure 8 shows the ratio of visited sites with respect to the ratio of locked sites obtained for each lattice for reptation duration of 107 steps. The ratio of locked sites above which reptation motion becomes impossible is dependent on the size of the lattice. The smaller the lattice is, the lower is the amount of locked sites needed to witness complete frozen reptation motions. Since a lower amount of locked sites can be interpreted as a higher temperature, the lattice model behaves according to experimental data exhibiting higher mobility transition temperature when positive hydrostatic pressure is applied.
The glass transition temperature of amorphous polymers decreases when increasing the concentration of chain ends, which property is described by the well-known Fox-Flory equation [16]. Several lattices defined by N = 50 and fp = 0.4, and containing nch chains varying from one to 100 were built.
Reptation motion simulations were run during 107 steps while increasing the ratio of locked sites in the lattice. The impact of the number of chains on these simulations is shown in Figure 9. The polymer mobility appears to depend on the number of chains present in the lattice. The number of locked sites needed to shut down the molecular mobility increases when the number of chains increases. In the present volume restriction/temperature
0 0.1 0.2 0.3 0.4 0.5 0.6 0.7 0.8
Ratio of locked sites (fl) 0 0.2 0.4 0.6 0.8 1
Ratio of visited unlocked sites
N=43 N=50 N=60
Figure 8: Effect of an applied hydrostatic pressure modeled by volume contraction on the molecular mobility.
equivalence model, the larger the amount of locked sites, the lower the tem-perature. Therefore, the box containing the larger number of chains exhibit the lower mobility transition temperature, which is in good agreement with actual glass transition trend.
4. Conclusion
A Monte Carlo polymer lattice model has been defined to study the im-pact of volume on molecular mobility. The model considered various polymer dynamics such as chain-end, kink jump, crankshaft, pivot and reptation mo-tions. Finally, the polymer mobility was assessed by recording the number of lattice sites visited thanks to reptation motions within a given duration. In order to vary the volume surrounding the polymer chains, some lattice sites were forbidden to the polymer, limiting the volume accessible for its moves. The simulations exhibited a sharp transition of the molecular mobil-ity generated by reptation motions. A threshold of number of locked sites was recognized, below which the mobility is null and above which it sharply increases to full. According to this result, mere volume considerations may be enough to understand a drastic change in the molecular mobility as witnessed during glass transition of amorphous polymers.
0 0.1 0.2 0.3 0.4 0.5 0.6
Ratio of locked sites (fl) 0 0.2 0.4 0.6 0.8 1
Ratio of visited unlocked sites
nch=1 nch=5 nch=25 nch=100
Figure 9: Effect of the concentration of polymer chain ends on the molecular mobility.
A parallel has been drawn between temperature and the number of lattice sites accessible to the polymer chains. The larger the number of accessible sites, the larger the temperature is. This allowed us to compare some of the lattice model behaviors to actual known properties of the amorphous polymers. The model produces molecular mobility shifts with respect to the ratio of locked sites that are in agreement with the glass transition temper-ature shifts observed in amorphous polymers when submitted to hydrostatic pressure or when changing their concentration of chain free-ends.
Bibliography
[1] P.G. De Gennes, Reptation of a polymer chain in presence of fixed ob-stacles, J. Chem. Phys. 55 (1971) 571-572.
[2] J. Baschnagel, K. Binder, Structural aspects of a three-dimensional lat-tice model for the glass transition of polymer melts a Monte Carlo sim-ulation, Physica A 204 (1994) 47-75.
[3] G.B. McKenna, S.C. Glotzer, 40 years of entropy and glass transition: symposium papers, DIANE Publishing, 1997.
[4] C.A. Angell, K.L. Ngai, G.B. McKenna, P.F. McMillan, S.W. Martin, Relaxation in glass forming liquids and amorphous solids, J. Appl. Phys. 88 (2000) 3113-3157.
[5] K. Binder, M. M¨uller, J. Baschngel, Polymer models on the lattice, in: M. Kotelyanskii, D.N. Theodorou (Eds), Simulation methods for polymers, Marcel Dekker, New York, 2004, 125-146.
[6] M. Wolfgardt, J. Baschnagel, K. Binder, Monte-Carlo simulation of 3-dimensional glassy polymer melts: Reptation versus single monomer dynamics, J. Phys. II France 5 (1995) 1035-1052.
[7] K. Binder, Understanding the glass transition and the amorphous state of matter: can computer simulation solve the challenge, Comput. Phys. Comm. 121-122 (1999) 168-175.
[8] E.J. Janse van Rensburg, Monte Carlo methods for the self-avoiding walk, J. Phys. A: Math. Theor. 42 (2009) 323001.
[9] P. Grassberger, Pruned-enriched Rosenbluth method: simulation of θ-polymers of chain length up to 1 000 000, Phys. Rev. E 56 (1997) 3682-3693.
[10] P.H. Verdier, W.H. Stockmeyer, Monte Carlo calculations on the dynam-ics of polymer in dilute solutions, J. Chem. Phys. 36 (1962) 227-235. [11] M.T. Gurler, C.C. Crabb, D.M. Dahlin, J. Kovac, Effect of bead
move-ment rules on the relaxation of cubic lattice models of polymer chains, Macromolecules 16 (1983) 398-403.
[12] N. Madras, A.D. Sokal, The pivot algorithm: a highly efficient Monte Carlo method for the self-avoiding walk, J. Stat. Phys., 50 (1988), 109-186.
[13] J. Baschnagel, J.P. Wittmer, H. Meyer, Monte Carlo simulation of poly-mers: Coarse-grained models in: N. Attig, K. Binder, H. Grubm¨uller, K. Kremer (Eds) Computational soft matter: from synthetic polymers to proteins - Lecture note 2004, 83-140.
[14] MATLAB and Statistics Toolbox Release 2016a, The MathWorks, Inc., Natick, Massachusetts, United States.
[15] U. Bianchi, Pressure dependence of glass transition temperature in poly-mers, Reol. Acta 10 (1971) 213-213.
[16] T.G. Fox, P.J. Flory, Second-order transition temperatures and related properties of polystyrene. I. Influence of molecular weight, J. Appl. Phys. 21 (1950) 581-591.