Université de Montréal
Role of corticospinal influences in post-stroke spasticity
par
Alejandro Hernandez
Institut de génie biomédical, Département de physiologie Faculté de médecine
Mémoire présenté à la Faculté de médecine
en vue de l’obtention du grade de maîtrise ès sciences appliquées en génie biomédical
Juin, 2013
Résumé
Chez les personnes post-AVC (Accident Vasculaire Cérébral), spasticité, faiblesse et toute autre coactivation anormale proviennent de limitations dans la régulation de la gamme des seuils des réflexes d'étirement. Nous avons voulu savoir si les déficits dans les influences corticospinales résiduelles contribuaient à la limitation de la gamme des seuils et au
développement de la spasticité chez les patients post-AVC.
La stimulation magnétique transcranienne (SMT) a été appliquée à un site du cortex moteur où se trouvent les motoneurones agissant sur les fléchisseurs et extenseurs du coude. Des potentiels évoqués moteurs (PEM) ont été enregistrés en position de flexion et d'extension du coude. Afin d'exclure l'influence provenant de l'excitabilité motoneuronale sur l'évaluation des influences corticospinales, les PEM ont été suscités lors de la période silencieuse des signaux électromyographiques (EMG) correspondant à un bref raccourcissement musculaire juste avant l'enclenchement de la SMT.
Chez les sujets contrôles, il y avait un patron réciproque d'influences corticospinales (PEM supérieurs en position d'extension dans les extenseurs et vice-versa pour les
fléchisseurs). Quant à la plupart des sujets post-AVC ayant un niveau clinique élevé de spasticité, la facilitation corticospinale dans les motoneurones des fléchisseurs et extenseurs était supérieure en position de flexion (patron de co-facilitation). Les résultats démontrent que la spasticité est associée à des changements substantiels des influences corticospinales sur les motoneurones des fléchisseurs et des extenseurs du coude.
Abstract
In post-stroke patients, spasticity, weakness and abnormal coactivation result from limitations in the range of regulation of stretch reflex thresholds. We investigated whether the deficits in residual corticospinal influences contribute to the limitation in the regulation of those thresholds and as a result to spasticity in post-stroke subjects.
A single-pulse transcranial magnetic stimulation (TMS) was applied to the site of the motor cortex projecting to motoneurons of elbow flexors and extensors. Responses to TMS (motor evoked potentials or MEPs) were recorded at a flexion and an extension position of the elbow joint. To exclude the influence of background motoneuronal excitability on the evaluation of corticospinal influences, MEPs were elicited during the electromyographic (EMG) silent period produced by brief muscle shortening prior to TMS.
In control subjects, corticospinal facilitation of flexor motoneurons was usually larger whereas that of extensor motoneurons was smaller during actively maintained flexion than when the extension position was maintained (reciprocal pattern of position-related changes in flexor and extensor MEPs). In most post-stroke subjects with high clinical spasticity scores, corticospinal facilitation of both flexor and extensor motoneurons was greater at the actively established flexion position (co-facilitation pattern). Results show that spasticity is associated with substantial changes in the corticospinal influences on flexor and extensor motoneurons. Corticospinal co-facilitation of the two groups of motoneurons may be related to the necessity to overcome resistance of spastic muscles during active changes in the elbow joint angle.
Table of contents
Résumé _________________________________________________________________________ i
Abstract ________________________________________________________________________ ii
Table of contents _________________________________________________________________ iii
List of figures ____________________________________________________________________ vi
List of tables ____________________________________________________________________ x
List of abbreviations _____________________________________________________________ xii
Acknowledgements ______________________________________________________________ xiv
1. INTRODUCTION ________________________________________________________ 1 2. LITERATURE REVIEW ____________________________________________________ 3 2.1 Neurophysiological basis of movement ________________________________________ 3
2.1.1 Stretch reflex ___________________________________________________________________ 3 2.1.2 Cortical projections ______________________________________________________________ 4 2.1.3. Neuronal activation ______________________________________________________________ 6 2.1.4 Persistent inward currents ________________________________________________________ 7
2.2 Spasticity ________________________________________________________________ 8
2.2.1 Definition ______________________________________________________________________ 8 2.2.2 Controversies in the definition of spasticity ___________________________________________ 9 2.2.3 Spasticity measurement _________________________________________________________ 10 2.2.4 MAS reliability _________________________________________________________________ 10 2.2.5 Biomechanical approaches to spasticity measurement _________________________________ 11 2.2.6. Problems with biomechanical measures ____________________________________________ 12
2.3 Motor Control Theories ____________________________________________________ 13
2.3.1 Basic theories _________________________________________________________________ 13 2.3.2 Servo hypothesis _______________________________________________________________ 14 2.3.3 Internal Models ________________________________________________________________ 14
2.4 Equilibrium Point hypothesis _______________________________________________ 17
2.5 Transcranial Magnetic Stimulation (TMS) _____________________________________ 21
2.5.1 A brief chronology of TMS ________________________________________________________ 21 2.5.2 The electromagnetics of TMS _____________________________________________________ 22 2.5.3 TMS Components ______________________________________________________________ 25 2.5.4 Current orientation and coil design ________________________________________________ 25 2.5.5 TMS in functional recovery _______________________________________________________ 26 2.6 Research hypothesis ______________________________________________________ 27 3. METHODOLOGY _______________________________________________________ 29 3.1 Subjects ________________________________________________________________ 29 3.2 Apparatus _______________________________________________________________ 30 3.3 Experimental setup _______________________________________________________ 31 3.4 EMG acquisition __________________________________________________________ 31 3.5 TMS ____________________________________________________________________ 32 3.5.1 Hot spot ______________________________________________________________________ 33 3.5.2 Coil positioning ________________________________________________________________ 33 3.5.3 Motor Threshold _______________________________________________________________ 34 3.6 Experimental procedures __________________________________________________ 35
3.7 Data and statistical analysis ________________________________________________ 36
4. RESULTS _____________________________________________________________ 38 4.1 Healthy subjects __________________________________________________________ 38
4.1.1 Passive motion_________________________________________________________________ 38 4.1.2 Passive motion with TMS and motor perturbations ____________________________________ 39 4.1.3 MEP averages in passive movements _______________________________________________ 40 4.1.4 Voluntary motion ______________________________________________________________ 43 4.1.5 Active motion with TMS and motor perturbations ____________________________________ 44 4.1.6 MEP averages in voluntary movements _____________________________________________ 44 4.1.7 Tonic EMG equalization (torque compensation) ______________________________________ 49
4.2 Post-stroke patients with spasticity __________________________________________ 50
4.2.2 Assessing spasticity zones ________________________________________________________ 51 4.2.3 Passive motion with TMS and motor perturbations ____________________________________ 52 4.2.4 MEP averages in passive movements _______________________________________________ 52 4.2.5 Voluntary movement ___________________________________________________________ 57 4.2.6 Active motion with TMS and motor perturbations ____________________________________ 57 4.2.7 MEP averages in voluntary movements _____________________________________________ 58 4.2.8 Individual analysis of MEPs during voluntary movement ________________________________ 62
4.3 Overview of major findings _________________________________________________ 64
5. DISCUSSION __________________________________________________________ 66 5.1 Hypothesis confirmation ___________________________________________________ 66
5.2 Impact of movement direction on MEPs ______________________________________ 68
5.3 Limitations of the study ____________________________________________________ 68
Conclusion _____________________________________________________________________ 71
List of figures
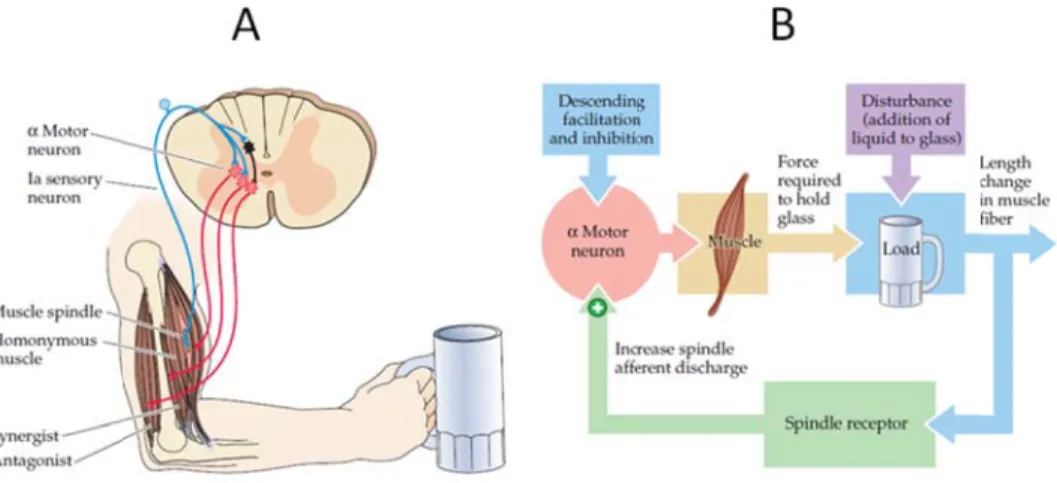
FIG. 2.1 Stretch reflex mechanism. (A) The lines in blue represent the Ia sensory neurons which fire when the muscle spindle is stretched. The lines in red are the α-motoneurons that innervate the muscle, which contracts if Ia firing depolarizes the motoneurons' membrane potentials. (B) Negative feedback loop model of the stretch reflex. Taken from Purves et al., 2004, p.380. ... 4 FIG. 2.2 Motor pathways. Most voluntary movements originate in the primary motor cortex (area 4, in light green) as well as the sensory areas 1, 2 & 3 (in orange). The corticospinal tract is represented by the green lines descending into the spinal cord. Taken from: Kandel et al., 2001, p.671. ... 5 FIG. 2.3 Simplified motor circuit comprising of a motoneuron and a muscle. The diagram depicts the
contributions of the central and afferent inputs (indicated by the arrows) of the neuron's activation. ... 7 FIG. 2.4 A simplified motor system consisting of a controller and a controlled object. (A) Feed-forward control. The controller sends a command C(t) to change the state of the object to match the desired state XDES(t). (B)
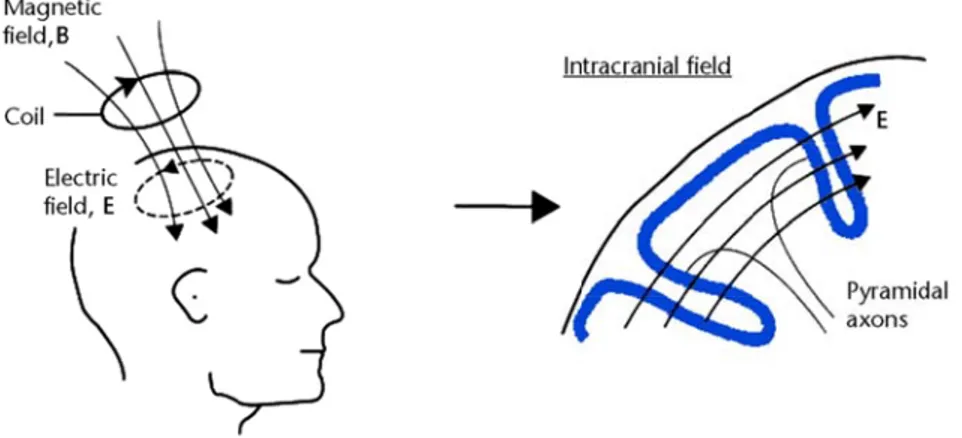
Feedback control. The comparator continuously corrects X(t) via changes in the command ΔC(t). Based on Latash, 2012, p.115. ... 13 FIG. 2.5 Experimental observation showing elbow joint muscle activity returning to pre-movement levels. (A) Responses during slight passive oscillations maintained at initial position (extension). (B) Responses following fast elbow flexion. (C) Responses during passive oscillations maintained at final position (flexion). Taken from: Exp Brain Res (vol. 194, p. 42), AG Feldman, 2009. ... 16 FIG. 2.6 Posture movement paradox. (A) Arm position is stabilized: muscles and reflexes resist changes in position. (B) Intentional change in arm position: muscles and reflexes do not resist intentional changes in position. The nervous system resets the activation threshold of elbow flexor muscles to allow for voluntary movement to a new position. ... 18 FIG. 2.7 Equilibrium-Point model. Voluntary movement corresponds to a central shift of the IC curve (a b, black dots). Natural unloading simply resets the new EP to other points along the curve (white dots). Taken from Medicina (vol. 46, p.384), ML Latash et al., 2010. ... 19 FIG. 2.8 Range of regulation of the elbow joint in patient with spasticity. The biomechanical angle of the joint spans 150°. Range R (light gray area) corresponds to the angular range where reciprocal muscle activation can occur (between flexor and extensor TSRT). Range M (dark grey area) indicates muscle coactivation. The white areas represent either no movement or unidirectional movement zones. Taken from: Top Stroke Rehabil (vol. 16, p.185), A Calota & MF Levin, 2009. ... 20 FIG. 2.9 Transcranial magnetic stimulation. The magnetic field crossing the skull and brainy tissue induces an opposite magnetic field which induces an electric field in the cortex that is reversed in opposite orientation to that of the coil. Taken from Physical Therapy (vol. 87, p.725), AJ Butler & SL Wolf, 2007. ... 24
FIG. 2.10 Simplified TMS source circuitry feeding a single coil. It is the fast capacitor discharge that allows a changing magnetic field to be created. Taken from Malmivuo & Plonsey, 1995, p.376. ... 25
FIG. 3.1 Subject positioning during experiment. Arm rests on horizontal manipulandum pivoting around the axle of the motor. ... 31 FIG. 3.2 A simplified schematic depicting EMG acquisition. The electrodes ferry data to a hub (Telemyo of Noraxon, USA) which redirects them for viewing on an oscilloscope. Arm drawing taken from:
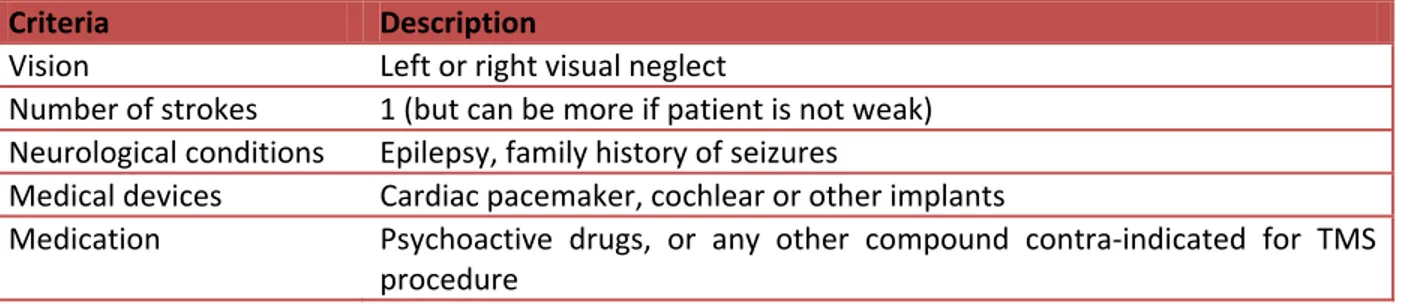
http://backyardbrains.com/experiments/emgspikerbox. ... 32 FIG. 3.3 Double-coned coil used throughout the experiments. The shape made it an ideal fit onto the subject's head and made the positioning of it easier to maintain throughout the experiment. ... 33 FIG. 3.4 Diagram representing the experimental protocol in a chronological order from top to bottom. MP = motor pulses. ... 35
FIG. 4.1 EMG signals taken for a single trial during passive motion of the arm around the elbow joint in a healthy subject (H4). Angular motion is depicted by the upper curve. Flexor muscles (BB, BR) were silent. Extensor muscles (TL, TM) were silent during passive stretching (motion from extension to flexion position, but a small transient EMG activity appeared in extensor muscles during shortening (motion from flexion to extension position). BB = biceps brachii; BR = brachioradialis; TL = triceps lateralis; TM = triceps medialis. ... 38 FIG. 4.2 Typical flexor (BR) EMG responses to TMS before and after passive motion from a flexion to an
extension position of the elbow joint, in healthy subject H7. Small indentations in the motion curve (upper curve) depict muscle shortening pulses. The light blue line represents TMS signal. In the bottom row, segments of MEP signals associated with each of the 2 TMS pulses are zoomed in. MEP amplitudes are similar indicating that corticospinal influences remain unchanged at both positions. ... 39 FIG. 4.3 MEP averages (+s.d.) at flexion (red) and extension (blue) during passive movement of the 7 control subjects. Asterisks denote statistically significant differences in MEPs at both positions. ... 40 FIG. 4.4 BR MEP averages (+s.d.) at flexion (red) and extension (blue) during passive movement in 7 control subjects. Asterisks denote p<0.05 significant differences in MEPs at both positions. ... 41 FIG. 4.5 TL MEP averages (+s.d.) at flexion (red) and extension (blue) during passive movement in 7 control subjects. Asterisks denote p<0.05 significant differences in MEPs at both positions. ... 41 FIG. 4.6 TM MEP averages (+s.d.) at flexion (red) and extension (blue) during passive movement in 7 control subjects. Asterisks denote p<0.05 significant differences in MEPs at both positions. ... 42 FIG. 4.7 Active elbow flexion and extension in a representative healthy subject (H4). Reciprocal pattern of muscle activation: extensors (TL, TM) are active during extension while flexors remain silent; flexors (BB, BR) are active during flexion while one of the extensors (TL) remains tonically active (coactivation). ... 43
FIG. 4.8 Healthy subject (H1) EMG responses of the BB flexor (red) and the TM extensor (dark blue) to TMS before and after active motion from an elbow flexion to an extension position, in two separate trials. The light blue line represents TMS signal. The MEP amplitude is significantly higher at flexion than at extension elbow position for the BB. The opposite pattern is seen for TM. Both responses combine to produce a reciprocal pattern of corticospinal influences. ... 44 FIG. 4.9 BB MEP averages (+s.d.) at flexion (red) and extension (blue) during voluntary movement in 7 control subjects. Asterisks denote p<0.05 significant differences in MEPs at both positions. ... 45 FIG. 4.10 MEP averages (+s.d.) at flexion (red) and extension (blue) during voluntary movement in 7 control subjects. Asterisks denote p<0.05 significant differences in MEPs at both positions. ... 46 FIG. 4.11 TL MEP averages (+s.d.) at flexion (red) and extension (blue) during voluntary movement in 7 control subjects. Asterisks denote p<0.05 significant differences in MEPs at both positions. ... 47 FIG. 4.12 TM MEP averages (+s.d.) at flexion (red) and extension (blue) during voluntary movement in 7 control subjects. Asterisks denote p<0.05 significant differences in MEPs at both positions. ... 48 FIG. 4.13 EMG responses during passive motion of the arm in post-stroke patients (A) The motion curve (black) indicates an EF movement for patient S1 as the extensors stretch (blue), a higher EMG activity appears (TL & TM). This was labeled as the onset of spasticity. (B) For patient S5, movement is in the FE direction. As flexors stretched, the BR response greatly increased; this was marked as the onset of spasticity. Spasticity was less visible in BB. ... 50 FIG. 4.14 Spasticity zones within the angular range of the elbow joint. Reduced R control corresponds to the narrower R- to R+ range of threshold regulation in patients with spasticity. (A) Threshold range of regulation in a healthy person. No spasticity zones present: range R- to R+ is wider than the biomechanical range (θ-, θ+). (B) Spasticity zones (in blue) found in at least in one of two extensors (TL, TM) in 3 post-stroke patients. The lower limit R- is located within the biomechanical range of the joint. The area in yellow represents average threshold angle ± 1 s.d. (C) Spasticity zones (in red) found in the flexors of 4 post-stroke subjects. The upper limit R+ is located within joint angle range. The area in yellow represents average (± s.d.) threshold angle. ... 51 FIG. 4.15 Post-stroke patient S5. Flexor (BB) EMG response to TMS before and after passive motion from a extension to a flexion position of the elbow joint. Small indentations in the motion curve (upper curve) depict muscle shortening pulses. The light blue line represents TMS signal. The segments of signal pertaining to TMS pulses were zoomed in. The MEP amplitude at extension is barely perceptible while the one at flexion is
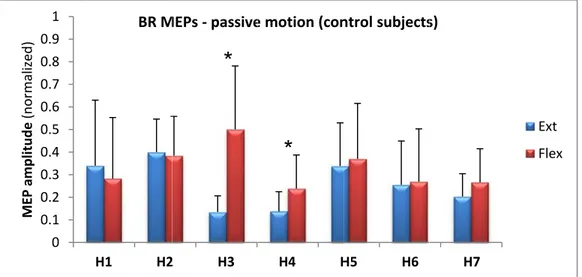
somewhat greater. ... 52 FIG. 4.16 BB MEP averages (+s.d.) at flexion (red) and extension (blue) during passive movement in 6 post-stroke patients. Asterisks denote p<0.05 significant differences in MEPs at both positions. ... 53 FIG. 4.17 BR MEP averages (+s.d.) at flexion (red) and extension (blue) during passive movement in 6 post-stroke patients. Asterisks denote p<0.05 significant differences in MEPs at both positions. ... 54
FIG. 4.18 TL MEP averages (+s.d.) at flexion (red) and extension (blue) during passive movement in 6 post-stroke patients. Asterisks denote p<0.05 significant differences in MEPs at both positions. ... 55 FIG. 4.19 TM MEP averages (+s.d.) at flexion (red) and extension (blue) during passive movement in 6 post-stroke patients. Asterisks denote p<0.05 significant differences in MEPs at both positions. ... 56 FIG. 4.20 EMGs during voluntary movement in a post-stroke patient (S5). The motion curve (black) depicts the FEF direction. At extension, spasticity is inspected in flexors (BB & BR) although all muscles are active; this is the coactivation pattern. At flexion, there is some spasticity in extensors and a high activity in flexors; this forms a coactivation pattern as well. ... 57 FIG. 4.21 Patient (S1) EMG responses of the BB flexor (red) and the TM extensor (dark blue) to TMS before and after active motion from an elbow flexion to an extension position, in two separate trials. The light blue line represents TMS signal. In the case of BB, the MEP is clearly seen at the extension position although it is barely visible at flexion. In the case of TM, the MEP at flexion is clearly greater than the one at extension (barely visible). This patient's TM extensor enters its spasticity zone while the elbow is flexed. ... 58 FIG. 4.22 BB MEP averages (+s.d.) at flexion (red) and extension (blue) during voluntary movement in 5 post-stroke patients (patient S3's data was discarded due to poor EMG acquisition). Asterisks denote p<0.05
significant differences in MEPs at both positions. ... 59 FIG. 4.23 BR MEP averages (+s.d.) at flexion (red) and extension (blue) during voluntary movement in 6 post-stroke patients. Asterisks denote p<0.05 significant differences in MEPs at both positions. ... 60 FIG. 4.24 TL MEP averages (+s.d.) at flexion (red) and extension (blue) during voluntary movement in 6 post-stroke patients. Asterisks denote p<0.05 significant differences in MEPs at both positions. ... 61 FIG. 4.25 TM MEP averages (+s.d.) at flexion (red) and extension (blue) during voluntary movement in 6 post-stroke patients. Asterisks denote p<0.05 significant differences in MEPs at both positions. ... 62
List of tables
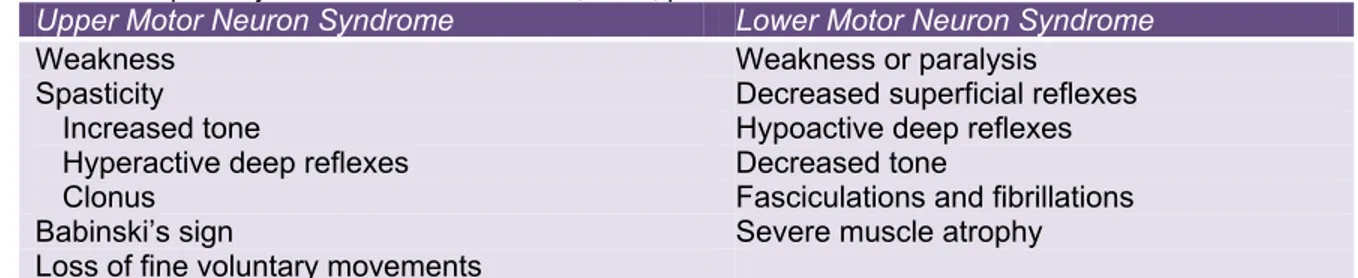
TABLE 2.1 Signs and symptoms of upper and lower motor neuron lesions. Note the several symptoms that can characterize spasticity. Taken from Purves et al., 2004, p.413. ... 6
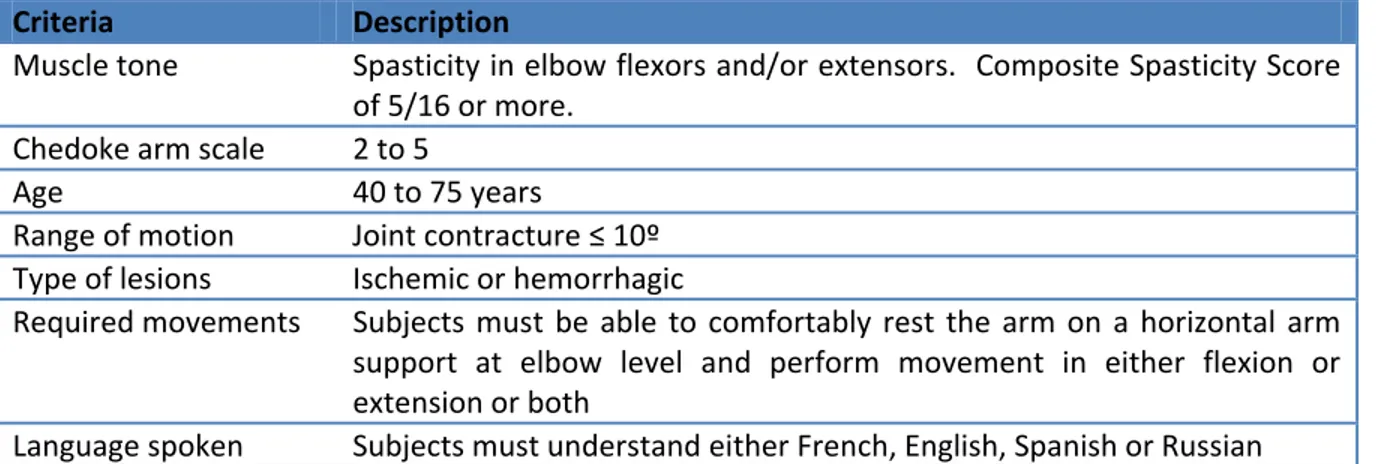
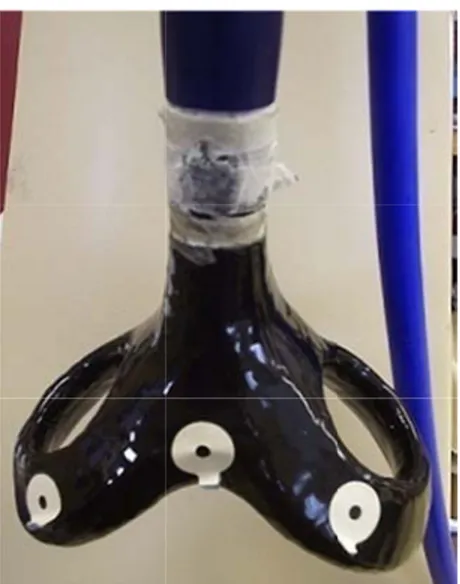
TABLE 3.1 Inclusion criteria for the recruitment of post-stroke patients with spasticity in the upper limb. ... 29 TABLE 3.2 Exclusion criteria for the recruitment of post-stroke patients with spasticity in the upper limb. VAS = visual analog pain scale. ... 30 TABLE 3.3 Demographic and clinical data for hemiparetic subjects. S = subject, M = male, F = female, E = extensors, FX = flexors. Spasticity score based on the Composite Spasticity Index. ... 34
TABLE 4.1 P-values of MEPs in BB, in passive movement. In 5 of 7 control subjects, MEPs in BB were higher at flexion (reciprocal pattern) while no differences were perceived in the other 2. ... 40 TABLE 4.2 P-value of MEPs in BR, in passive movement. In 2 of 7 control subjects, MEPs in BR were higher at flexion (reciprocal pattern) while no differences were perceived in the other 5. ... 41 TABLE 4.3 P-values of MEPs in TL, in passive movement. In 4 of 7 control subjects, MEPs in TL were higher at flexion (inverted pattern) while no differences were perceived in the other 3. ... 42 TABLE 4.4 P-values of MEPs in TM, in passive movement. In 1 of 7 control subjects, MEPs in TM were higher at flexion (inverted pattern) while no differences were perceived in the other 6. ... 42 TABLE 4.5 Average (±s.d.) MEP latencies during passive movement for each control subject. All muscles were included in the average. ... 43 TABLE 4.6 P-values of MEPs in TM, in voluntary movement. In 6 of 7 control subjects, MEPs in BB were higher at flexion (reciprocal pattern). ... 45 TABLE 4.7 P-values of MEPs in BR, in voluntary movement. In 1 of 7 control subjects, MEPs in BR were higher at flexion (reciprocal pattern) while 1 of 7 subjects had higher MEPs at extension (inverted pattern). The inverted pattern was highlighted in boldface in the outcome column. ... 46 TABLE 4.8 P-values of MEPs in TL, in voluntary movement. In 1 of 7 control subjects, MEPs in TL were higher at extension (reciprocal pattern) while 2 of 7 subjects had higher MEPs at flexion (inverted pattern). The inverted pattern was highlighted in boldface in the outcome column. ... 47 TABLE 4.9 P-values of MEPs in TM, in voluntary movement. In 4 of 7 control subjects, MEPs in TM were higher at extension (reciprocal pattern). ... 48 TABLE 4.10 Number of instances of corticospinal facilitation patterns seen in each muscle across all 7 healthy subjects. ... 49 TABLE 4.11 Average (±s.d.) MEP latencies for each control subject during voluntary movement. All muscles were included in the average. ... 49
TABLE 4.12 P-values for MEPs in BB, in passive movement. In 1 of 6 post-stroke patients, MEPs in BB were higher at flexion (reciprocal pattern) while in 1 of 6 MEPs in BB were higher at extension (inverted pattern). .... 53 TABLE 4.13 P-values for MEPs in BR in passive movement. In 1 of 6 post-stroke patients, MEPs in BR were higher at flexion (reciprocal pattern) while in 1 of 6 MEPs in BR were higher at extension (inverted pattern). ... 54 TABLE 4.14 P-values for MEPs in TL in passive movement. In 4 of 6 post-stroke patients, MEPs in TL were higher at extension (reciprocal pattern). ... 55 TABLE 4.15 P-values for MEPs in TM in passive movement. In 1 of 6 post-stroke patients, MEPs in TM were higher at flexion (reciprocal pattern) while in 1 of 6 MEPs in TM were higher at extension (inverted pattern). ... 56 TABLE 4.16 Average (±s.d.) MEP latencies for each post-stroke patient during passive movement. All muscles were included in the average. ... 56 TABLE 4.17 P-values for MEPs in BB in voluntary movement. In 1 of 5 post-stroke patients (patient S3's data was discarded), MEPs in BB were higher at flexion (reciprocal pattern). ... 59 TABLE 4.18 P-values for MEPs in BR in voluntary movement. In 3 of 6 post-stroke patients, MEPs in BR were higher at flexion (reciprocal pattern). ... 60 TABLE 4.19 P-values for MEPs in TL in voluntary movement. In 2 out of 6 patients, MEPs in TL were higher at extension (reciprocal pattern). In 2 out of 6 patients, MEPs were higher at flexion (inverted pattern, shown in boldface). ... 61 TABLE 4.20 P-values for MEPs in TM in voluntary movement. In 2 out of 6 patients, MEPs in TM were higher at extension (reciprocal pattern). In 1 out of 6 patients, MEPs were higher at flexion (inverted pattern, shown in boldface). ... 62 TABLE 4.21 Average (±s.d.) MEP latencies for each post-stroke patient during voluntary movement. All muscles were included in the average. ... 63 TABLE 4.22 Classification of patients’ MEP responses into patterns of corticospinal influences. We note the similarities between S1 and S5; between S3 and S4. S2 and S6 have no particular pattern. ... 64
List of abbreviations
AP Antero-posterior
CNS Central nervous system
CVA Cerebrovascular accident
IC Invariant characteristic
EMF Electromotive force
EP Equilibrium Point (hypothesis)
M1 Motor cortex
MAS Modified Ashworth Scale
MEP Motor evoked potential
MoCA Montreal Cognitive Assessment
MT Motor threshold
PA Postero-anterior
PIC Persistent inward currents
R Range of reciprocal muscle activation
rTMS Repetitive transcranial magnetic stimulation
SII Secondary somatosensory cortex
tDCS Transcranial direct current stimulation
TES Transcranial electric stimulation
TMS Transcranial magnetic stimulation
SR Stretch reflex
TSRT (λ) Tonic stretch reflex threshold
UMN Upper motor neuron
BB Biceps brachii
BR Brachioradialis
TL Triceps lateralis
To my mother,
and to the giants of Ancient Greece, on whose shoulders science stands today.
Acknowledgements
Throughout my time spent as a Master's student at the IRGLM, I have had the opportunity to cross paths with many individuals who have collaborated with me on common projects and enriched my academic experience. I now take the time to pay tribute to those I am indebted to.
First and foremost, I would like to thank my research director, Anatol G. Feldman, for introducing me to the wonderful field of Human Motor Control and for his continued support and source of knowledge in areas of motor control theory, patient evaluation and experimental preparation. His tenacity in pursuing and defending his ideas in the name of science is admirable and a model to emulate.
I also extend my gratitude to my colleagues at the Motor Control lab, namely Dr. Nabil Ilmane, for his patience and support in helping me grasp conceptual models in motor control, as well as for introducing me to TMS basics. Dr. Samir Sangani's expertise in running experiments was equally instrumental early on in my work.
None of the experiments scheduled with post-stroke patients would have been possible without the thorough help of our research team's physiotherapist, Rhona Guberek, who conducted all clinical evaluations.
Professor Mindy Levin also provided great encouragement by allowing me to audit her Motor Control class at McGill University.
Finally, I would like to remember the actions of a great woman, my mother. In moments of self-doubt, her unconditional love, infinite wisdom and unwavering faith in me fuelled me with renewed courage to push forwards. To her, I owe everything in the world.
1. INTRODUCTION
Stroke, or cerebrovascular accident (CVA), is a major public health concern since over 300.000 Canadians are affected by it and are living with its devastating consequences. This is notably the case for frequent impairment of upper limb movements which leads to a loss of functional independence. This is why a major issue in stroke rehabilitation is in determining which strategies are most effective in optimizing recovery of arm function.
Spasticity, characterized by abnormal muscle activity, is a common occurrence in individuals with neurologic disorders such as spinal cord injury, multiple sclerosis, traumatic brain injury, stroke, and in children with cerebral palsy. Following a lesion to the motor cortex after CVA, spasticity can set in and cause motor impairments. Its onset is unpredictable but usually occurs within the first year post-stroke. At the outset it can translate, to varying degrees, to an inability to control limb movements. This can considerably interfere with a person's ability to conduct normal day-to-day activities, especially if it is accompanied with considerable pain.
Spasticity can manifest itself as an over-activation of a particular set of muscles. It is a common sign of the upper motor neuron (UMN) syndrome. UMNs refer to neurons that originate in the motor cortex and end in the spinal cord, where they synapse with lower motor neurons (LMN) that innervate muscles. Damage to UMN disrupts normal functioning of spinal reflex arcs controlling muscle tone resulting in tight, stiff muscles often producing jerky movements.
The incidence of spasticity following first stroke is approximately 20% and it causes a four-fold increase in direct costs in care as compared to stroke survivors without it. In addition, work productivity in patients with spasticity is reduced up to 89%. Mitigating these extra costs and the physical and emotional well-being of patients constitute strong reasons for refining our understanding of the origins of spasticity, in the hope of improving current available treatments.
The aim of our present study is to attempt to explain how the motor cortex influences arm movements in individuals who have developed spasticity in the arm after a stroke. The
time of spasticity onset is of no particular importance as long as it corresponds to the typical delays varying from weeks to a full year post-stroke. We seek to outline whether there are any differences in the cortex modulation of movement in healthy and post-stroke individuals and to discover any underlying mechanisms that offer an explanation to such differences.
To provide a context to our study's objectives, we shall first present a neurophysiological basis of movement in healthy individuals before discussing spasticity in more detail. Current motor control theories as well as the method of transcranial magnetic stimulation (TMS) of the motor cortex will be reviewed. The literature review will be followed by a chapter on the methods used to prepare the experiments designed to study corticospinal influences on the movement of the arm. The next chapter outlines the results obtained from the experiments, by measuring muscle activity in voluntary and passive movements. The last chapter provides a discussion to summarize the results found and to confirm our main hypothesis. Finally, a conclusion outlines our findings along with its implications in the clinical realm.
2. LITERATURE
REVIEW
2.1 Neurophysiological basis of movement
Muscles are at the foundation of all movements. Commands issued from the motor cortex or spinal cord are transmitted to α-motoneurons, which relay electrical impulses to muscles that respond by a contraction the intensity of which depends on the frequency of the impulses and the number of activated α-motoneurons.
2.1.1 Stretch reflex
The muscle spindle is the centerpiece of proper functioning of the stretch reflex (SR). The spindle is a sensory receptor embedded in each muscle, composed of 8-10 intrafusal fibres structured in parallel with muscle contractile (extrafusal) fibres. When muscle fibres are stretched, the spindle stretches along with them and excites afferent nerves mediating rapid reflex adjustments of muscle activity (Figure 2.1). Its ability to track changes in muscle length allow group Ia sensory afferents to increase their activity, directly affecting motoneuronal and hence muscular activity. The spindle is innervated by gamma motor neurons, small diameter myelinated motor endings that connect onto the polar ends of intrafusal fibers. The activation of gamma motor neurons leads to an increase in firing rate of the sensory endings, translating into a greater likelihood that the stretch of a muscle causes sensory afferents to fire. The stretch reflex therefore acts to resist muscle lengthening by contracting the agonist muscle and simultaneously inhibiting the antagonist muscles via Ia inhibitory interneurons. It has been empirically confirmed that the reflex pathway is monosynaptic since the latency between the afferent volley and excitatory post-synaptic potential in the motor neuron is practically equal to the duration of signal transmission across a single synapse (Kandel, 2000).
FIG. 2.1 muscle sp firing dep Taken fro I spindle motoneu contract consists active c feedbac further motoneu of spast
2.1.2 C
T several found in directly motor a movem the mot Stretch reflex pindle is stretc polarizes the m om Purves et a In engineeri stretches, I urons that in tion (Kandel s in adjusting contraction, ck loop activ changes in urons was li ticity, it is alCortical p
The cell bo brainstem c n the motor y affecting th action may ent. One pat tor cortex, cmechanism. hed. The lines otoneurons' m l., 2004, p.380 ing terms, th Ia afferents nnervate hom l, 2000). Th g the sensitiv the γ moto ve. Without length (Hu inked to spa so worthy to
projections
dies of UM centers such cortex in par he activity o take one thway consi conducts im(A) The lines in red are the embrane poten . he stretch ar increase th monymous he spindle is vity of the m oneurons allo some degree unt, 1951). I asticity. Wh o look at the
s
MNs (Upper as the supe rticular, are of local circ of several sts of a dire mpulses down in blue represe α-motoneurons ntials. (B) Neg rc reflex acts heir firing r and synergi s innervated muscle spind ow the spin e of tension, It was prev ile this hypepotential co Motor Neu erior collicul known to in cuits in the routes to a ect cortical p n the cortico
ent the Ia sens s that innervate gative feedback s as a negat rate, the ex st muscles a d by γ motor dle to muscle ndle to be u , the spindle viously thoug eractivity ma ontribution fr urons) are pr lus and the nfluence the brainstem a accomplish projection: m ospinal tract sory neurons w e the muscle, w k loop model o tive feedbac xcitatory con are provoke r neurons, th e length cha under tensio would not b ght that hyp ay be presen from the high
resent in th reticular for generation o and spinal c the task of motor planni t to the spin
which fire when which contracts of the stretch re k loop. Whe nnections to d into a mu he role of wh nges. During on and keep be able to sig peractivity o nt in some c her centers. e cortex and rmation. Th of movemen ord. A des f creating l ing originate nal cord, wh n the s if Ia eflex. en a o α- uscle hich g an the gnal of γ ases d in hose nt by sired limb es in here
UMNs ferry the Another combin ending a F muscles decreas centers. recovery FIG. 2.2 as well a descendi connect via e signal tow r pathway, ation of cor at the spinal Following a s ensues. Sp ed activity Several day y appear nov Motor pathway as the sensory
ng into the spin
local circuit wards the targ an indirect rticospinal a cord (Figur an UMN inj pinal shock, in spinal cir ys later, the vel motor sig
ys. Most volun y areas 1, 2 & nal cord. Taken
ts to the LM geted muscle cortical pro and reticulos re 2.2). jury, a brief named in r rcuits which e spinal cord gns and sym tary movemen & 3 (in orange n from: Kandel MNs (Lower es responsibl ojection, em spinal tracts f period of reference to h are sudden d circuits re mptoms (Tabl ts originate in e). The cortico et al., 2001, p Motor Neur le for genera mploys the c starting at very low m this period, nly deprived gain their fu le 2.1). the primary mo ospinal tract is .671. rons or α-mo ating the des corticoreticul the reticular muscle tone sets in and d of input f function, but
otor cortex (are s represented otoneurons) sired movem lospinal trac r formation in the affe is marked b from the hig t along with ea 4, in light gr by the green that ment. ct, a and cted by a gher h the reen) lines
TABLE 2.1 Signs and symptoms of upper and lower motor neuron lesions. Note the several symptoms that can
characterize spasticity. Taken from Purves et al., 2004, p.413.
Upper Motor Neuron Syndrome Lower Motor Neuron Syndrome
Weakness Weakness or paralysis
Spasticity Increased tone
Hyperactive deep reflexes Clonus
Decreased superficial reflexes Hypoactive deep reflexes Decreased tone
Fasciculations and fibrillations Babinski’s sign Severe muscle atrophy Loss of fine voluntary movements
Abnormal corticospinal transmission could be suspected in cases of UMN damage. A study found that reciprocal inhibition is diminished or absent in patients with spasticity (Crone, 2004). To sum up, cortical projections translate a desired movement into a series of impulses travelling to the spinal cord. We now turn our attention to how such impulses influence alpha motor neurons.
2.1.3. Neuronal activation
Neurons are essentially threshold elements with non-linear characteristics (Latash, 2012). Changes in the input are not necessarily translated into output changes. The generation of action potentials as a result of cell membrane depolarization obeys the all-or-none law: they either occur or they do not at all. An action potential only appears when the input reaches a certain minimum in stimulus; if below this threshold, nothing is generated. Above threshold, an action potential emerges and its amplitude remains the same irrespective of input stimulus. However, if the input remains above threshold, both the frequency of spikes and motoneuronal recruitment increase with increasing input.
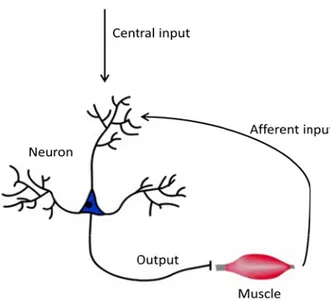
Subthreshold depolarization is the change in the value of the current membrane potential with respect to the membrane’s threshold potential. In a simplified model (Figure 2.3), an afferent input from the muscle and a central input from the motor cortex may constitute all sources of inputs. The contribution of the central input alone may be sufficient to generate an action potential. In other instances, it may need the contribution of the afferent input to provoke membrane depolarization (Latash, 2012). Other studies managed to quantify the difference between the increased excitability of the corticospinal tract and the already present activity of motoneurons resulting from its proprioceptive influences (Todd, 2003).
FIG. 2.3 of the cen
2.1.4 P
P motoneu sensitiv looping maintain resultin especial (Heckm A reflexes Hyperac bulbosp pathway excitabi tendon several the pres Simplified mot ntral and afferePersistent
Persistent in uron dendrit ve channels t g effect of t ned until an g muscle ac lly in sustain man, 2005). An importan s in paretic ctive stretch pinal pathwa ys would pr ility or by re vibration (th seconds afte sence of PItor circuit comp ent inputs (indic
t inward c
nward currentes that can that cannot the phenome n inhibitory ctivation is ning long-la nt study (M post-stroke h reflexes m ays followin rovide more educing their he tonic vib er the termin Cs and aug prising of a mo cated by the ar
urrents
nts (PICs) ar depolarize a deactivate d enon. Abov input termin not necessa asting muscl McPherson, 2 patients an may result ng stroke-in e powerful c r subthresho ration reflex nation of vib gmented join toneuron and a rows) of the ne re sustained p a cell’s mem despite a lac e-threshold nates moton arily undesir e contractio 2008) provid nd the devel from an in nduced loss control of m old depolariz x) eliciting s bration. The nt torque an a muscle. The euron's activati positive curr mbrane. The ck of input; voltage in neuronal firi rable; it may on, as for insdes a link b lopment of ncreased re ses of corti motoneurons zation level. sustained fir e response sh nd EMG lev diagram depic on. rrents primar ey are produ this explain the cell me ing. The to y actually b stance durin between hyp persistent in liance on m cospinal pr , either by PICs may ring of moto hows a corr vels of a pa cts the contribu rily generate uced by volta ns the persist embrane can onic state of be of great ng postural ta peractive str nward curre monoaminer ojections. S increasing t be increased oneurons du relation betw aretic limb w utions ed in age-tent, n be f the use, asks retch ents. rgic-Such their d by uring ween with
respect to a non-paretic limb. PICs may possibly be implicated in spasticity, as the increased tone in the affected limbs seems to go hand in hand with PIC presence.
2.2 Spasticity
2.2.1 Definition
The most widely quoted and accepted definition of spasticity to this day, states that it is a “motor disorder characterized by a velocity-dependent increase in tonic stretch reflexes with exaggerated tendon jerks resulting from hyper excitability of the stretch reflexes, as one component of the upper motoneuron syndrome” (Lance, 1980). According to this definition, increased excitability of stretch reflexes is responsible for spasticity. Tonic stretch reflexes constitute a normal mechanism in the nervous system; the phenomenon is well identified in postural reflexes in the leg muscles that allow a person to sustain a balanced position while standing for long periods of time. Spasticity is also velocity-dependent. A slow stretch of the muscle in a relaxed state does not evoke a reflex in a healthy individual; a very high speed is needed to achieve this end (via a quick tendon tap).
Understanding spasticity is a challenging task, both for clinician and patient, as it is a complex, multi-faceted phenomenon involving different neural structures, varying between individuals (Bhimani, 2012; Grimm, 1983). There exists a large difference in how spasticity management is approached between clinicians and patients. On one hand, clinicians run through a standardized protocol to assess spasticity in a one size-fits-all approach. On the other hand, patients resort to a myriad of strategies to cope with the varied manifestations of their sensory experiences (Mahoney, 2007).
While spasticity can be alleviated through regular physiotherapy and medication (Baclofen being among the interventions), its symptoms never truly disappear. Also, spasticity can vary over time. It may manifest itself more strongly in the morning, when the prolonged inactivity of the body following sleep leads to tighter muscles. Changes in temperature, especially towards colder environments, seem to worsen spasticity. Stress can exacerbate spasticity as well. Such considerations are taken into account by patients in order to minimize the negative consequences of spasticity and optimize their ability to perform
activities of daily living. At the clinical level, treatment should be tailored to the individual’s needs, by addressing the symptoms on a case by case basis, rather than through a group approach. The realities of clinical settings, as they stand today, may however be insufficient to meet this challenge, unless a restructuring of clinical practice takes place.
2.2.2 Controversies in the definition of spasticity
Lance’s definition of spasticity has two aspects. First, spasticity is associated with an enhanced tonic stretch reflex. Second, spasticity is velocity-dependent and the use of several speeds of muscle stretches is needed to correctly assess the degree of spasticity. Spasticity is likely associated with disorders in the control of voluntary movements (Calota, 2009). Few studies have tackled the connection between spasticity and voluntary movement deficits. Instead, the emphasis had primarily been put in characterizing spasticity in terms of biomechanical variables, which are most likely consequences, not causes of spasticity. Muscle contractures are the oft-cited consequence of spasticity, although it has been claimed that the reverse is also true (O'Dwyer, 1996). These are characterized by a shortening of muscle fiber length, causing a rearrangement of muscle-joint interaction (Gracies, 2001). This can also include changes in the properties of soft tissues such as ligaments and tendons in the joint.
Recently, spasticity was defines as “a disordered sensor-motor control, resulting from an upper motor neuron lesion, presenting as intermittent or sustained involuntary activation of muscles” (Pandyan, 2005). The apparent lack of a consensual definition confirms the notion that spasticity is not a single phenomenon; there are several possible manifestations of post-stroke spasticity. An interpretation of the definition of spasticity may focus on the alterations in the central processing of sensory inputs as being the likely causes of its generation; much less attention is directed to the structural changes in the muscles such as contractures. Prime focus is aimed at the study of imbalances of inhibitory and excitatory impulses that lead to motor disorders such as spasticity (Ward, 2011). However, it is important to introduce at this point the current methods of measuring spasticity before establishing which one we have adopted in our study.
2.2.3 Spasticity measurement
Tools used to measure the severity of spasticity, such as the Ashworth or Modified Ashworth Scale (MAS) which assesses the level of muscle tone, have their utility in the clinical world but are insufficient in determining the correct diagnosis among clinical signs such as spasticity, dystonia, clonus, spasms, hyperreflexia, and other muscle tone disorders. Spasticity is not simply characterized by the changes in passive muscle properties; these are usually consequences of spasticity which may in turn contribute towards its worsening. Consequently, contractures in the affected joint may greatly impact spasticity but they could not serve as a basis for establishing its neurologic origin. A neuronal contribution brought on by the hyper-excitability of group II pathways, a distinct group of sensory fibers that act as stretch receptors in the muscle spindle, may be at the root of the neurologic origin of spasticity (Pizzi, 2005).
2.2.4 MAS reliability
It can thus be difficult to distinguish between what may seem as an increased hypertonia due to passive muscular changes or active reflex mediated changes. It was demonstrated that a correlation exists between a high MAS score and the time following the onset of stroke (Pizzi, 2005). That is, the longer time elapsed from the date of stroke, the higher the MAS score, confirming the idea that spasticity develops in time, indicating its adaptive process. Additionally, a positive correlation was found between MAS score and the Hmax/Mmax ratio, which measures the proportion of motoneurons activated by eliciting a muscle reflex following electrical stimulation of Ia afferent fibers (H-reflex) compared with those activated directly (M-wave). The finding shows an eased excitability of the H-reflex in patients with spasticity, possibly due to a decreased inhibitory control of lower motoneurons or to an increased excitability of the stretch reflex (Pizzi, 2005). Another major finding concluded that contractures can provoke spasticity generation; a correction in contractures can potentially reduce the occurrence of spasticity.
According to a neurophysiological approach, which measures EMG muscle activity, 87% of a sample of 100 post-stroke patients (average onset time 3 weeks) were found to have spasticity-like symptoms. Surprisingly, the clinical approach using the MAS considered that
only 44% of the sample had spasticity. The large difference in the diagnosis of spasticity between the two approaches causes confusion as to which of the two is most likely correct. On the other hand, among those deemed to be non-spastic by the MAS, 79% showed involuntary muscle activity, a definite marker of spasticity (Malhotra, 2008). However, an increase in activity does not necessarily produce a consistent change in muscle tone.
Overall, the lack of concordance between existing definitions and what is seen in clinical practice is an issue that remains unresolved and demands a convergence of the many interpretations of spasticity into a more universal diagnosis. A review of several studies evaluating the effectiveness of the MAS in the measure of spasticity shows it is insufficiently reliable or valid as a measure (Pandyan, 1999). This is why the direct measure of muscle activity via EMG may remain for now the best approach for discerning spasticity. Nevertheless, the emotional state and awareness of the post-stroke candidate under study is rarely taken into account when assessing spasticity, factors that may well under or overemphasize its presence (Bhimani, 2012).
2.2.5 Biomechanical approaches to spasticity measurement
Lance's definition emphasizes passive motion as a method to produce and observe the enhanced stretch reflexes incurred in people with spasticity. The accrued motor responses are mediated by afferent fibres and uninhibited reflexes (Wood, 2005). In clinical practice however, spasticity is interpreted as the resulting motor behavior, as a collection of motor program disturbances. It becomes challenging to develop appropriate measures of spasticity as its interpretation changes depending on the clinical setting. The common thread to all interpretations is that it consists in the resistance of muscle to stretching. Existing biomechanical methods of spasticity measurement are generally divided as: manual, controlled displacement, tendon tap and voluntary methods.
The manual method is based on the passive rotation (performed by a clinician) of a limb around its joint in order to elicit tonic stretch reflexes. Although the method is effective in providing a muscular response, it is not very robust; neither speed nor amplitude of motion can be standardized.
The controlled displacement method solves this shortcoming, through the use of a servo-controlled motor to drive joint movement. Repeatable movement is guaranteed and
combines with EMG recording to determine the onset of hyperactivity. The one disadvantage lies in the complexity of the setup, which may be too impractical and unfeasible to carry out in a clinical environment.
The tendon tap method more readily elicits tendon jerks in people with spasticity, which provides a means to quantify the magnitude of the phenomenon (Vattanasilp, 1999). Since duration of the stretch is very short, it only elicits phasic reflexes. The advantage of the method avoids the confusion over neural and/or mechanical contributions to spasticity. The drawback is that it cannot account for abnormal muscle activation in voluntary movement. It remains useful nonetheless as a diagnostic tool.
The voluntary method attempts to elicit thresholds while the limb is actively moved by the patient, reflecting behavior in functional tasks. The approach is often used in a controlled displacement setting which also tracks the EMG responses.
2.2.6. Problems with biomechanical measures
Many factors require corrections in the interpretations of spasticity that currently exist. The use of confusing terminology can lead to a misunderstanding of what does or does not constitute spasticity. A distinction between neural and non-neural components should also be clearly outlined. Consistent protocols should be established for clinical measurement and procuring aged-matched controls is a must to ensure the credibility of the findings. To sum up, biomechanical approaches alone are insufficient in accurately assessing spasticity; these ought to be complemented with EMG recordings to determine the onset of increased muscular activity to passive stretch (Wood, 2005).
Several studies (Powers, 1988; Jobin, 2000) basing their analyses on several angular speed landmarks enabled clinicians to determine the stretch reflex threshold when the spastic limb is at rest, through the computation of a linear regression of the sampled stretch reflex thresholds at the different velocities used. Although this technique for evaluating spasticity has been proven effective in the clinical realm, a neurologic measure would provide insights into how and why spasticity occurs. A neurologic measure should also be supported by a conceptual model that attempts to explain how movements are mediated by the corticospinal tract. The following motor theories attempt to provide a basis for the origin of body movements and its associated deficits.
2.3 M
2.3.1 B
C control controll divided integral A feedbac expedie needed formula state of whose r FIG. 2.4 The cont Feedback Latash, 2Motor C
Basic theo
Central amo variables. ler which resin two gro l mechanism
A feed-forw ck loop, on t ent than one
to conduct ation to origi f the controll role is to atte A simplified m roller sends a k control. The 2012, p.115.
ontrol T
ories
ong some of These repr sends the co oups: feed-f ms used by th ward system the other ha e with feedb the impulse inate in the led object, X empt to matc motor system c command C(t comparator cheories
f the leading resent speci ommand to a forward and he CNS to co m takes the f and, is depic back. No lo s destined to motor plann XDES(t). A c ch the resulti consisting of a ) to change th continuously c motor contr fic tasks se an object. Th d feedback ontrol movem form as sho cted on the oops are preo the contro ning centers command is ing outcome controller and he state of the orrects X(t) vi rol theories ent out by t his descendi control mec ment. own in the right. A fe esent in suc olled object. of the brain s then genera e X(t) to the d a controlled o object to mat ia changes in
are the noti the CNS, in ing pattern c chanisms. left of Figu eed-forward ch a system, Both mod n, which spe ated by the desired valu object. (A) Fe ch the desired the command ons of state nterpreted b can be gener Both types ure 2.4 whi system is m , less routin dels assume ecifies a des controller, C ue. eed-forward co d state XDES(t). d ∆C(t). Base and by a rally are ile a more ng is task sired C(t), ntrol. (B) d on
The feedback mechanism adds an extra element which compares final outcome to desired state. The difference results in a modification of the controller’s command by introducing a correction ΔC(t). The feedback loop will iterate until X(t) ≈XDES(t). If the speed
of a task is vital, a feed-forward control model is preferred (e.g. catching a ball thrown at high velocity). If accuracy is prized over timeliness, feedback control provides the best result (e.g. pianist's rearrangement of fine finger movements).
2.3.2 Servo hypothesis
Introduced by Merton in the1950’s, the servo-hypothesis model combines feed-forward and feedback control loops. Theoretically, only the smallest of errors would emerge and instantly be corrected in such system. Merton believed that voluntary muscle activation was mediated by descending commands to γ-motoneurons that changed the sensitivity of muscle spindles to muscle length. The hypothesis, however, suffers from a major shortcoming. Conduction velocities of γ-motoneurons are quite slow, meaning that a stretch reflex may take in the hundreds of milliseconds to complete in the servo model, contrary to what was measured in experimentation. It was later confirmed that α and γ motoneuronal activity happened simultaneously in a phenomenon called α-γ coactivation. The model was swiftly disqualified as a viable model for motor control (Latash, 2012).
2.3.3 Internal Models
Internal models are theoretical constructs, adopted extensively throughout the scientific community as viable mechanisms that help explain the production of motor actions, especially in what concerns planned voluntary movements. In essence, they are viewed as neural mechanisms that can mimic the input and output characteristics of the motor apparatus (Kawato, 1999). This concept originated from the fields of control theory and robotics, which eventually led to two ideas that have become prominent in the computational modeling of motor control: forward internal models and inverse dynamics.
2.3.3.1 Forward models
Although feedback models would provide good accuracy in motor output, the long delays incurred in the biological feedback loop would make any movement impractically
slow. Forward internal models can be compared to fast-time simulators able to anticipate sensory consequences of control actions and make the necessary adjustments to achieve the desired trajectory. Feed-forward models generate variables in a predictive manner. Errors between predicted and desired trajectories can be used to update the model to reduce the error gap. This is the mechanism believed to enable motor learning (Jordan, 1992). Acquiring internal models through learning may seem tedious but it is proposed that a forward model in conjunction with inverse dynamics and feedback control may allow an adaptation by generating motor commands based on desired states of motor output (Wolpert, 2000).
2.3.3.2 Inverse models
Internal models assume that the brain is equipped with an inverse dynamics model which computes values of torque based on kinematics to control a desired object (e.g. the hand). A feed-forward approach takes over following motor learning. In an inverse dynamics model, the system uses an internal representation of dynamical equations of motion which can interpret the body’s interaction with the environment. A desired movement is first planned in terms of spatial coordinates. In order to carry out this planned motion, the kinematic coordinates are transformed, via the dynamical equations of motion, into the necessary joint torques to perform movement (Hollerbach, 1982).
It is thought that the brain does not memorize the association between movement instances and motor commands. The brain relies instead on an internal memory of the motor apparatus and of the environment, taking the form of an inverse dynamics model extrapolating motor command values via a functional map from the state-space input point (Kawato, 1999). Internal models are thought to be located in all areas of the brain having synaptic plasticity, but there seems to be a consensus that they are stored in the cerebellum (Doya, 1999). It is claimed that certain patterns in cerebellar Purkinje cell activity, with spike-firing patterns seen in reflex eye movement, could be reconstructed from the equations of motion pertaining to the eye (Kawano, 1996). This led to the conclusion that the cerebellum is a possible site of forward models of the limbs and other brain regions (Kawato, 1999). Although the firing frequency of Purkinje cells can be related to eye position and speed of motion, there is no solid evidence that this activity can be expressed as a function of kinematics.
2.3.3.3 F F the add force le create v with its thirty ye H signal le moved t activity its final EMG si FIG. 2.5 Response fast elbow Exp Brain Force contr Force contro ed notion of evels, calcula voluntary mo s suggestion ears ago (Ho However, m evels are res to a new po
during moti position (Su ignals are res
Experimental es during sligh w flexion. (C) n Res (vol. 194 rol hypothes ol hypothesis f a central sp ated via inve ovements (m that forces ollerbach, 19 many studies sponsible for sition, the E ion but quic uzuki, 2001) sponsible fo l observation s ht passive osc Responses d 4, p. 42), AG Fe sis s is a combin pecification erse dynamic mainly throu are naturall 982). have exper r the specifi EMG respons ckly resettled ), as seen in r the specifi showing elbow illations mainta uring passive eldman, 2009. nation of for of forces. cs, following ugh forward ly encoded a rimentally ob cation of lim ses of the ar d back to the Figure 2.5. cation of arm w joint muscle ained at initial oscillations ma rward and in It espouses g which pre internal mo as EMG sig bserved that mb position. rms muscles eir initial lev This indica m position. activity returni position (exte aintained at fin nverse intern the view th edictive cont odels). This gnals, was fo t variables o When arm showed a sl vel once the ates that vari
ing to pre-mov nsion). (B) Re nal position (fle
nal models, w hat the CNS trol mechani s concept, al ormulated so other than E m movement light increas arm rested iables other t vement levels. esponses follo exion). Taken f with sets isms long ome EMG was se in into than (A) owing from:
2.3.3.4 The posture-movement paradox
Exposed by Von Holst and Mittelstaedt in 1950, it uncovered a problem concerning two elements seemingly at odds with one another: postural maintenance and the production of intentional movements. Powerful neuromuscular mechanisms, known as posture reflexes or posture-stabilizing structures, generate the necessary forces to resist or counter perturbations that create an imbalance in the body. Any perturbation deflecting the body's initial position is swiftly brought back through those mechanisms, ensuring the system's equilibrium. Within such a framework, how may volitional movements ever be achieved by displacing the body without triggering this resistance? The dilemma captures the posture-movement paradox.
It was initially thought that the problem could be resolved if the resistive reflexes were suppressed by the CNS at the moment the body segment deviated from its initial position, but this was disproved through experimental observation. The force control model fails to address the paradox, as the generation of forces and motion would provoke resistive postural mechanisms, requiring additional force to counteract the resistance and maintain the new position. In its attempt to integrate muscle mechanical properties into its model, the force control hypothesis cannot rise to meet the challenge posed by the posture-movement paradox without making the human motor system appear inefficient in its production of voluntary movement (Ostry, 2003).
2.4 Equilibrium Point hypothesis
2.4.1 Lambda model
The Equilibrium-Point (EP) hypothesis solves the posture-movement problem by resetting the activation thresholds of motoneurons as the limb is actively moved. By resetting the activation threshold of a muscle at rest, its motoneurons are excited at levels above threshold. This causes the muscle to contract and provoke a movement of the limb to a new position. The limb relaxes into the new position when the length of the muscle corresponds to the new activation threshold. The state of motoneurons is reset to sub-threshold, and minimal muscle activity is restored. The near-zero EMG levels of muscles at rest following voluntary movement in different positions is clearly shown in experimentation (Feldman, 2009).
E reached threshol position become FIG. 2.6 position. The nerv new posit E Asatrya reflex t variable account of tonic T function relation threshol indicate curve t potentia EP theory re d. Viewed fr lds allows th n. The pos e the driving Posture mov (B) Intentional ous system res tion. EP theory, o an and Feldm thresholds t es for the a ted for, as fa c stretch refle The EP hyp n of force v nship betwee ld (λ). Upw e that a musc o the left o als in moton ests on the id from the pos
he system to stural mecha force of vol
vement parado change in arm sets the activa
otherwise kn man (1965). hat are mo ctivation of acilitation or ex threshold pothesis state ersus muscl en muscle fo wards or dow cle is being or right ind neurons (Fe
dea that mus ture-movem o view the i anisms that luntary motio
ox. (A) Arm po m position: mus ation threshold nown as the It provides a dulated by f neuronal p inhibition o s (Latash, 20 es that any g le length. A orce and len wnwards disp subjected to dicates a res ldman & O cle activity c ment paradox initial positi normally o on once the osition is stabi scles and reflex of elbow flexo λ-model, w an elegant ra the CNS. pools. Volu of muscles is 010). given muscl An invariant ngth, for a g placements o o loading or setting of λ Orlovsky, 19 can be reset x perspective on as a dev oppose devi new position ilized: muscles xes do not resi or muscles to a was introduce ationalizatio The CNS untary and i s achieved th le can reach characterist given value of the equilib unloading m λ, achieved 972). A shi whenever a e, the resetti viation from iations from n is specified s and reflexes st intentional c allow for volunt
ed nearly fif on for the ch controls ce involuntary hrough the C h a state of e tic (IC) curv e of the toni brium point mechanisms via change ift of the cu a new positio ng of activa the future f m initial pos d (Figure 2.6 s resist change changes in pos tary movement
fty years ago hanges in str ertain thresh movements CNS's regula equilibrium ve describes ic stretch re along the cu . A shift of s in membr urve to the on is ation final sture 6). es in sition. t to a o by retch hold are ation as a s the eflex urve f the rane left
translate angle of length, tract's r theory. N activity Intentio turn into FIG. 2.7 dots). Na Medicina T the extr range. an R ran threshol range of 2.4.1.1 S T healthy es into flexo f the joint) t the curve sh role as the r No direct co simply eme onal motor ac o changes λ. Equilibrium-Po atural unloadin (vol. 46, p.384 The R param reme limits) The R range nge exceed p ld that can f the biomec Spasticity a The EP mo individuals, or muscle a than its actua
hifts to the r egulator of
omputation o erges as the ctions are pe
oint model. Vol g simply reset 4), ML Latash e meter refers . This spec e is essentia physiologica ensure a ful chanical join and EP theo
odel not onl , it can also i activation, as al length (Fi right, indica the range o of mechanic e difference erformed thr untary movem ts the new EP et al., 2010. to the angul trum is larg ally conceptu al boundarie ll relaxation nt. ry y serves to interpret mo s λ is set by igure 2.7). C ating a relaxa f stretch ref al variables between ac rough descen ent correspond P to other poin ar range of r ger than the
ual, rather th s of the join n or contract explain ho ovement defi y the CNS t Conversely, ation of the flex threshol is assumed ctual and thr nding electro ds to a central nts along the c regulation (w one describi han of physi nt, the CNS i tion of a mu ow voluntary icits. Studie to shorter fl if λ is set to muscle. Th lds is the fo in the EP m reshold body ochemical in shift of the IC curve (white ci with R- and ing the biom iological nat is able to set uscle throug y movemen es among the lexor length o a longer fle he corticosp oundation of model. Musc y configurat nfluences wh curve (a b, b ircles). Taken R+ constitu mechanical j ture. By hav t a stretch re ghout the wh nt is initiated e ones endor h (or exor pinal f EP cular tion. hich black from uting joint ving eflex hole d in sing