HAL Id: hal-01692773
https://hal.archives-ouvertes.fr/hal-01692773
Submitted on 1 Feb 2018HAL is a multi-disciplinary open access archive for the deposit and dissemination of sci-entific research documents, whether they are pub-lished or not. The documents may come from teaching and research institutions in France or abroad, or from public or private research centers.
L’archive ouverte pluridisciplinaire HAL, est destinée au dépôt et à la diffusion de documents scientifiques de niveau recherche, publiés ou non, émanant des établissements d’enseignement et de recherche français ou étrangers, des laboratoires publics ou privés.
Experimental measurement and thermodynamic
modeling of cyclopentane hydrates with NaCl, KCl,
CaCl2, or NaCl-KCl present
Son Ho-Van, Baptiste Bouillot, Jérôme Douzet, Saheb Maghsoodloo
Babakhani, Herri Jean-Michel
To cite this version:
Son Ho-Van, Baptiste Bouillot, Jérôme Douzet, Saheb Maghsoodloo Babakhani, Herri Jean-Michel. Experimental measurement and thermodynamic modeling of cyclopentane hydrates with NaCl, KCl, CaCl2, or NaCl-KCl present. AIChE Journal, Wiley, 2018, Thermodynamics and Molecular-Scale Phenomena, 64 (6), pp.2207 à 2218. �10.1002/aic.16067�. �hal-01692773�
Experimental measurement and thermodynamic modelling of cyclopentane
hydrates with NaCl, KCl, CaCl
2or NaCl-KCl present
S.Ho-Van1, 2*, B.Bouillot1*, J.Douzet1, S. Maghsoodloo Babakhani 1, J.M.Herri1
1
Gas Hydrate Dynamics Centre, Ecole Nationale Supérieure des Mines de Saint-Etienne, 158 Cours Fauriel, 42023 Saint-Étienne, France;
2
Oil Refinery and Petrochemistry Department, Hanoi University of Mining and Geology, Duc Thang, Bac Tu Liem, Hanoi, Viet Nam
*Corresponding authors: son.ho-van@emse.fr (S.Ho-Van), bouillot@emse.fr
(B.Bouillot).
Abstract
Consistent phase equilibrium data for cyclopentane hydrates in presence of salts are vitally important to many industries, with particular interest to the field of hydrate-based water separation via cyclopentane hydrate crystallization such as desalination. However, there are very little experimental equilibrium data, and no thermodynamic prediction tools. Hence, we set up a method to generate a great deal of much needed equilibrium data for cyclopentane hydrates in diverse saline solutions with a wide range of salt concentrations. Our method does furnish verified, reliable and accurate equilibrium data. Plus, three thermodynamic approaches are developed to predict equilibrium, and provide tools for simulations, by considering the kind of salt and concentrations. All three models are in very good accordance with experimental data. One method, using a new correlation between occupancy factor and water activity, might be the best way to obtain consistent, quick and accurate dissociation temperatures of cyclopentane hydrate in brine.
Keywords: Cyclopentane Hydrates, Equilibrium, Experimental, Modelling, Salts
Introduction
Clathrate hydrates, henceforth termed hydrates, are crystalline solids composed of water and guest molecules.1 They are cage-like structures, formed by hydrogen-bonded water molecules that enclose different guest molecules. Guest compounds can be small molecules, such as CO2,
H2, CH4, C2H6, N2 or relatively large molecules such as Neohexane, Tetrahydrofuran (THF),
Tetra-n-butyl ammonium bromide (TBAB), or cyclopentane (CP). There are three different standard polymorphic structures, well described in the literature: Structure I, Structure II and Structure H.1
Hydrates have been widely studied the past decades. Indeed, their formation is a common nuisance in the oil and gas industry.2,3 Nevertheless, there are many new and potentially profitable applications such as natural gas storage,4,5,6 hydrogen storage,7 carbon dioxide capture,8,9,10 gas separation,11,2 and air-conditioning and cold thermal energy.12,13,14
Like any crystallization process, hydrate formation can be used as a separation technique. It can separate guest molecules, as well as remove water from an aqueous solution, or even water vapor. Consequently, better understanding, controlling, and or modifying the hydrate crystallization process may prove to be crucial for desalination processes,15,16,17,18 solute separation or purification,19 metal recovery,20 or even wastewater treatment.21 Moreover, some authors have suggested to use CP as large guest molecules for the hydrate-based separation process. Indeed, CP is a promising candidate. Since it is not miscible with water, hence it is easily recovered. In addition, since it crystallizes with pure water at about 7oC at atmospheric pressure, no special high pressure equipment is necessary.1,22
Most of the time, these novel techniques involve electrolytes, which are natural hydrate inhibitors, in the aqueous medium. However, even if gas hydrate formation from seawater in deep sea ocean sediments, or in pipelines, has been studied widely in the past, to the best of our knowledge there are very few applicable publications on CPH in presence of salts (and in absence of gas).
Among the relevant articles on CPH in brine, the works of Kishimoto et al.23 (morphology of CPH in presence of NaCl), Zylyftari et al.24 (rheological and thermodynamic influences of NaCl on CPH), Corak et al.25 (effect of sub-cooling and amount of hydrate former on formation of CPH in brine), Han et al.15 (efficiency of salt removal from brine by CPH using three secondary treatment methods: washing, centrifuging, and sweating), Lv et al.26 (desalination by forming hydrate from brine in CP dispersion systems) should be mentioned. Unfortunately, while Nakajima et al.22 determined the heat of dissociation, as well as the equilibrium temperature of CPH formed from a mixture of CP-in-water emulsions, no salts were used.
Considering the limited available data, the first objective of this study is to provide new experimental results in presence of electrolytes. Three salts were considered, with a wide range of concentrations: NaCl (0 – 23% mass), KCl (0 – 20% mass), an equi-mass mixture of NaCl-KCl (0 – 22% mass), and CaCl2 (0 – 25% mass). Two procedures, quick and slow, were applied
in this study. The aim of the quick procedure is to provide an initial estimate of the equilibrium temperatures. Then, the slow procedure obtains more accurate data.
Second, three thermodynamic modeling approaches are presented to determine CPH equilibrium temperatures in presence of salt with accuracy. Thank to this, simple methods can subsequently be used to model water separation processes via CPH in salty water.
Experimental section
Chemicals
All chemicals were supplied by Sigma-Aldrich (see details and purity in Table 1). Ultrapure water is provided by Milli-Q® Advantage A10 Water Purification System. This system can produce water with a conductivity σ ≤ 0.055 μS.cm-1 and TOC (total organic carbon content) less than 5 ppm.
Apparatus
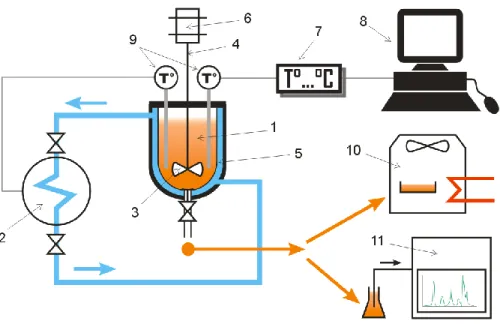
The experimental apparatus is presented in Figure 1. The reactor is a jacketed batch glass vessel (1) provided by Verre Equipments (France) with an approximate volume of one liter. The vessel is equipped with a double jacket in order to constantly and uniformly controls the temperature of the solution by using a chiller (2). This chiller, Ministat 240, supplied by Huber, has an operating temperature range of [-45 °C to 200 °C] with a temperature stability of ± 0.02 °C. The coolant of the chiller is a solution of water and ethylene glycol (44% mass fraction).
The impeller (3) inside the vessel is powered by a motor (6) to mix the injected solution. The temperature of the aqueous mixture is monitored by two temperature probes (one for the coolant system, another for the acquisition system). The data are transferred to a computer thanks to a transmitter (7). LabVIEW is employed to observe and record the digital information throughout the course of experiments.
A drying oven (Binder) (10) and an ion chromatography (Dionex DX-500 IC) system (11) are also used to measure salt concentration of the liquid samples taken at the end of the hydrate dissociation process.
Quick dissociation procedure
The objective is to provide a quick approximation of the total dissociation temperature. This can be described as follows:
For each experiment, a solution containing 500 g of de-ionized water and a certain quantity of salt based on desired salt concentration is mixed for 10 minutes. The solution is then introduced into the vessel, followed by 114.38 g of CP according to a theoretical stoichiometric composition for CPH (the molar ratio of water:CPis supposed to be 17:1).1
The solution is agitated continuously throughout the course of experiment at a rate of 300 – 400 rpm in order to increase heat and mass transfer rates. To cooling down the solution, the chiller is started at a set-point above the freezing-point of the salt solution to ensure that no ice is present in solution. When the temperature of solution reaches a value close to the set-point, hydrate formation is initiated by introducing approximately 3 g of ice (made previously from de-ionized water), and an appropriate quantity of salt in order to keep salt concentration of the solution constant (point (1) on Figure 2). Seeding directly with CPH is also an option. Visual observations are also performed by both direct observation and a camera. After approximately 1 to 2 hours, when a sufficient amount of CPH has formed, the chiller is stopped (point (2) on Figure 2). CPH then dissociates due to ambience heat-transfer. When the CPH has dissociated completely, there is a sharp increase of temperature (point (3) on Figure 2). This point corresponds presumably to the equilibrium temperature at the initial salt concentration. This equilibrium temperature is recorded for all the experiments. Mixing is stopped in order to separate the aqueous solution with the CP solution (above). Then, two samples, 1 ml and 5 ml, of the salt solution are taken at the bottom of the vessel to measure salt concentration by both ion chromatography and drying oven. The objective of this step is to validate the accuracy of the
equilibrium temperature recorded. If the initial salt concentration (before the experiment) and the final salt concentration (at the end of the hydrate dissociation process) are identical, then this shows that all CPH have dissociated. Therefore, the recorded temperature either corresponds to the equilibrium temperature or is slightly above the equilibrium temperature. Hence, the uncertainty on the equilibrium temperature can be significant, from 0.3 K to 3.6 K (see in the result section). This vagueness can be resolved by the use of a longer slow dissociation procedure.
Note that, CaCl2 will form salt hydrates after water evaporation. Indeed, after drying CaCl2 salt
solution at 60°C (set temperature of drying oven for all experiments), both CaCl2.2H2O and
CaCl2.H2O are obtained instead of pure solid CaCl2 as desired. Therefore, the drying oven is not
employed with CaCl2.
Slow dissociation procedure
Following each experiment with the quick procedure, an identical experiment is conducted but with the slow procedure. The aim is to provide more accurate data, based on the estimation obtained from the previous procedure.
The slow procedure is very similar to the quick procedure, but the dissociation method is different since the chiller is never stopped. Plus, the hydrate dissociation process is controlled differently as follow:
After a sufficient quantity of hydrate is formed, the chiller is controlled manually according to this temperature program: the temperature inside the vessel is increased at an increment of 0.1°C instead of being heating by its surroundings. The temperature is then kept constant for at least 1 hour. If there is still a significant amount of CPH after 1 hour, the temperature is increased. Of course, stirring is used and kept constant at 300-400 rpm to make sure that the system is
homogeneous in terms of concentration and temperature. This process is iterated until a few hydrate particles remain in the reactor. Then, temperature is increased of 0.1 °C, and is preserved for a longer time (half a day up to a day) to make sure that equilibrium is reached. If there are still crystals inside the vessel, this last step is repeated. The phase equilibrium of CPH is supposed to be observed during penultimate step just before the final one as all three phases (CP, CPH and aqueous) exist, and its temperature is the equilibrium temperature of CPH within 0.1°C uncertainty.
In order to detect the presence of hydrate particles, images of the solution are taken at every step through a small window by a camera. The images are analyzed and compared in order to determine the final step in which only two transparent phases of salt solution and CP can be observed as seen in the initial condition.
Moreover, to make sure that there are no CPH anymore in the bulk at the final step of the procedure, two samples of 1 ml and 5 ml are also taken from the bottom of the vessel. These samples are used to compare the initial (before cooling) and the final (dissociation point) salt concentrations. Analysis are performed through ion chromatography (1 ml sample) and drying oven (5 ml sample).
At last, we did an uncertainty analysis (see appendix). Temperature uncertainty is 0.1 K, while the uncertainty on the salts concentration is about: 0.002% mass due to weighing; 0.2% mass due to drying oven; and 0.015% mass due to ion chromatography. Figure 3 shows the slow procedure and the visual observation for each temperature step.
Experimental results
Comparison of two procedures in pure water
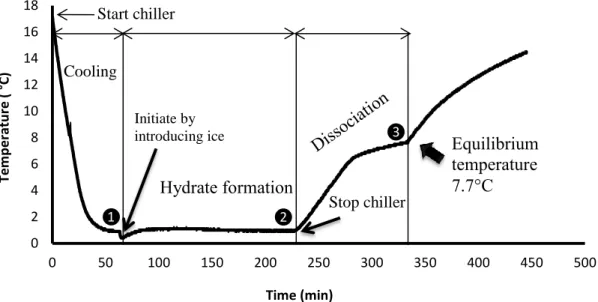
The temperature profiles in CPH formation and dissociation in pure water following the quick and the slow procedures are detailed in the Figure 2 and 3. The horizontal axis indicates the time-lapse in minute throughout the course of experiment. That the temperature decreased rapidly at the beginning due to the cooling by the chiller is confirmed in Figure 2. After introducing ice (point 1), hydrates formed, which led to a small increase of temperature as a result of the exothermic nature of crystallization. A significant increase in the quantity of hydrate was then observed.
After stopping the chiller (point 2), the temperature increased quickly due to heat-transfer from the surroundings. The temperature then remained nearly stable when hydrate dissociated intensively because of the endothermic nature of this process. Theoretically, during this period, the temperature should remain constant. The unexpected non-constant temperature dissociation can be explained only by non-equilibrium dissociation: the heat-transfer rate from the surrounding to the liquid phase is higher than the heat-transfer rate from the liquid to the hydrate crystals.
When the hydrate could no longer be observed inside the vessel, the temperature increased suddenly because of heat-transfer from the environment (point 3). The equilibrium temperature was recorded simultaneously at 7.7 °C.
In comparison with literature, this value is totally identical to the data published by Dendy Sloan
et al.1, Dirdal et al.29, Sefidroodi et al.30, Davidson et al.31 and Palmer32, while Han et al.15 reported a small different value of 7.8 °C. This comparison indicates that this value is popular in the community of researchers and can probably be considered as a benchmark for the
equilibrium condition of CPH. However, quick dissociation entails a risk of missing the accurate equilibrium temperature due to the high rate of dissociation. Notwithstanding, this method provides a first valuable estimate.
Figure 3 shows the same temperature history compared to the quick procedure during the period from the cooling to hydrate formation. This time, 30 min after hydrate formation, the temperature was increased firstly up to 6°C, near the equilibrium temperature estimated from the quick procedure (7.7°C). It was then increased stepwise and was remained constant at least within 1 hour. The dissociation process therefore took a relatively long time (nearly 4 days). Indeed, this typical behavior is expected in the slow procedure as the equilibrium temperatures were then determined accurately based on this behavior.
Both direct observation and a camera to take photos are used at each interval of dissociation process. In order to observe clearly any change the solution, the mixing rate was decreased down to approximately 120 rpm at the time of taking photos. It can be plainly discerned from Figure 3 that in the cooling process, the solution was clear due to the absence of hydrate crystals (image at
10 min). By contrast, it became turbid (or cloudy) when hydrate formed because of the presence
of suspended small-crystals of hydrate in the solution which were invisible to the naked eye (image at 30 min). Then color became more and more white and opaque due to the formation of more hydrate (image at 50 min). The color of solution was cloudy again when hydrate dissociated (image at 185 min). The turbidity of the aqueous solution including hydrate crystals and salt solution changed throughout the time with a gradual increase of the temperature. The solution was clearer after each step with an increment of 0.1 °C/hour due to the dissociation of hydrate crystals (images at 4458 min and 4522 min). At the final step, the phases were totally
clear without any turbidity (image at 5482 min) and the equilibrium temperature was recorded of 7.1°C.
Obviously, the value of the equilibrium temperature provided by slow dissociation procedure was less than the value given by the quick dissociation procedure. Of course, a quick dissociation procedure will presumably miss the total dissociation temperature. In comparison with literature, the equilibrium temperature in pure water following the slow procedure from our study, 7.1 °C, is very close to the value of 7.11 °C reported by Zylyftari et al.24 and 6.6 °C, 6.8 °C, 7.1 °C reported by Masahiro et al.22 using the Differential Scanning Calorimetry method (hereafter
abbreviated as DSC), and the value of 7.07 °C for the quadruple point (liquid water-liquid CP-vapor CP- hydrate) reported by Fan et al.33 based on the “pressure search” procedure34. The DSC method has been also used in the studies of Baek et al.35, Whitman et al.36 and Zhang et al.37. Baek et al.35 reported that the equilibrium temperature has the values from approximately 6.7°C to 7.2 °C in the presence of Sorbian monoester surfactant (HLB 4.3 to 8.6); Whitman et al.36 indicated the melting temperature of CPH at 7 °C, while Zhang et al.37 showed this value to be 7.02 °C.
From this comparison, it can be seen that the slow procedure provides data that is the same or very close to the data determined by the accurate DSC method in the literature.22,24,35,36,37 In fact, the DSC method requires more complex devices and more steps to measure the heat of melting and the melting point. There is also the very real difficulty in transferring the hydrate sample from the reactor to the test cell due to the dissociation of hydrate at room temperature. The slow dissociation procedure has simple principles and is easy to perform without the need of complex devices. Therefore, the slow procedure is a promising and consistent method to determine the equilibrium temperature of CPH in brine.
Equilibrium temperatures in the presence of salts
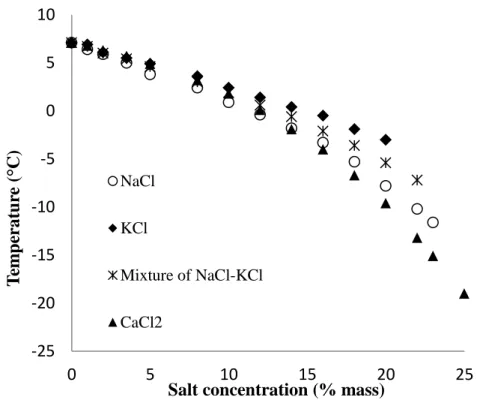
Results of measured equilibrium temperatures of CPH in presence of salts are offered in Figure 4 and Table 2. The literature data reported by Zylyftari et al.24 and Kishimoto et al.23 are also listed in Table 2 in order to compare them with our measured data.
It is clear from Figure 4 that the equilibrium temperatures drop significantly with an increase in salt concentration. This demonstrates that salt affects strongly phase equilibria. Actually, salt molecules act as inhibitors like glycols or alcohols to hydrate formation.1 The salt ionizes in water and interacts with the dipoles of the water molecules with a greater Coulombic bond than both the hydrogen bond and the van der Waals forces that cause clustering around the apolar solute molecule, preventing the water inclusion into the hydrate structures. This is the same phenomenon in principle as the lowering of the freezing-point of pure water when salt is added. On the other hand, the presence of salt causes a reduction in the solubility of CP in water, a phenomenon known as “salting-out.” Both ion clustering and salting-out lead a shift in equilibrium temperatures to lower values.1,3
There is a slight temperature difference between the quick and the slow procedures for all salts as detailed in Table 2. The equilibrium temperatures following the slow dissociation are systematically lower than those following the quick procedure at the same concentrations. Again as in the case of pure water with the quick procedure, the “equilibrium temperature” is recorded slightly late and hence is higher than actual because of the different in heat-transfer rates between solution and hydrate crystals. While, the solution temperature reaches equilibrium, the temperature inside hydrate crystals is still less than this value. Therefore, the hydrate needs a longer time to homogenize temperature and then to dissociate in the bulk solution.
In comparison with literature, Table 2 verifies that at 5%, 10%, 20% and 23% of NaCl, the equilibrium temperatures in our experiments following the slow procedure have almost the same values reported by Zylyftari et al.24 and Kishimoto et al.23 in which both the very accurate DSC
method and low dissociation rate method were applied respectively. In the study of Kishimoto and his co-workers, the equilibrium temperature was considered as the final dissociation point. The temperature of solution was increased stepwise 0.1oC/h and then was kept steady at least for one hour in order to observe the dissociation process of hydrate. The equilibrium temperature was considered reached and recorded once hydrate was no longer visible.
Moreover, notice that in Table 2 all the equilibrium temperatures in presence of NaCl are lower than those with either KCl or a mixture of NaCl-KCl. Whilst CaCl2 shows the greatest impact on
the equilibria at concentrations from and above 16%. Indeed, NaCl and CaCl2 have a significant
influence on the water activity, and hence on the equilibrium temperature.
The accuracy of the equilibrium measurements depends on initial and final salt concentrations. If these two amounts are almost equal (all hydrate crystals have dissociated), then hypothetically, the results are valuable and accurate. Our results indicate that for all the experiments, the initial and the final salt concentrations are approximately identical.
Modelling CPH thermodynamic equilibrium
Three different thermodynamic approaches were used to model phase equilibria of CPH in presence of salts. The first approach (n°1) is based on Hildebrand and Scott's equation38 and the two others (n°2 and n°3) on van der Waals and Platteuw model.39
Each method establishes the equilibrium state by equalizing the chemical potential of water in liquid and hydrate phases:
L w
= H w
where wLand wH are the chemical potentials of water in liquid and CPH phase, respectively.
Approach n°1
Water activity in salt solution with the presence of CPH is expressed from the freezing point depression using Hildebrand and Scott's equation which is usually applied for modelling solid-liquid equilibria of a pure solute in a solvent. The standard equation is expressed as follows:
T T T T T R C T T T T R H a fm f f f f fm w ln ) ( ) ( ln (2)
where Tf is the fusion temperature in K, ΔHfm is the molar enthalpy of fusion in J/mole, ΔCfm is
the change of molar specific heat between the subcooled liquid and the solid in J/mole.K, and aw
is the water activity. Actually, this is a standard method to predict freezing of pure water in the presence of salts.40,41 In this case, the solid phase is just ice, and there are no other molecules involved in crystallization.
Let us consider in our approach that water crystallizes alone in the form of CPH (structure II hydrate). CP molecule is “neglected’’ since its chemical potential will not be considered. It is a complete separate phase. Indeed, CP is not very soluble in water. Its influence on the equilibrium will be included (hidden) in the values of ΔHfm, Tf, and ΔCfm. Moreover, CP’s
influence on water activity is negligible (molar solubility less than 4.10-4), especially in presence of electrolytes, and CP can be considered as a limiting reactant, in contact with the aqueous phase. Of course, this means that the used reference state for equation (2) is the equilibrium between CPH and its dissociated form (pure liquid water) and CP molecules in stoichiometric proportions according the following reaction:
The fusion temperature of CPH was determined from our experiments, and literature (279.95K).22 ΔHmf was acquired from Nakajima et al.22 and Zhang et al.42 (we chose the value
of 283.9 kJ/kg hydrate reported by Nakajima et al.22 because it is more accurate), and R is the well-known gas constant. Only ΔCmf is unknown. Since we work at a temperature close to Tf, we
concluded that ΔCmf could not be neglected because the results would not be accurate. Hence,
this work, a correlation for ΔCmf(T) was established by using our experimental data from
NaCl-water mixture (only). The geochemical model PHREEQC43 provided water activity in salt solution with the PITZER database.
The equilibrium temperatures of CPH in salts are then calculated by using both equations (2) and the new correlation ΔCmf(T). Water activity is temperature-dependent and needs to be calculated
at the onset. The value of water activity in the presence of salts at 273.15 K is firstly used in equation (2). At each following step, after predicting the equilibrium temperature, PHREEQC re-calculates the new water activity via the predicted-equilibrium temperatures. This new water activity is then used to re-predict the equilibrium temperature. The calculation is iterated until PHREEQC provides the same value of water activity as at the penultimate step. The final predicted-equilibrium temperature is then recorded. The procedure to predict the equilibrium temperatures is illustrated in Figure 5.
The absolute average deviation (AAD) is defined as follows:
N i i pred i T T N AAD 1 exp , , 1 (4)where N is the number of experimental data points, Ti,pred (K) is the predicted-equilibrium
Note that Hu et al. (2017) succeeded in using a quite similar equation to correlate suppression temperature of gas hydrate in single salt inhibited system, although they neglect ΔCp, and
provide an equation for ∆𝑇/𝑇0𝑇 (ΔT being the suppression temperature, T and T0 being the
equilibrium temperature with and without inhibitor, respectively).44
Approach n°2
The CPH equilibrium is described by van der Waals and Platteuw model.39 This method is based on classic thermodynamics for the water liquid phase and statistical thermodynamics for hydrate phase with the following assumptions:
Each cavity encloses at most one guest molecule.
The interaction between guest molecule and the cavity can be described by a pair potential function of the pair guest-molecule.
Cavities are perfectly sphere-shaped. Guest molecules do not deform cavities.
There is no interaction between the guest molecules in different cavities.
In the thermodynamic equilibrium, the equality of chemical potential of water in the hydrate phase and liquid phase can be written by introducing references states. For the hydrate, the reference state is a hypothetical phase β written by the van der Waals and Platteuw model corresponding to the empty cavities:
wH wL (5) where w H and w L
are the differences of the chemical potentials between water in the
While wL can be expressed using the Gibbs-Duhem equation,45 wHis calculated from statistical Thermodynamics, from van der Waals and Platteuw method:
) j i j θ ( i i ν RT H β w Δμ ln1 (6)
where R is the universal constant, T is the absolute temperature, νi is the number of type i cavities
per water molecule in the hydrate (8/136 for CPH), and 𝜃𝑗𝑖 is the occupancy factor (𝜃
𝑗𝑖[0, 1]) of
the cavities of type i by the guest molecule j (the guest molecule here is CP). 𝜃𝑗𝑖 can be written by
the Langmuir adsorption model and is expressed as follows:
j j i j j i j i j P T f C P T f C ) , ( 1 ) , ( (7)where fj is the fugacity of the guest j (CP). Cji is the Langmuir constant of guest j in cavity i. It is
usual to obtain Cji from the integration of the Kihara interaction potential as follows:
r dr kT r w kT Ci R a j 2 0 ) ( exp 4
(8)where k is the Boltzmann constant, r is the distance from the center of the cavity, R is the empty cavity radius, w(r) is the interaction potential between the cavity and the guest molecule, and ɑ is the core radius defined in the Kihara potential. The interaction potential w(r) is determined by the Parrish and Prausnitz model46 and can be expressed as follows:
4 5 5 6 11 10 11 12 2 ) ( R a r R R a r R z r w (9) N N N R a R r R a R r N 1 1 1 (10)
Parameters ε, σ, ɑ are so-called Kihara parameters. ε corresponds to the maximum attractive potential and σ is the distance between the cores at zero potential energy. They can be calculated from experimental data by fitting the model equations to correspond the equilibrium
experimental one.10,47,48,49,50 In this description, the interaction potential is dependent on only the properties of guest molecule (via Kihara parameters), and geometrical properties of the cavities (via the coordination number z and radius R).
In the end, both chemical potentials are function of the temperature and the salt concentration. On the one hand, the liquid part, the pressure is atmospheric, and does not affect the equilibrium significantly. Only the temperature and the water activity (hence the salt concentration) are the major variables. Of course, property parameters are needed. We worked with the parameters from Handa and Tse51 after verifying they correspond the best.45
On the other hand, the hydrate potential is a function of the CP fugacity, since the Kihara parameters are constant for a given guest. CP fugacity should be the same in all phases: liquid, hydrate and vapor. Since liquid CP can be considered as a pure phase (very low solubility of water in CP), fugacity was calculated from its vapor pressure. Therefore, a standard Antoine’s equation was used, assuming that fCP = PsatCP (fCP and PsatCP being the fugacity and the saturated
pressure of CP, respectively). This fugacity is only temperature dependent.
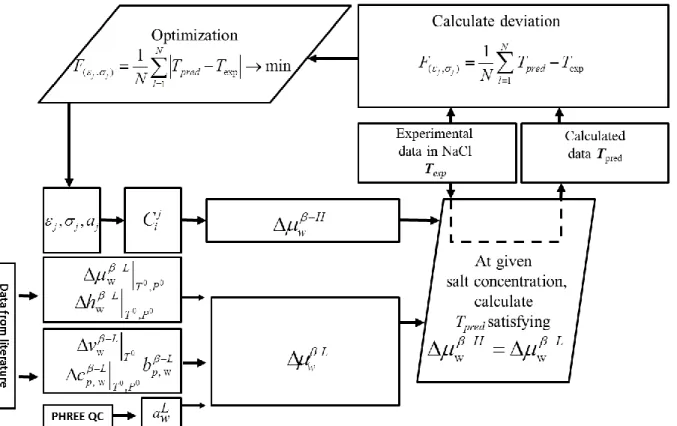
The calculation of the temperature from a given salt concentration, or the opposite, can be obtained from the van der Waals equation. But first, we needed to get the Kihara parameters of CP molecule. A deviation function between the predicted-temperatures and the experimental ones was used to obtain epsilon (ε) and sigma (σ):
( , ) exp 1 1 min j j N pred l F T T N
(11)The procedure to optimize the Kihara parameters is presented in Figure 6.45 The calculation can determine a set of Kihara parameters ε, σ, and ɑ which provide the smallest ( , )
j j
The value of a was determined based on the method described by Tee et al.52 The values of 0 0,P T L w , T0,P0 L w h , bpL,w, , T0,P0 L w p C , and 0 T L w
can be found in the literature detailed in Table 3 and 4 as cited by Sloan.1, 53
As clarified on the Figure 6, at the first step of the optimization, for a given set of Kihara parameters εj, σj and a given experimental temperature in NaCl (conforming to a given salt
concentration or water activity,awL), we calculated the interaction potential w(r) in Eq.(9), the
Langmuir constant Cji in Eq.(8), and then w H
in Eq.(6). The predicted-equilibrium
temperature Tpred at a given salt concentration corresponds to the value at which w L H w .
The second step selects the Kihara parameters to fit with the experimental data in NaCl. In this
optimization, σ is ranged from 2 to 4 (Å), while
k
is ranged from 200 to 300 (K).
Approach n°3
The third approach is similar to the second one (n°2) in principle, however Kihara parameters were not employed. The main drawback of using these parameters is to provide accurate values that other authors could work with. Unfortunately, the difference in each code usually leads to differing simulation results.45 So, we suggest modeling only the occupancy of CP in the hydrate
cavities (θ). We chose to correlate the occupancy factor to the water activity, F
aw . This approach is not rigorous since occupancy factor is of course dependent on the guest molecule. However, we managed to obtain a correlation that fits well the experimental results considering only water activity. Therefore, CP influence on hydrate chemical potential is hidden in the correlation parameters.Equations Eq.(5), Eq.(6), and experimental data were used to obtain an adequate correlation. PHREEQC provided the water activity required to calculate, as before.
Finally, the occupancy factor can be expressed as a function of the water activity as follows:
F
aw m
aw2 n
aw p (12)
where m, n and p are the empirical constants depending on the experimental data chosen for the correlation in Eq.(12). The procedure to predict the equilibrium temperature is detailed in Figure 7.
Only data in the presence of NaCl was used at first to get the empirical parameters. Then, the method was applied to other systems, with other salts (KCl, a mixture of NaCl-KCl and CaCl2).
As mentioned in the first approach, as the water activity is temperature-dependent, the value of water activity at 273.15 K is used at the first step. Subsequently, PHREEQC provides the water activity at each following step. The predicted-equilibrium temperature is recorded once PHREEQC provides the same value of water activity as at the penultimate step.
Modelling results
Approach n°1
By using the experimental data of CPH in the presence of NaCl following the slow dissociation, the correlation for ΔCmf was expressed as follow:
Cmf F(T)aexp(bT) (13)
As stated previously, this term cannot be neglected since we work at a temperature close to the pure CPH dissociation temperature. If we ignored ΔCmf, then any simulations would be
significantly less accurate, when compared to experiments.
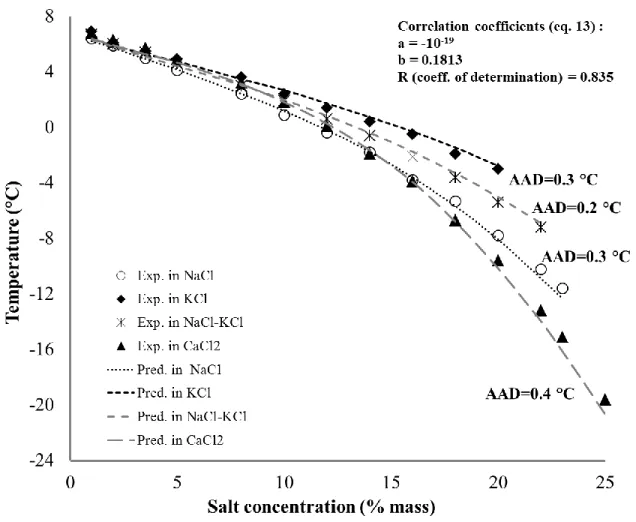
Figure 8 presents the experimental and predicted dissociation temperatures following the approach n°1. Correlation coefficients are also included. Absolute average deviations were in NaCl: 0.3K, KCl: 0.3K, a mixture of NaCl-KCl: 0.2K, and CaCl2: 0.4K. This indicates that the
for CPH not only in the presence of NaCl but also in the presence of KCl, and a mixture of NaCl-KCl.
In the case of CaCl2, at low concentrations from 1% to 18%, the predicted data are very close to
the experimental results. However, at concentrations from 20% to above, there is a relatively considerable gap between the predicted and experimental data. The mean absolute difference at these high concentrations is approximately 0.9 K compared to a value of 0.2 K at the lower concentrations. This unexpected dissimilarity is probably due to the equilibrium temperature at high concentrations of CaCl2 is out of range of the equilibrium data in the presence of NaCl used
to discover the new correlation ΔCmf(T).
Approach n°2
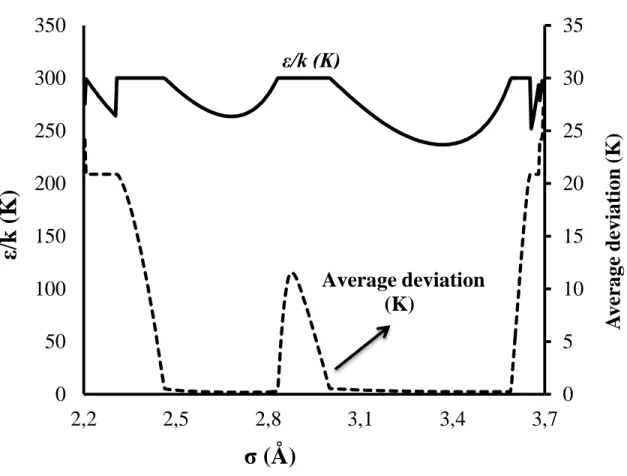
Three Kihara parameters of CP have been determined. They are the spherical nucleus radius a, the distance between the molecule and the cavity wall at null potential σ, and the maximum attraction potential ε. The value of a was determined based on the second virial coefficient of CP based on the method described by Tee el al.52 The remaining two Kihara parameters (epsilon and sigma) were optimized by minimizing the absolute average deviation between the predicted and measured equilibrium temperatures of CPH in the presence of NaCl. Figure 9 presents average deviation between the equilibrium and predicted temperature as a function of σ and ε/k. A huge range of σ and ε/k were tested to optimize the best set of Kihara parameters for CP.
As clarified on the Figure 9, when the value of σ is less than 2.4 or more than 3.6 regardless the value of ε/kb (kb being the Boltzmann constant), the average deviation is enormous. Hence the
Kihara parameters of CP can be found in the two valleys of Figure 9.
To be clearer, the two valleys of Figure 9 have been presented in Figure 10 in only two dimensions. For a chosen value of σ between 2 and 4 (with an increment of 0.002), different
values of ε/kb from 200 to 300 (with an increment of 0.1) were tested and the best values which
provide the smallest deviation are plotted. The Figure 10 illustrates that the average deviation is close to zero where the value of σ belongs to either a range from 2.46 to 2.81 corresponding to the value of ε/kb between 263.5 and 300 or a range from 3.0 to 3.56 corresponding to the value of
ε/kb between 237 and 300. From these ranges of σ and ε/kb, we chose among the best set of
parameters σ = 2.72 Å, ε/kb = 265.5 K. The hard core radius was taken from the literature,54 a=
0.8968 Å.
Figure 11 shows the experimental and predicted hydrate equilibrium temperatures of CPH based on the obtained Kihara parameters for CP. The agreement between experimental data and predictions is very excellent and the maximum average deviation in predicting the equilibrium temperature is about 0.2 K in the presence of either NaCl or CaCl2. This value is 0.1 K for a
mixture of NaCl-KCl and KCl, indicating that the hydrate formation temperatures are very well reproduced in the presence of other kinds of salts, especially in the presence of KCl and a mixture of NaCl-KCl.
Approach n°3
As mentioned in section 4.3, in the approach no3, the occupancy factor is expressed as a function of the water activity by Eq.(12). In this equation, the fitting parameters (m, n and p) are all determined by using the experimental equilibrium data in the presence of NaCl.
The correlation coefficients in Eq.(12) and predicted CPH equilibrium temperatures in the presence of salts according to the approach no3 are presented in Figure 12. It can be seen that, the predicted results concur well with the experimental data. The maximum absolute error in predicting the hydrate formation temperature is not greater than 0.4 K for either KCl or NaCl-KCl and not greater than 0.6 K for CaCl2. The average absolute deviations are 0.1 K in the
presence of NaCl, KCl and a mixture of NaCl-KCl, and 0.2 K in the presence of CaCl2. This
indicates that the approach no3 duplicates very well the equilibrium temperatures for CPH in the presence whatever salts.
Summary and results on the models
Three approaches have been modified and used to predict the phase equilibrium of CPH in presence of various salts. The results of simulation are listed in Table 5.
As shown in this table, all three approaches are capable of satisfactorily predicting hydrate formation temperature of CP in presence of different salts. The average deviations are less than, or equal to 0.4 K in all cases.
Moreover, using the Kihara parameters in the approach n°2 and the new correlation of occupancy factor and water activity for van der Waals and Platteuw model in the approach n°3 are an excellent suggestion as the deviation is less than, or equal to 0.2 K, for any of the salts tested. However, approach n°2 requires the integration of the Kihara potential, which can lead to different final values depending on the code and is also influenced by the use of the Antoine equation for CP vapor pressure. Therefore, approach n°3 is the most accurate and simplest method to obtain quick and consistent dissociation temperatures of CPH from brine. As an added plus it is not code-dependent.
Conclusion
Two procedures were applied to determine experimentally the dissociation temperatures of CPH in presence of NaCl, KCl, an equi-mass mixture of NaCl-KCl, and CaCl2. One was at high
dissociation rate, for quick estimation completed in a few hours. On the other hand, the second method occurred at a lower dissociation rate, for more accurate measurements, and took place over days.
Based on the results, a temperature shift between the equilibrium temperatures following two procedures was observed. As the quick procedure tends to miss the right temperature, its results are slightly above the right value.
Slow procedure provides results that are very close to the data reported in the literature in pure water and also brine. This indicates that this method is excellent to determine CPH dissociation temperatures.
The results also show that the equilibrium temperatures dropped significantly with an increase in salt concentration, whatever the kinds of salt used due to both ion clustering and salting-out phenomenon. In addition, the equilibrium temperatures of CPH in the presence of NaCl were always lower than the equilibrium temperatures in the presence of KCl and a mixture of KCl-NaCl at the same concentration. Whilst CaCl2 shows the greatest impact on the equilibrium
temperatures at concentrations from and above 16% in mass fraction compared to the other salts. This is due to the great influence on water activity of both NaCl and CaCl2, and hence on the
hydrate formation equilibrium temperatures.
Moreover, the experimental data have been described by three thermodynamic approaches. The first is based on the Hildebrand and Scott’s equation to discover a new correlation for the change
of specific heat of CPH and the dissociation points. The two others are based on van der Waals and Platteuw model. While the second one uses optimized Kihara parameters from this work, the third utilizes a new correlation between the occupancy factor and water activity.
At first, experimental data in presence of NaCl were used to fit the needed parameters. Then, each method was compared to other experimental data, with different salts. Finally, all three approaches have a good capability to predict CPH dissociation temperatures in presence of various salts. Average deviations are less than, or equal to, 0.4 K in all cases. The use of van der
Waals and Platteuw method is even more accurate, with a deviation below 0.2 K. The new correlation between occupancy factor and water activity is probably the best to obtain quick, consistent, and accurate dissociation temperature of CPH in brine.
Notation
a activity [–] or Kihara parameter, spherical nucleus radius [m], coefficients [–] for the correlation of the change of molar specific heat
b coefficient linear temperature dependency of the heat capacity [J mol−1 K−2], and coefficients [–] for the correlation of is the change of molar specific heat
C Langmuir constant of cavity [L mol-1] or molar heat capacity [J mol−1 K−1]
f fugacity [Pa]
h molar enthalpy [J mol−1]
k or, kb: Boltzmann constant [J K−1]
m coefficient of the correlation of the cage occupancy N number of points of a given set of data
n mole number, coefficient of the correlation of the cage occupancy
P pressure [Pa]
p coefficient of the correlation of the cage occupancy
R gas molecule equivalent radius [m], or universal gas constant [8.314472 m2 kg s−2 K−1 mol−1], or coefficient of determination [-].
r distance between the molecule and the wall of the cavity [m]
T temperature [K]
V volume [m3]
Greek letters
ε Kihara parameter, maximum attraction potential [−]
µ Chemical potential [J mol−1]
υ number of cavities per molecules of water [−]
θ occupation rate of cavity/gas
ρ (mass) density of water [kg m−3]
σ Kihara parameter, distance between the molecules and the cavity wall, at null potential
[m]
Superscripts
I ice phase
H hydrate phase
L liquid phase
β hypothetical reference phase for the hydrate phase corresponding to empty lattice β-φ referring to the difference between the reference β phase and any φ phase
Acknowledgements
This study has been supported by ARMINES (Association pour la recherche et le developpement des methodes et processus industriels), Vietnam Ministry of Education and Training, and Hanoi University of Mining and Geology. The authors thank all the members of the GasHyDyn team for their constant support, especially our laboratory technician, Fabien Chauvy. The authors would like also to thank Christopher Yukna very much for his advice on English and proofreading.
Literature Cited
1. Sloan E.D, Koh C.A. Clathrate Hydrate of Natural Gases: 3rd ed.Taylor & Francis Group; 2008.
2. Jr EDS. Review article Fundamental principles and applications of natural gas hydrates.
Nature. 2003;426.
3. Sloan D, Koh C, K.Sum A. Natural Gas Hydrate in Flow Assurance. Gulf Professional Pub./Elsevier; 2011.
4. Mimachi H, Takeya S, Yoneyama A, et al. Natural gas storage and transportation within gas hydrate of smaller particle: Size dependence of self-preservation phenomenon of natural gas hydrate. Chem Eng Sci. 2014;118:208-213.
5. Sun ZG, Wang R, Ma R, Guo K, Fan S. Natural gas storage in hydrates with the presence of promoters. Energy Convers Manag. 2003;44(17):2733-2742.
6. Burnol A, Thinon I, Ruffine L, Herri JM. Influence of impurities (nitrogen and methane) on the CO2 storage capacity as sediment-hosted gas hydrates - Application in the area of
the Celtic Sea and the Bay of Biscay. Int J Greenh Gas Control. 2015;35:96-109.
7. Veluswamy HP, Kumar R, Linga P. Hydrogen storage in clathrate hydrates: Current state of the art and future directions. Appl Energy. 2014;122:112-132.
8. Duc NH, Chauvy F, Herri JM. CO2 capture by hydrate crystallization - A potential
solution for gas emission of steelmaking industry. Energy Convers Manag. 2007;48(4):1313-1322.
9. Herri J-M, Bouchemoua A, Kwaterski M, et al. Enhanced Selectivity of the Separation of CO2 from N2 during Crystallization of Semi-Clathrates from Quaternary Ammonium
10. Herslund PJ, Thomsen K, Abildskov J, et al. Thermodynamic Promotion of Carbon
Dioxide-Clathrate Hydrate Formation by Tetrahydrofuran, Cyclopentane and Their Mixtures. Vol 17.; 2013.
11. Babu P, Linga P, Kumar R, Englezos P. A review of the hydrate based gas separation (HBGS) process forcarbon dioxide pre-combustion capture. Energy. 2015;85:261-279. 12. Darbouret M, Cournil M, Herri JM. Rheological study of TBAB hydrate slurries as
secondary two-phase refrigerants. Int J Refrig. 2005;28(5):663-671.
13. Douzet J, Kwaterski M, Lallemand A, Chauvy F, Flick D, Herri JM. Prototyping of a real size air-conditioning system using a tetra-n-butylammonium bromide semiclathrate hydrate slurry as secondary two-phase refrigerant - Experimental investigations and modelling. Int J Refrig. 2013;36(6):1616-1631.
14. Ogoshi H, Takao S. Air-Conditioning System Using Clathrate Hydrate Slurry. JFE Tech
Rep. 2004;3(3):1-5.
15. Han S, Shin JY, Rhee YW, Kang SP. Enhanced efficiency of salt removal from brine for cyclopentane hydrates by washing, centrifuging, and sweating. Desalination. 2014;354:17-22.
16. Cha JH, Seol Y. Increasing gas hydrate formation temperature for desalination of high salinity produced water with secondary guests. ACS Sustain Chem Eng. 2013;1(10):1218-1224.
17. Kang, Kyung Chan; Hong, Sang Yeon; Cho, Seong Jun; Kim, Dong Hyun; Lee JD. Evaluation of Desalination by Nanostructured Hydrate Formation and Pellet Production Process. J Nanosci Nanotechnol. 2017;17(6):4059-4062(4).
Pressure. M.S. Thesis, Colorado School of Mines, U.S.A, 2014.
19. Willson R. C., Bulot E. & Cooney C. L. Use of hydrates for aqueous solution treatment. United States Patent,Patent Number: US 4678583. 1987 Jul. 7.
20. Song Y, Dong H, Yang L, et al. Hydrate-based heavy metal separation from aqueous solution. Sci Rep. 2016;6(January):21389.
21. Mottet B. Method for purification of water by direct osmosis and crystallisation of clathrate hydrates. European Patent Office. EP20150305505 20150403. 2016.
22. Nakajima M, Ohinura R, Mori YH. Clathrate hydrate formation from cyclopentane-in-water emulsions. Ind Eng Chem Res. 2008;47(22):8933-8939.
23. Kishimoto M, Iijima S, Ohmura R. Crystal growth of clathrate hydrate at the interface between seawater and hydrophobic-guest liquid: Effect of elevated salt concentration. Ind
Eng Chem Res. 2012;51(14):5224-5229.
24. Zylyftari G, Lee JW, Morris JF. Salt effects on thermodynamic and rheological properties of hydrate forming emulsions. Chem Eng Sci. 2013;95:148-160.
25. Corak D, Barth T, Høiland S, Skodvin T, Larsen R, Skjetne T. Effect of subcooling and amount of hydrate former on formation of cyclopentane hydrates in brine. Desalination. 2011;278(1-3):268-274.
26. Lv Y-N, Wang S-S, Sun C-Y, Gong J, Chen G-J. Desalination by forming hydrate from brine in cyclopentane dispersion system. Desalination. 2017;413:217-222.
27. McAuliffe C. Solubility in Water of Paraffin, Cycloparaffin, Olefin, Acetylene, Cycloolefin, and Aromatic Hydrocarbons1. J Phys Chem. 1966;70(4):1267-1275.
28. Dean JA. LANGE’S HANDBOOK OF CHEMISTRY. Mater Manuf Process.
29. Dirdal EG, Arulanantham C, Sefidroodi H, Kelland MA. Can cyclopentane hydrate formation be used to rank the performance of kinetic hydrate inhibitors? Chem Eng Sci. 2012;82:177-184.
30. Sefidroodi H, Abrahamsen E, Kelland MA. Investigation into the strength and source of the memory effect for cyclopentane hydrate. Chem Eng Sci. 2013;87:133-140.
31. D.W.Davidson. Clathrate Hydrates. In: F. Franks, ed. Water in Crystalline Hydrates
Aqueous Solutions of Simple Nonelectrolytes. 2nd ed. New York: Springer
Science+Business Media; 1973.
32. Palmer, H. A. Characterization of hydrocarbon-type hydrates. Ph.D.Thesis, University of Oklahoma, Norman, OK, 1950.
33. Fan SS, Liang DQ, Guo KH. Hydrate equilibrium conditions for cyclopentane and a quaternary cyclopentane-rich mixture. J Chem Eng Data. 2001;46(4):930-932.
34. Fan S-S, Guo T-M. Hydrate Formation of CO2-Rich Binary and Quaternary Gas Mixtures
in Aqueous Sodium Chloride Solutions. J Chem Eng Data. 1999;44(4):829-832.
35. Baek S, Min J, Lee JW. Equilibria of cyclopentane hydrates with varying HLB numbers of sorbitan monoesters in water-in-oil emulsions. Fluid Phase Equilib. 2016;413:41-47. 36. Whitman CA, Mysyk R, White MA. Investigation of factors affecting crystallization of
cyclopentane clathrate hydrate. J Chem Phys. 2008;129(17).
37. Zhang JS, Lee JW. Equilibrium of hydrogen + cyclopentane and carbon dioxide + cyclopentane binary hydrates. J Chem Eng Data. 2009;54(2):659-661.
38. J. H. Hildebrand and R. L. Scott. Regular Solutions. Prentice Han, Englewood Cliffs, N.J., 1962, p. 20.
40. Miyawaki O, Saito A, Matsuo T, Nakamura K. Activity and activity coefficient of water in aqueous solutions and their relationships with solution structure parameters. Biosci
Biotechnol Biochem. 1997;61(3):466-469.
41. CHANDRASEKARAN SK, KING CJ. Solid-Liquid Phase Equilibria in Multicomponent
Aqueous Sugar Solutions. J Food Sci. 1971;36(4):699-704.
42. Zhang Y, Debenedetti PG, Prud RK, Pethica BA. Differential Scanning Calorimetry Studies of Clathrate Hydrate Formation. Water. 2004;108(43):16717-16722.
43. Parkhurst BDL, Appelo C a J. User’s Guide To PHREEQC (version 2) — a Computer Program for Speciation, and Inverse Geochemical Calculations. Exch Organ Behav Teach
J. 1999;D(Version 2):326.
44. Hu Y, Lee BR, Sum AK. Universal correlation for gas hydrates suppression temperature of inhibited systems: I. Single salts. AIChE J. July 2017.
45. Herri J-M, Bouchemoua A, Kwaterski M, Fezoua A, Ouabbas Y, Cameirao A. Gas hydrate equilibria for CO2–N2 and CO2–CH4 gas mixtures—Experimental studies and
thermodynamic modelling. Fluid Phase Equilib. 2011;301(2):171-190.
46. Parrishl WR, John M. Dissociation Pressures of Gas Hydrates Formed by Gas Mixtures.
Ind Eng Chem Process Des Dev. 1972;11(1):26-35.
47. Chassefière E, Dartois E, Herri J-M, et al. CO2–SO2 clathrate hydrate formation on early
Mars. Icarus. 2013;223(2):878-891.
48. Herri J-M, Chassefière E. Carbon dioxide, argon, nitrogen and methane clathrate hydrates: Thermodynamic modelling, investigation of their stability in Martian atmospheric conditions and variability of methane trapping. Planet Space Sci. 2012;73(1):376-386. 49. Muromachi S, Nagashima HD, Herri JM, Ohmura R. Thermodynamic modeling for
clathrate hydrates of ozone. J Chem Thermodyn. 2013;64:193-197.
50. Le Quang D, Le Quang D, Bouillot B, Herri JM, Glenat P, Duchet-Suchaux P. Experimental procedure and results to measure the composition of gas hydrate, during crystallization and at equilibrium, from N2-CO2-CH4-C2H6-C3H8-C4H10 gas mixtures.
Fluid Phase Equilib. 2016;413:10-21.
51. Handa YP, John ST. Thermodynamic Propertles of Empty Lattices of Structure I and Structure II Clathrate Hydrate. J Phys Chem. 1986;90(22).
52. Tee LS, Gotoh S, Stewart WE. Molecular Parameters for Normal Fluids. Kihara Potential with Spherical Core. Ind Eng Chem Fundam. 1966;5(3):363-367.
53. Sloan E., Jr. Marcel Dekker, Inc. Clathrate Hydrates of Natural Gases. Vol 14. Sencond ed.; 2000.
54. Takeuchi F, Ohmura R, Yasuoka K. Statistical-thermodynamics modeling of clathrate-hydrate-forming systems suitable as working media of a hydrate-based refrigeration system. Int J Thermophys. 2009;30(6):1838-1852.
List of Figure Captions:
Figure 1: Simplified schematic of the main experimental apparatus
1-Vessel, 2-Chiller, 3-Impeller, 4-Agitator, 5-Cooling jacket, 6-Motor, 7-Temp transmitter, 8-Computer, 9-Temperature probe, 10-Drying oven, 11-Ion chromatography
Figure 2: Temperature profile in hydrate formation and dissociation in pure water following the
quick procedure
Figure 3: Temperature profile in hydrate formation and dissociation in pure water following the
slow procedure
Figure 4: Equilibrium temperature of CPH in the presence of salts from experiments (slow
procedure)
Figure 5: The algorithm of equilibrium temperature calculation in the approach n°1 Figure 6: Procedure to optimize the Kihara parameters
Figure 7: Procedure to predict the equilibrium temperatures using the correlation θ = F(aw)
Figure 8: Experimental and predicted dissociation temperature of CPH in the presence of salts,
and correlation coefficients for approach n°1 from Eq.(13) obtained from data in the presence of NaCl.
Figure 9: Typical form of the deviation between the predicted and the experimental data as a
function of the Kihara parameters. x and y axes correspond respectively to Kihara parameters σ and ε/kb. The best set of value σ and ε is the one that minimizes the objective function F (in
Eq.(11)).
Figure 10: ε/k versus σ at the minimum deviation from experimental data in NaCl
Figure 11: Experimental and predicted dissociation temperature of CPH in the presence of salts,
Figure 12: Experimental and predicted dissociation temperature of CPH in the presence of salts,
and correlation coefficients for approach n°3 from Eq.(12) obtained from experimental data in NaCl.
Figure 1: Simplified schematic of the main experimental apparatus
1-Vessel, 2-Chiller, 3-Impeller, 4-Agitator, 5-Cooling jacket, 6-Motor, 7-Temp transmitter, 8-Computer, 9-Temperature probe, 10-Drying oven, 11-Ion chromatography
Figure 2: Temperature profile in hydrate formation and dissociation in pure water following the quick procedure
0 2 4 6 8 10 12 14 16 18 0 50 100 150 200 250 300 350 400 450 500 Tem p e ratu re ( °C) Time (min) Stop chiller Cooling Hydrate formation Initiate by
introducing ice Equilibrium
temperature 7.7°C Start chiller ❷ ❸ ❶
Figure 3: Temperature profile in hydrate formation and dissociation in pure water following the slow procedure
Figure 4: Equilibrium temperature of CPH in the presence of salts from experiments (slow procedure) -25 -20 -15 -10 -5 0 5 10 0 5 10 15 20 25 T em p er at u re ( °C)
Salt concentration (% mass)
NaCl KCl
Mixture of NaCl-KCl CaCl2
Figure 8: Experimental and predicted dissociation temperature of CPH in the presence of salts, and correlation coefficients for approach n°1 from Eq.(13) obtained from data in the presence of
Figure 9. Typical form of the deviation between the predicted and the experimental data as a function of the Kihara parameters. x and y axes correspond respectively to Kihara parameters σ
and ε/kb. The best set of value σ and ε is the one that minimizes the objective function F (in Eq.
Figure 10: ε/k versus σ at the minimum deviation from experimental data in NaCl
0
5
10
15
20
25
30
35
0
50
100
150
200
250
300
350
2,2
2,5
2,8
3,1
3,4
3,7
ε/
k
(K
)
σ (Å)
A
v
era
g
e
dev
ia
ti
o
n
(K)
Average deviation
(K)
ε/k (K)
Figure 11: Experimental and predicted dissociation temperature of CPH in the presence of salts, and Kihara parameters for CP
Figure 12: Experimental and predicted dissociation temperature of CPH in the presence of salts, and correlation coefficients for approach n°3 from Eq.(12) obtained from experimental data in
Table 1: Purity of initial material used Material Chemical formula Mol.weight (g. mol-1) Solubility in water (g/l) Purity Cyclopentane C5H10 70.1 0.156 (25 °C)27 98.0%
Sodium chloride NaCl 58.4 360 (20 °C)28 99.5%
Potassium chloride KCl 74.55 344 (20 °C)28 99.0%
Table 2: Equilibrium dissociation temperaturesa of CPH in the presence of NaCl, KCl, an equi-weight mixture of NaCl-KCl and CaCl2
Salinity b,c,d (% mass) T e-quick in NaCl (°C) Te-slow in NaCl (°C) Te in NaCl (°C)24 Te in NaCl (°C)23 T e-quick in KCl (°C) T e-slow in KCl (°C) Te-quick in NaCl-KCl (°C) Te-slow in NaCl-KCl (°C) Te-quick in CaCl2 (°C) Te-slow in CaCl2, (°C) 0 (pure water) 7.7 7.1 7.11 - 7.7 7.1 7.7 7.1 7.7 7.1 1 6.9 6.4 - - 7.2 6.9 7 6.7 7.1 6 2 6.3 5.9 - - 6.6 6.1 6.5 6.0 6.8 6.3 3.5 5.7 5 - - 6 5.5 5.9 5.4 6.2 5.6 5 4.9 4.1 - 4.45 5.4 4.9 5.1 4.6 5.5 4.9 8 3.5 2.4 - - 4.2 3.6 3.6 3.0 3.9 3.3 10 2 0.9 1.16 1.25 3.6 2.4 2.4 1.9 2.5 1.8 12 0.9 -0.4 - - 2.3 1.4 1.5 0.6 1.5 0.1 14 -1 -1.8 - - 1.2 0.4 -0.2 -0.6 -1.0 -1.9 16 -2.7 -3.8 - - 0.6 -0.5 -1.2 -2.1 -2.7 -4 18 -5 -5.3 - - -1 -1.9 -3 -3.6 -5.5 -6.7 20 -7.2 -7.8 -8.00 - -2.1 -3 -4.6 -5.4 -8.1 -9.6 22 -9.7 -10.2 - - - - -6.1 -7.2 -12.0 -13.2 23 25 -11 - -11.6 - -11.66 - - - - - - - - - - - -13.0 -16.0 -15.1 -19.6
where Te-quick and Te-slow are the equilibrium temperatures following the quick and the slow
procedures. a Uncertainty of the temperature measurements: ±0.1 K. b Uncertainty due to weighing: ±0.002 %mass. c Uncertainty due to drying oven: ±0.2 %mass. d Relative uncertainty due to ion chromatography: 1.5%, see the appendix
Table 3: Parameters used for the hydrate-phase and ice (for Hydrate Structure II only) 0 0,P T L w (j/mol) 0 0 ,P T I w h (j/mol) Citation
Table 4: Reference properties of hydrate from Sloan 1,53 (for Hydrate Structure II only)
Parameters Unit Value
0 0,P T L w h * J.mol-1 0 0,P T I w - 6011 0 0, , T P L w p C J.mol-1 .K-1 -38.12 L w p b, J.mol-1.K-2 0.141 0 T L w 10-6 m3.mol-1 4.99644 * 0 0,P T L w h = T0,P0 I w
Table 5. Average deviation (in °C or K) of different approaches for predicting CPH equilibrium temperature
NaCl KCl NaCl-KCl CaCl2
Approach n°1 0.3 0.3 0.2 0.4
Approach n°2 0.2 0.1 0.1 0.2