HAL Id: hal-00728395
https://hal-ensta-bretagne.archives-ouvertes.fr/hal-00728395
Submitted on 7 Sep 2012
HAL is a multi-disciplinary open access
archive for the deposit and dissemination of
sci-entific research documents, whether they are
pub-lished or not. The documents may come from
teaching and research institutions in France or
abroad, or from public or private research centers.
L’archive ouverte pluridisciplinaire HAL, est
destinée au dépôt et à la diffusion de documents
scientifiques de niveau recherche, publiés ou non,
émanant des établissements d’enseignement et de
recherche français ou étrangers, des laboratoires
publics ou privés.
Model based classification of mine-like objects in
sidescan sonar using the highlight information
Ayda Elbergui, Isabelle Quidu, Benoit Zerr, Basel Solaiman
To cite this version:
Ayda Elbergui, Isabelle Quidu, Benoit Zerr, Basel Solaiman. Model based classification of mine-like
objects in sidescan sonar using the highlight information. ECUA 2012, Jul 2012, Edinburgh, United
Kingdom. �hal-00728395�
MODEL
BASED
CLASSIFICATION
OF
MINE-LIKE
OBJECTS IN SIDESCAN SONAR USING THE HIGHLIGHT
INFORMATION
A Elbergui, ENSTA Bretagne, STIC/OSM, Lab-STICC UMR CNRS 6285, 2 rue François
Verny, 29806 Brest Cedex 9, France
I Quidu, ENSTA Bretagne, STIC/OSM, Lab-STICC UMR CNRS 6285, Brest, France
B Zerr, ENSTA Bretagne, STIC/OSM, Lab-STICC UMR CNRS 6285, Brest, France
B Solaiman, TELECOM Bretagne, Image et Traitement de l'Information, Lab-STICC UMR CNRS 6285, Brest, France
1
INTRODUCTION
Since the emergence of very high resolution side-scan sonars, scientists work on the automation of the classification task in minehunting operations. This task was previously carried out by human operators but the amount of data is now too important to be processed manually only. The automation is not trivial because of a high level of noise inherent to sonar images and the large variability of sonar data [1,2]. The first developed systems in the field of minehunting were composed of detection and classification sub-systems in order to classify detected Mine Like Objects (MLOs) as mine or not mine without more details about the potential mine. For instance, Aridgides et al. [3] have developed a system that performs an adaptative clutter filtering to remove the background clutter and to enable the classification process to operate in optimum conditions. The Dobeck et al. system is based on two main processes: MLOs detection using matched filter and classification using K-nearest neighbour neural network and an optimal discriminatory filter classifier [4]. The Ciany et al. system is also made of a detection process which uses an adaptative thresholding technique followed by a classification of MLOs as mine or not mine using extracted geometric features [5].
The performance of these trained systems is dramatically improved by the fusion of their results. The main asset of fusion consists on the extraction of most important and discriminatory information from finite training data and hence reduces false alarms rate while maintaining a high probability of mine detection and classification [6,7,8,9,10,11,12,13].
The Ocean Systems Laboratory [14] has proposed a supervised algorithm which creates a large training data by placing synthetically targets in real side scan sonar imagery at random positions and orientations. This approach enabled the supervised algorithm to detect real MLOs in trials data. Such supervised systems require a large database to train the classifier. The result of classification is usually dependant on the training data set and may be altered if this one is very different from the test data [9]. It is not guaranteed to perform well when the seabed appearance, the range or the resolution is quite different from a typical condition for which the process works well [15].
Over the last ten years, other underwater target classification approaches have appeared which are unsupervised. The advantage of these approaches is the wide applicability with few requirements for the training stage. Reed et al. [1,16,17] proposed a novel model-based classification system. After an accurate segmentation of the detected object, the underlying physical shadow-forming process is used by a sidescan sonar simulator model for generating synthetic realizations for various classes of objects. The classification decision is then made using Dempster–Shafer theory that assigns a belief to each of the synthetic shadow representations taking into account the degree of match and the plausibility of the synthetic object’s parameters
Automated underwater target classification schemes rely on simulated data and not only experimental samples of target acoustic signature to train the classifier. Indeed trials are expensive and consequently real data are not sufficient to provide a realistic learning set.
To train the classifier, acoustic signatures are modelled for various manmade objects with different shapes (sphere, cylinder, trunked cone, Rockan, Artificial reef [18]). These simulated acoustic signatures are then compared with other simulated signatures or real signatures extracted from real high resolution images.
Proceedings of the 11 European Conference on Underwater Acoustics
We present here a model-based classification method. As it has been done for the shadow signature in [16,17], our classification method uses a model to simulate the acoustic highlight signature of targets in specific environmental conditions. The core of the simulation model is based on acoustical ray-tracing. Several phenomena have been considered to increase the realism of the acoustic signature (multi-path propagation, interaction with the surrounding seabed, edge diffraction, etc.) [19].
The highlight information is known to be variable and strongly dependant on the conditions of acquisition (environment, transmitted signal, ...), but like the shadow signature used until now, it provides a pertinent information that can be used as a reliable classification feature. The acoustic shadow gives information only on the geometric form of the object and has been widely used for underwater target recognition. Nevertheless, such classifier works well for the recognition of manmade objects like sphere, cylinder or trunked cone, it can be insufficient for natural objects. Moreover, performance depends on the quality of the shadow segmentation that can be hazardous in complex environments (in case of sand ripples in particular). For these reasons we propose a classification method based on the amplitude signal along a signal beam centred on the unknown object called A-scan.
Our model-based classifier has been assessed on both real and simulated data. By taking into account the environmental conditions, we first simulate acoustic signatures of various MLOs. Then a matched filter is used to find the most correlated A-scans.
2
OVERVIEW SIS (SONAR IMAGE SIMULATOR) MODEL
In earlier work we have developed a side-scan sonar image simulator which uses the traditional Lambert rule to calculate scattering from seabed and the Urick model [20] for scattering from target as the material (metal) is not Lambertian surfaces [21].
In the SIS model, each acoustical pulse is represented as a set of rays orthogonal to the wavefronts of the emitted signal. These rays are emitted through a range of angles from the transducer position in the three dimensional space, and their trajectories are traced until they interact with the predefined scene. Once the target or the seabed is shot by the acoustic wave, it scatters a part of energy back to the transducer.
The sonar beam represents the backscattered signal intensity in function of the time. Thus a complete image is built line by line from the backscattered energy recorded after each ping.
The two-way travel time and the intensity of the signal scattered back are calculated. These two values are used to generate one line in the simulated sonar image [19]. For the classification purpose, the temporal window covering the period from the beginning to the end of the target acoustic response is saved to enable an automatic extraction of the target acoustic signature.
3
UNDERWATER HIGHLIGHT BASED TARGET
CLASSIFICATION
The general appearance of the target acoustic signature varies slightly or considerably according to environmental and operational conditions. But if the acquisition conditions are fixed, one can limit the set of representative parameters. Usually, the sonar type and the specific parameters (frequency, sampling frequency, transmitted pulse duration and bandwidth, grazing angle, elevation, range) are known or can be deduced from sidescan images. Practically, underwater target classification problem depends only on the target shape, size, orientation relative to the sonar trajectory, the target position relative to the seabed (proud on the bottom, buried or suspended in the water column) and the seabed type.
To extract the region of interest (ROI), we have included in the SIS a labelling algorithm in order to save boundaries corresponding to each region (seabed or target). For real images we have extracted the ROI by using the same boundaries as for the simulated image in the same conditions as the real ones. To be sure not truncating the A-scan, the ROI includes a part from seabed before and after the real position of the highlight and shadow corresponding to the target to be classified. The second phase is to classify the object not only as Mine or not Mine but the presented method will give also the class of the object (sphere, cylinder, trunked cone, rockan or artificial reef) with correspondence likelihood. This is carried on by the following matched filter.
3.1 Matched Filtering Method
A matched filter is a correlator used to detect a deterministic signal in a noisy environment [22]. The matched filter is used to correlate the unknown A-scan with several known A-scans (templates) at varying scenarios. Theses templates are simulated by SIS for each class of objects with various orientations and sizes in the same operational conditions as for the unknown object. In other words, the training data set is made of a set of templates standing for different objects (MLOs and not MLOs) modelled in different scenarios (size, orientation, seabed type).
At the output of the matched filter system we keep the correlation coefficient that can be seen as maximum likelihood Li between the compared A-scans. This output is the classification criterion
used in this work.
In order to quantify the matching between the unknown A-scan and a given template (Templatei),
we correlate them. When the maximum likelihood Li exceeds a threshold T, we conclude that the
unknown object can belong to the corresponding target class.
The matched filter with the highest output will reveal the most probable class.
The second stage aims to correct the ambiguity and discriminate the two most likely classes by extending the initial training data set and including more A-scans belonging to these two object classes in different orientations and sizes. We note L1 the maximum likelihood for class C1 and L2 the maximum likelihood for the class C2.
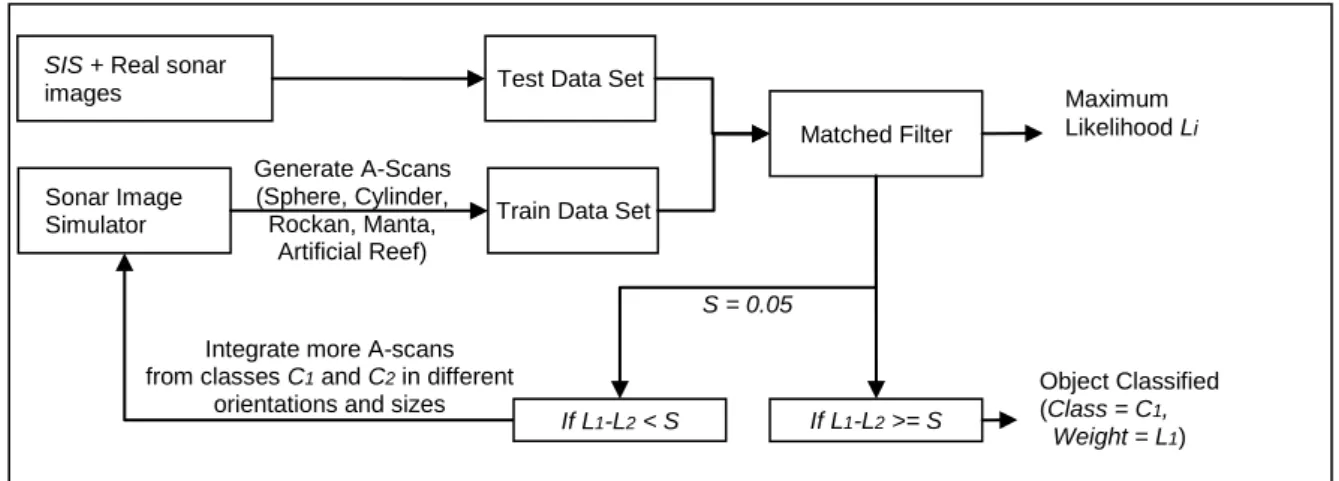
Both the threshold T and the minimum difference S are chosen empirically. We provide bellow a block diagram of the classification process (Figure 1).
3.2 Classification results
Most of data used in this paper were obtained using our Sonar Image Simulator but we will show also few results on real sonar data.
Real data set was obtained from the GESMA (France) and came from a joint trial between GESMA and DERA done on a rail near Lanvéoc (France) in 1998 [23].
The system used is mounted on the rail and slightly tilted downwards (6 degrees). The emitted signal is a LFM (Linear Frequency Modulation), the pulse duration is 4 milliseconds, and the bandwidth is 30 kHz going from 120 kHz to 180 kHz.
Simulated data was obtained by modelling a sidescan sonar operating in the same conditions than above. The distance to the object has been set to 45 meters. Different height maps for different types of real seabeds have been used in the simulation, i.e. fine sand, sand ripples, mud and rock. The classification experiment considers 5 man-made objects and a total of 60 sidescan sonar images (both real and simulated). 9 configurations for each target with a radial symmetry (Sphere and Manta), 13 configurations for more complex targets (Cylinder, Rockan, Artificial reef) including 4 different orientations. Furthermore 2 images are extracted from real data showing a Spherical mine and a Rockan mine. Please note that the operational conditions are the same for all simulated objects; we vary only the size and/or the orientation. All simulated templates are exclusive.
Figure 1: block diagram of the classification process
Sonar Image
Simulator Train Data Set
Generate A-Scans (Sphere, Cylinder, Rockan, Manta,
Artificial Reef)
SIS + Real sonar
images Test Data Set
Matched Filter S = 0.05 If L1-L2 < S If L1-L2 >= S Object Classified (Class = C1, Weight = L1) Maximum Likelihood Li
Integrate more A-scans from classes C1 and C2 in different
Proceedings of the 11 European Conference on Underwater Acoustics
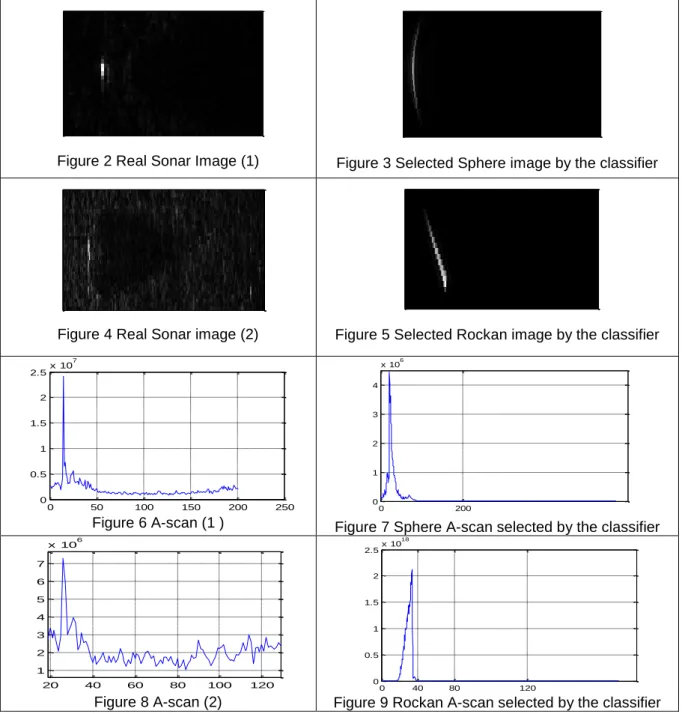
For each case we show the original sonar image and the corresponding A-scan versus the selected ones by the classification process (figure 3 and 4, figure 5 and 6, figure 7 and 8 and figure 9 and 10)
In the next classification results the class names are: Spherical Mine (SM), Cylinder Mine (CM), Manta Mine (MM), Rockan Mine (RM) and Artificial Reef (AR).
Class/Weight (% 1) Rank1 Rank2 Rank3 Rank4 Rank5
Spherical Mine SM/0.77 CM/0.75 MM/0.74 RM/0.70 AR/0.60
Rockan Mine RM/0.86 MM/0.73 CM/0.71 SM/0.65 AR/0.64
Tab 1 Classification results for the real GESMA/DERA data
For theses real data set the classification result is correct but the number of data is not sufficient to give a rate of good classification. The reason of this good result is the perfect knowledge on the operational conditions.
Figure 2 Real Sonar Image (1) Figure 3 Selected Sphere image by the classifier
Figure 4 Real Sonar image (2) Figure 5 Selected Rockan image by the classifier
Figure 6 A-scan (1 ) Figure 7 Sphere A-scan selected by the classifier
Figure 8 A-scan (2) Figure 9 Rockan A-scan selected by the classifier
0 50 100 150 200 250 0 0.5 1 1.5 2 2.5x 10 7 0 200 0 1 2 3 4 x 10⁶ 20 40 60 80 100 120 1 2 3 4 5 6 7 x 10⁶ 0 40 80 120 0 0.5 1 1.5 2 2.5x 10 18
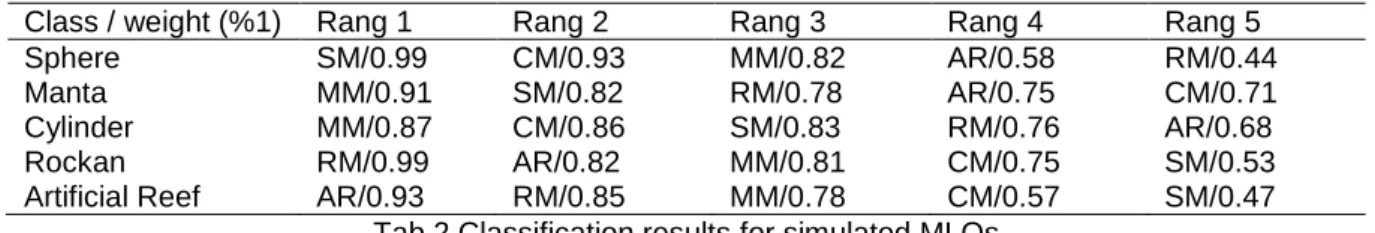
The table below illustrates both good and bad results for the simulated data set. In the presented example just one element from each object class in the test data set was selected.
For each element, an ordered list of classes and their weights are provided
Class / weight (%1) Rang 1 Rang 2 Rang 3 Rang 4 Rang 5
Sphere SM/0.99 CM/0.93 MM/0.82 AR/0.58 RM/0.44
Manta MM/0.91 SM/0.82 RM/0.78 AR/0.75 CM/0.71
Cylinder MM/0.87 CM/0.86 SM/0.83 RM/0.76 AR/0.68
Rockan RM/0.99 AR/0.82 MM/0.81 CM/0.75 SM/0.53
Artificial Reef AR/0.93 RM/0.85 MM/0.78 CM/0.57 SM/0.47
Tab 2 Classification results for simulated MLOs
The result presented in Tab 2 is obtained from a representative classification set in order to illustrate the different possibilities (objects well classified, objects misclassified, Ambiguities). For this set correct classification rate is equal to 0.87.
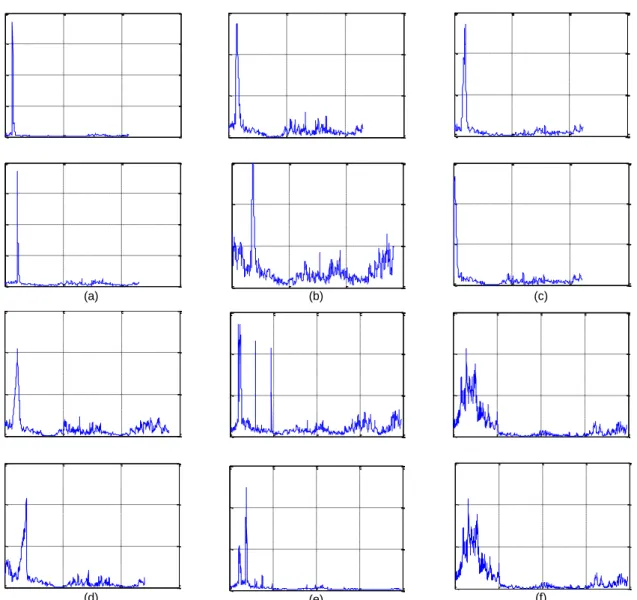
In the 3rd column the cylinder is classified as a Manta mine. This means that their two A-scans are very similar. Figure 11(c) present respectively the cylinder A-scan and the selected manta A-scan. A visual similarity is effectively noted between A-scans of the inclined cylinder and the manta. Furthermore, when we look at the list of ordered classes we found that the second most correlated class is the CM class and the difference between the two correlation coefficients is equal to 0.01. This difference is very small to be trusted and leads to a doubt in the reliability of this result. Hence, to correct this ambiguity and improve classifier performance a second stage is still under test. For each object class we present test images and their corresponding A-scans versus selected ones by the classifier (figure 10 and figure 11).
(a) (b) (c) (d) (e) (f)
Figure 10 Test images versus selected images (line-wise ordering). (a) Sphere, (b) Manta, (c) Inclined cylinder at the left and manta at the right, (d) Rockan, (e) Artificial reef, (f) Inclined artificial
Proceedings of the 11 European Conference on Underwater Acoustics
(a) (b) (c)
(d) (e) (f)
Figure 11 Unknown A-scans versus selected A-scans (column-wise ordering). (a) Sphere, (b) Manta, (c) Inclined cylinder at the top and manta at the bottom,(d) Rockan,(e) Artificial reef, (f)
Inclined artificial reef.
3.3 Classifier performance
Over 87% of man-made objects (MLOs and Not MLOs) were successfully classified in the first stage.
Tab 3 gives the confusion matrix, the highest confusion rate is for the cylinder classified as a Manta mine for some inclination directions. This problem may be resolved in the second proposed stage which consists in extending the initial training data set by including 10 others A-scans for each class from the two most likely classes.
0 500 1000 1500 0 0.5 1 1.5 2x 10 6 0 500 1000 1500 0 2 4 6x 10 5
0
500
1000
1500
0
2
4
6
x 10
5 0 500 1000 1500 0 0.5 1 1.5 2x 10 6 0 500 1000 1500 0 2 4 6x 10 5 0 500 1000 1500 0 2 4 6x 10 5 0 500 1000 1500 0 2 4 6x 10 5 0 500 1000 1500 2000 0 1 2 3x 10 4 0 500 1000 1500 2000 0 5000 10000 15000 0 500 1000 1500 0 2 4 6x 10 5 0 500 1000 1500 2000 0 2 4 6x 10 4 0 500 1000 1500 2000 0 5000 10000 15000C Sphere C Manta C Cylinder C Rockan C Artificial Reef
Sphere 1 0 0 0 0
Manta 0 1 0 0 0
Cylinder 0 0.2 0.8 0 0
Rockan 0 0 0.08 0.92 0
Artificial Reef 0 0 0.12 0 0.87
In the 2nd line the Manta is not confused with any other MLOs not even the Cylinder. This is not contradictory with the 3rd line since the Manta is a radial object while the cylinder is not. The confusion occurs then in the specific case when the test image is an inclined cylinder in a specific direction not exactly represented in the data set where all elements are distinct.
4
DISCUSSION AND ONGOING WORK
This paper has presented a novel model based classifier which uses highlight information in the target acoustic signature. A matched filtering based model was implemented to allow more flexible classification result based on the maximum likelihood.
To train the classifier, a data base was created using target acoustic signatures of manmade objects, some with complex shapes (Artificial reef). Our sonar image simulator has been used to generate a training data set of A-scans.
Each A-scan from the test data set was correlated with all A-scans in the train data set in order to find the A-scan having the highest correlation coefficient allowing a classification. In a first phase, the corresponding class to this selected A-scan is defined as the most likely one. At this phase the correct classification rate was over 87%. If the difference between the correlation coefficients of the two most likely classes is less than 0.05 the result is considered ambiguous and must be verified in a second phase. In the second phase we intend to use a decision support algorithm in order to select accurate parameters for the further A-scans. Generally, combining classification methods using highlight and shadow could considerably enhance underwater target classification.
Results were presented on both real sidescan sonar images and simulated images. These results show that the proposed approach is promising when the operational conditions under which images were gathered are well known.
We have shown in this paper that highlight information can be used and gives in most cases good classification results. However we shall experiment other real sidescan sonar data for manmade and natural objects to improve our classifier accuracy.
ACKNOWLEDGEMENTS
The authors of this paper would like to thank GESMA, a division of the French Ministry of Defense (DGA) for providing the real synthetic aperture data used to assess our method.
REFERENCES
1. S. Reed, Y. Petillot and J. Bell, An automatic approach to the detection and extraction of mine features in sidescan sonar, IEEE J.Oceanic.Eng. 28(1), 90-105. (2003).
2. Y. Petillot, S. Reed and E. Coiras, A Framework for Evaluating Underwater Mine Detection and Classification Algorithms using Augmented Reality, Proc. Undersea Defence Technology. (2006).
3. T. Aridgides, M. Fernandez and G.J Dobeck, Adaptive 3-dimensional range-crossrange-frequency filter processing string for sea mine classification in side scan sonar imagery, Proc. SPIE, Vol. 3079, 111-122. (1997).
4. G.J. Dobeck, J.C. Hyland and L. Smedley, Automated detection and classification of sea mines in sonar imagery, Proc. SPIE, Vol. 3070, 90-110. (1997).
5. C.M Ciany, and J. Huang, Computer aided detection/computer aided classification and data fusion algorithms for automated detection and classification of underwater mines, Proc. OCEANS, Vol. 1, 277-284. (2000).
6. J. Huang, C. Ciany, M. Broadman and S. Doran, Data fusion of computer aided detection/computer aided classification algorithms for classification of mines in very shallow water environments, Proc. SPIE, Vol. 4038, 413-420. (2000).
7. G.J Dobeck, Algorithm fusion for automated sea mine detection and classification, Proc. MTS/IEEE OCEANS, Vol. 1, 130-134. (2001).
Proceedings of the 11 European Conference on Underwater Acoustics
8. C.M. Ciany, and W.C Zurawski, Performance of fusion algorithms for Computer Aided Detection and classification of bottom mines in the shallow water environment, Proc. OCEANS, Vol. 4, 2164-2167. (2002).
9. C.M Ciany, W.C. Zurawski, G.J. Dobeck, and D.R. Weilert, Real-time performance of fusion algorithms for computer aided detection and classification of bottom mines in the littoral environment, Proc. OCEANS, Vol. 2, 1119-1125. (2003).
10. T. Aridgides, M. Fernández and G. Dobeck, Fusion of adaptive algorithms for the classification of sea mines using high resolution side scan sonar in very shallow water, Proc. MTS/IEEE OCEANS, Vol. 1, 135-142. (2001).
11. T. Aridgides, M. Fernández, G. J. Dobeck, Recent processing string and fusion algorithm improvements for automated sea mine classification in shallow water, Proc. SPIE, Vol. 5089, 65-76. (2003).
12. B. Zerr , J. Fawcett, D. Hopkin, Adaptive algorithm for sea mine classification, Proc. 3d UAM, Nafplion, Greece. (2009).
13. S.N. Geethalakshmi , P. Subashini ,P. Geetha, A study on detecting and classifying underwater mine like objects using image processing techniques, International J. Comput.Sci.Eng (IJCSE), 3(10), 3359-3366. (October 2011).
14. E. Coiras, P.-Y. Mignotte, Y. Petillot, J. Bell and K. Lebart, Supervised target detection and classification by training on augmented reality data, IET Radar Sonar & Navig. 1 (1) 83-90. (2007).
15. P. Chapple, Automated Detection and Classification in High-resolution Sonar Imagery for Autonomous Underwater Vehicle Operations, Proc SPIE. (2008).
16. S. Reed, Y. Petillot, and J. Bell, Automated approach to classification of mine-like objects in sidescan sonar using highlight and shadow information, IEE Proc.-Radar Sonar Navig., Vol.
151, No. 1. (2004).
17. S. Reed, Y. Petillot, and J. Bell, Model-based approach to the detection and classification of mines in sidescan sonar, Applied Optics 43(2), 237-246. (2004).
18. J. Beurois, Valorisation de la baie du PRADO au moyen de récifs artificiels, Operation report « Récifs PRADO », Marseille, France (2005).
19. A. Elbergui, I. Quidu, B. Zerr, Model based target classification for high frequency – high resolution imaging sonar, Proc. 4th UAM, Kos, Greece (2011).
20. R.J. Urick, Principles of Underwater Sound, McGraw-Hill (1983); Sound Propagation in the Sea, Peninsular Publishing (1982).
21. J.M. Bell, A model for the simulation of sidescan sonar, PHD thesis, Heriot Watt University, (1995).
22. D.O North, An analysis of the factors which determine signal/noise discrimination in pulsed carrier systems, Proc. IEEE, Vol. 51, 1016-1027. (1963).
23. T.J. Sutton, H.D. Griffiths, A. Hétet, Y.Perrot, S.A.Chapman, Experimental validation of autofocus algorithms for high resolution imaging of the seabed using synthetic aperture sonar, Proc IEE. Radar, Sonar and Navigation, Vol.150, No. 2. (2003).