HAL Id: inria-00555610
https://hal.inria.fr/inria-00555610
Submitted on 14 Jan 2011
HAL is a multi-disciplinary open access
archive for the deposit and dissemination of
sci-entific research documents, whether they are
pub-lished or not. The documents may come from
teaching and research institutions in France or
abroad, or from public or private research centers.
L’archive ouverte pluridisciplinaire HAL, est
destinée au dépôt et à la diffusion de documents
scientifiques de niveau recherche, publiés ou non,
émanant des établissements d’enseignement et de
recherche français ou étrangers, des laboratoires
publics ou privés.
Self-Adaptive Distributed Data Management System
Alexandra Carpen-Amarie, Alexandru Costan, Jing Cai, Gabriel Antoniu, Luc
Bougé
To cite this version:
Alexandra Carpen-Amarie, Alexandru Costan, Jing Cai, Gabriel Antoniu, Luc Bougé. Bringing
In-trospection into BlobSeer: Towards a Self-Adaptive Distributed Data Management System.
Interna-tional Journal of Applied Mathematics and Computer Science, University of Zielona Góra 2011, 21
(2), pp.229-242. �10.2478/v10006-011-0017-y�. �inria-00555610�
BRINGING INTROSPECTION INTO BLOBSEER: TOWARDS A
SELF-ADAPTIVE DISTRIBUTED DATA MANAGEMENT SYSTEM
ALEXANDRACARPEN-AMARIE∗, ALEXANDRUCOSTAN∗∗, JINGCAI∗∗∗, GABRIELANTONIU∗, LUCBOUGÉ∗∗∗∗
∗INRIA Rennes - Bretagne Atlantique, France, e-mail:{alexandra.carpen-amarie,gabriel.antoniu}@inria.fr ∗∗University Politehnica of Bucharest, e-mail:[email protected]
∗∗∗City University of Hong Kong, e-mail:[email protected]
∗∗∗∗ENS Cachan/Brittany, IRISA, Rennes, France, e-mail:[email protected]
Introspection is the prerequisite of an autonomic behavior, the first step towards a performance improvement and a resource-usage optimization for large-scale distributed systems. In Grid environments, the task of ob-serving the application behavior is assigned to monitoring systems. However, most of them are designed to provide general resource information and do not consider specific information for higher-level services. More precisely, in the context of data-intensive applications, a specific introspection layer is required to collect data about the usage of storage resources, about data access patterns, etc. This paper discusses the requirements for an introspection layer in a data-management system for large-scale distributed infrastructures. We focus on the case of BlobSeer, a large-scale distributed system for storing massive data. The paper explains why and how to enhance BlobSeer with introspective capabilities and proposes a three-layered architecture relying on the MonALISA monitoring framework. We illustrate the autonomic behavior of BlobSeer with a self-configuration component aiming to provide storage elasticity by dynamically scaling the number of data providers. Then we propose a preliminary approach for enabling self-protection for the BlobSeer system, through a malicious clients detection component. The introspective architecture has been evaluated on the Grid’5000 testbed, with experiments that prove the feasibility of generating relevant information related to the state and the behavior of the system.
Keywords:distributed system, storage management, large-scale system, monitoring, introspection.
1. Introduction
Managing data at a large scale has become a crit-ical requirement in a wide spectrum of research domains, ranging from data-mining to high-energy physics, biology or climate simulations. Grid in-frastructures provide the typical environments for such data-intensive applications, enabling access to a large number of resources and guaranteeing a pre-dictable Quality of Service. However, as the expo-nentially growing data is correlated with an increas-ing need for fast and reliable data access, data man-agement continues to be a key issue that highly im-pacts on the performance of applications.
More specifically, storage systems intended for
very large scales have to address a series of chal-lenges, such as a scalable architecture, data loca-tion transparency, high throughput under concur-rent accesses and the storage of massive data with fine grain access. Although these requirements are the prerequisites for any efficient data-management system, they also imply a high degree of complexity in the configuration and tuning of the system, with possible repercussions on the system’s availability and reliability.
Such challenges can be overcome if the system is outfitted with a set of self-management mechanisms that enable autonomic behavior, which can shift the burden of understanding and managing the system state from the human administrator to an automatic
decision-making engine. However, self-adaptation is impossible without a deep and specific knowledge of the state of both the system and the infrastruc-ture where the system is running on. It heavily relies on introspection mechanisms, which play the crucial role of exposing the system behavior accurately and in real time.
On existing geographically-distributed plat-forms (e.g. Grids), introspection is often limited to low-level tools for monitoring the physical nodes and the communication interconnect: they typically provide information such as CPU load, network traf-fic, job status, file transfer status, etc. In general, such low-level monitoring tools focus on gathering and storing monitored data in a scalable and non-intrusive manner (Zanikolas and Sakellariou, 2005).
Even though many Grid monitoring applica-tions have been developed to address such general needs (Massie et al., 2004) (Gunter et al., 2000), lit-tle has been done when it comes to enabling in-trospection for large-scale distributed data manage-ment. This is particularly important in the context of data-intensive applications distributed at a large scale. In such a context, specific parameters related to data storage need to be monitored and analyzed in order to enable self-optimization in terms of re-source usage and global performance. Such parame-ters regard physical data distribution, storage space availability, data access patterns, application-level throughput, etc.
This paper discusses the requirements of a large-scale distributed data-management service in terms of management. It explains which self-adaptation directions can serve a data-management service designed for large-scale infrastructures. Fur-thermore, it focuses on introspection, identifying the specific ways in which introspection can be used to enable an autonomic behavior of a distributed data storage system.
As a case study, we focus on BlobSeer (Nicolae
et al., 2010), a service for sharing massive data at very large scale in a multi-user environment. We propose a three-layered architecture enabling Blob-Seer with introspection capabilities. We validate our approach through an implementation based on the generic MonALISA (Legrand et al., 2004) monitor-ing framework for large-scale distributed services. Moreover, we provide two applications for the intro-spection layer, targeting configuration and self-protection, which take advantage of the introspec-tive features that BlobSeer is equipped with.
The remainder of the paper is organized as fol-lows. Section 2 summarizes existing efforts in the Grid monitoring systems field, emphasizing their limitations when it comes to enabling specific
in-trospection requirements. Section 3 explains which self-management directions fit the needs of data-management systems. Section 4 provides a brief de-scription of BlobSeer and describes the specific in-trospection mechanism that we designed and im-plemented and the data that need to be collected in such a data-management system. Section 5 presents the applications of the introspective features of Blob-Seer, namely a self-configuration module dealing with storage elasticity and the preliminary steps to-wards a self-protection component. In Section 6 we discuss the feasibility and efficiency of our approach, by presenting a visualization tool and a set of experi-ments realized on the Grid’5000 testbed. Finally, Sec-tion 7 draws conclusions and outlines direcSec-tions for future developments.
2. Related work
The autonomic behavior of large scale distributed systems aims to deal with the dynamic adapta-tion issues by embedding the management of com-plex systems inside the systems themselves, allevi-ating the users and administrators from additional tasks. A distributed service, like a storage service, is said to be autonomic if it encapsulates some au-tonomic behavior (Gurguis and Zeid, 2005) such as self-configuration, self-optimization, self-healing, and self-protection (Kephart and Chess, 2003).
In this context, performance evaluation be-comes a critical component of any dynamic sys-tem that requires high throughput, scheduling, load balancing or analysis of applications’ performances and communications between nodes. In Grid en-vironments, previous research has often limited to using historical information to create models on which various analysis and mining techniques are applied. The results were thereafter used for per-forming more efficient job mappings on available re-sources. The autonomic behavior depends on mon-itoring the distributed system to obtain the data on which decisions are based. Experience with produc-tion sites showed that in large distributed systems with thousands of managed components, the pro-cess of identifying the causes of faults in due time by extensive search through the potential root fail-ure injectors proves rather time-consuming and dif-ficult. This process may interrupt or obstruct impor-tant system services. Several techniques were used to address these issues.
One approach relies on Bayesian Networks (BNs) (Cowell et al., 1999), often used to model systems whose behaviors are not fully understood. We investigated some consistent work already done on the probabilistic management in distributed
sys-tems. Hood et. al utilize Bayesian networks for the proactive detection of abnormal behavior in a distributed system (Hood and Ji, 1997). Steinder et al. apply Bayesian reasoning techniques to per-form fault localization in complex communication systems (Steinder and Sethi, 2004). Ding et al. present the probabilistic inference in fault manage-ment based on Bayesian networks (Ding et al., 2004). However, the Bayesian Network paradigm used within all these works does not provide direct mech-anisms for modeling the temporal dependencies in dynamic systems (Santos and Young, 1999), which is essential for enhancing the autonomic behavior.
Another approach takes time into consideration by identifying the dynamic changes in distributed systems as a discrete nonlinear time series. Previ-ous research work on scalable distributed monitor-ing for autonomous systems can be broadly classi-fied into two categories: relying on decentralized ar-chitectures such as hierarchical aggregation (Van Re-nesse et al., 2003) or peer-to-peer structure (Albrecht
et al., 2005) to distribute monitoring workload; and trading off information coverage (Liang et al., 2007) or information precision (Jain et al., 2007) for lower monitoring cost. In contrast, our research focuses on identifying the relevant parameters for an auto-nomic introspection layer, while relying on the ex-tension and adaptation of some existing monitoring tools for tracking these parameters. The monitor-ing solution should further meet our needs for non-intrusiveness and minimized monitoring costs.
Exploring correlation patterns among dis-tributed monitoring data sources has been exten-sively studied in various contexts such as sensor network monitoring (Vuran and Akyildiz, 2006), distributed event tracking (Jain et al., 2004), and resource discovery (Cardosa and Chandra, 2008). While the general idea of exploring temporal and spatial correlations is not new, we shall emphasize applying the idea to distributed information track-ing over large-scale networked systems requires non-trivial system analysis and design. In our case, it means discovering dynamic correlation patterns (for some predefined targeted events: node failures, malicious clients intrusions, etc.) among distributed information sources, using light-weight methods in-stead of assuming a specific probabilistic model, as in wireless sensor networks, for instance.
The works mentioned above, although they are able to provide some means of monitoring for sin-gular or aggregate services, they do not dynamically replace the faulty service once failure has been de-tected, or take automated actions to optimize the overall system’s performance, as our work aims to within a large scale distributed storage system.
3. Self-adaptation for large scale
data-management systems
A large scale data-management platform is a com-plex system that has to deal with changing rates of concurrent users, the management of huge data spread across hundreds of nodes or with malicious attempts to access or to damage stored data. There-fore, such a system can benefit from a self-adaptation component that enables an autonomic behavior. We refine the set of self-adaptation directions that best suit the the requirements of data-management sys-tems: they match the main self-management prop-erties defined for autonomic systems (Kephart and Chess, 2003) (Parashar and Hariri, 2005).
Self-awareness is the feature that enables a
sys-tem to be aware of the resource usage and the state of its components and of the infrastructure where they are running. This is mainly achieved through monitoring and interpreting the rele-vant information generated by the usage of the system.
Self-optimization is the ability to efficiently allocate
and use resources, while dealing with changing workloads. It aims at optimizing the system’s performance and increasing data availability.
Self-configuration is the property that addresses
the dynamic adaptation of the system’s deploy-ment scheme as a response to changing environ-ment conditions. The system has to be able to reconfigure on the fly, when its state requires or allows for a change in the number of managed nodes.
Self-protection addresses the detection of hostile or intrusive actions directed towards the system’s components and enables the system to automat-ically take appropriate measures to enforce se-curity policies and make itself less vulnerable to subsequent similar attacks.
In order to improve the performance and the ef-ficiency of the resource usage in a data-sharing sys-tem, we define a set of goals that justify the need for the aforementioned properties:
Monitoring. The constant surveillance of the state
of a system and of the events that trigger sys-tem reactions is the prerequisite of all the other self-adaptation directions. Thus, the self-awareness property is of utmost importance for providing sup-port for an autonomous behavior.
(a) The architecture of the BlobSeer system (b) The architecture of the introspective BlobSeer Fig. 1. BlobSeer
Dynamic dimensioning. The performance of data-access primitives is influenced by the number of run-ning nodes of the data-sharing system. Moreover, the load of each component that stores data is also dependent on the available storage nodes and on their capacity to serve user requests. On the other hand, the workload is often unpredictable, and the deployment of the system on a large number of physical nodes can lead to underused storage nodes when the number of clients is low or the stored data is not large enough. These reasons account for the need to enhance a large-scale storage system with a mechanism that dynamically adjusts the number of deployed storage nodes. This is equivalent to tak-ing advantage of the real-time indicators of the state of the system within a self-configuration component that can observe a heavy load or underutilized com-ponents.
Malicious clients detection. A data-sharing
sys-tem distributed on a large number of nodes can fit the needs of applications that generate important amounts of data only if it can provide a degree of security for the stored information. For this reason, the system has to be able to recognize malicious re-quests generated by unauthorized users and to block illegal attempts to inject or to modify data. There-fore, a self-protection component that enforces these requirements has to be integrated into the system.
4. Towards an introspective BlobSeer
BlobSeer is a data-sharing system which addresses the problem of efficiently storing massive, unstruc-tured data blocks called binary large objects (referred to asBLOBs further in this paper), in large-scale,dis-tributed environments. The BLOBs are fragmented
into small, equally-sized chunks. BlobSeer provides
an efficient fine-grained access to the chunks belong-ing to eachBLOB, as well as the possibility to modify
them, in distributed, multi-user environments.
4.1. Architecture. The architecture of BlobSeer
(Figure 1(a)) includes multiple, distributed enti-ties. Clients initiate allBLOBoperations: CREATE,
READ, WRITE and APPEND. There can be many
concurrent clients accessing the sameBLOB or
dif-ferent BLOBs in the same time. The support for
concurrent operations is enhanced by storing the chunks belonging to the same BLOB on multiple
storage providers. The metadata associated with each
BLOBare hosted on other components, called
meta-data providers. BlobSeer provides versioning support, so as to prevent chunks from being overwritten and to be able to handle highly-concurrentWRITE and APPENDoperations. For each of them, only a patch
composed of the range of written chunks is added to the system. Finally, the system comprises two more entities: the version manager that deals with the serialization of the concurrentWRITE/APPEND
requests and with the assignment of version num-bers for each newWRITE/APPEND operation; the
provider manager, which keeps track of all storage providers in the system.
A typical setting of the BlobSeer system in-volves the deployment of a few hundreds storage providers, storing BLOBs of the order of the TB. The typical size for a chunk within a blob can be smaller that 1 MB, whence the challenge of deal-ing with hundreds of thousands of chunks belong-ing to just one BLOB. BlobSeer provides efficient
support for heavily-concurrent accesses to the stored data, reaching a throughput of 6.7 GB/s aggregated bandwidth for a configuration with 60 metadata providers, 90 data providers and 360 concurrent writers, as explained in (Nicolae et al., 2009).
4.2. Introspection mechanisms on top of BlobSeer.
We enhanced BlobSeer with introspection capabil-ities, in order to enable this data-sharing platform with an autonomic behavior. In (Carpen-Amarie
et al., 2010), we present the three-layered architec-ture we designed to identify and generate relevant information related to the state and the behavior of the system (Figure 1(b)). Such information is then expected to serve as an input to a higher-level
self-adaptationengine. These data are yielded by an (1)
introspectionlayer, which processes the raw data col-lected by a (2) monitoring layer. The lowest layer is represented by the (3) instrumentation code that en-ables BlobSeer to send monitoring data to the upper layers.
4.2.1. Introspection: what data to collect?. The
self-adaptation engine can only be effective if it re-ceives accurate data from the introspection layer. The latter generates data ranging from general informa-tion about the running nodes to specific data regard-ing the storedBLOBs and their structure.
General information.These data are essentially
concerned with the physical resources of the nodes that act as storage providers. They include CPU usage, network traffic, disk usage, storage space or memory. A self-adapting system has to take into ac-count information about the values of these param-eters across the nodes that make up the system, as well as about the state of the entire system, by means of aggregated data. For instance, the used and avail-able storage space at each single provider play a cru-cial role in deciding whether additional providers are needed or not.
IndividualBLOB-related data. The most
sig-nificant information for a single BLOBis its access
pattern, i.e. the way the chunks and the versions are accessed throughREADandWRITEoperations.
The basic data are the number of read accesses for each chunk that the BLOBversion consists of, and
the number ofWRITEoperations performed on the BLOBfor each chunk. These data facilitate the
iden-tification of the regions of the BLOB comprising
chunks with a similar number of accesses, informa-tion that can influence the adopted replicainforma-tion strat-egy.
Global state. Even though the
provider-allocation algorithm has access to the details within each BLOB, it is essential to have an overview of
the whole data stored in the BlobSeer system, from a higher-level point of view. Some of the key data at this global level are the total number of accesses associated with each provider. This is a measure of the load of each of them and can directly influence
the selection of the providers that will be allocated new chunks, depending on their deviation from the average load within the system.
4.2.2. Monitoring: how to collect?. The input for the introspective layer consists of raw data that are extracted from the running nodes of BlobSeer, col-lected and then stored, a set of operations realized within the monitoring layer. Therefore, it can rely on a monitoring system designed for large-scale en-vironments that implements these features. Such a monitoring framework has to be both scalable and extensible, so as to be able to deal with the huge number of events generated by a large-scale data-management system, as well as to accommodate system-specific monitoring information and to offer a flexible storage schema for the collected data.
The monitoring framework – MonALISA. The Global Grid Forum (GGF, 2010) proposed a Grid Monitoring Architecture (GMA) (Tierney et al., 2002), which defines the components needed by a scalable and flexible Grid monitoring sys-tem: producers, consumers, and a directory ser-vice. A wide variety of Grid monitoring sys-tems (Zanikolas and Sakellariou, 2005), such as Gan-glia (Massie et al., 2004), RGMA (Cooke et al., 2004), GridICE (Andreozzia et al., 2005), comply with this architecture.
Among them, we selected MonALISA
(Moni-toring Agents in a Large Integrated Services Architec-ture) (Legrand et al., 2004) for our data-monitoring tasks, as it is a general-purpose, flexible frame-work, which provides the necessary tools for col-lecting and processing monitoring information in large-scale distributed systems. Moreover, it is an easily-extensible system, which allows the definition and processing of user-specific data, by means of an API for dynamically-loadable modules. MonAL-ISA is currently used to monitor large high-energy physics facilities; it is deployed on over 300 sites be-longing to several experiments, such as CMS or AL-ICE (ALAL-ICE, 2010).
In BlobSeer, the main challenge the monitoring layer has to cope with, is the large number of stor-age provider nodes and therefore the huge num-ber ofBLOBchunks, versions and hugeBLOBsizes.
Furthermore, it has to deal with hundreds of clients that concurrently access various parts of the stored
BLOBs, as they generate a piece of monitoring
in-formation for each chunk accessed on each provider. MonALISA is suitable for this task, as it is a system designed for large-scale environments and it proved to be both scalable and reliable.
Instrumenting BlobSeer. The data generated by
the instrumentation layer are relayed by the mon-itoring system and finally fed to the introspection layer. The instrumentation layer is implemented as a component of the monitoring layer. The MonALISA framework provides a library called ApMon that can be used to send the monitoring data to the MonAL-ISA services. At the providers, the instrumentation code consists in listeners located on each of them, which report to the monitoring system each time a chunk is written or read. The monitoring informa-tion from the version manager is collected using a parser that monitors the events recorded in the logs. The state of the physical resources on each node is monitored through an ApMon thread that periodi-cally sends data to the monitoring service.
5. Introducing self-adaptation for
Blob-Seer
To introduce an autonomic behavior in BlobSeer, we investigated two directions. The first approach aims at enhancing BlobSeer with self-configuration capabilities, as a means to support storage elastic-ity trough dynamic deployment of data providers. The second direction addresses the self-protection of BlobSeer from malicious clients by detecting and re-acting to potential threats in real-time based on the information yielded by the introspection layer. In this section, we detail these two approaches.
5.1. Self-configuration through dynamic data providers deployment. Dynamic dimensioning is
a means to achieve the self-configuration of Blob-Seer, by enabling the data providers to scale up and down depending on the detected system’s needs. The component we designed adapts the storage sys-tem to the environment by contracting and expand-ing the pool of storage providers based on the sys-tem’s load.
The key idea of the Dynamic Data Providers De-ployment component is the automatic decision that has to be made on how many resources the sys-tem needs to operate normally while keeping the re-sources utilization down to a minimum. This prob-lem is addressed by using a test-decided heuristic based on the monitoring data. The system maintains two pools of providers:
Active Pool of Providers (APP) - pool of providers
that are currently on and are actively used by the BlobSeer infrastructure.
Backup Pool of Providers (BPP) - pool of providers
that are currently off, waiting in stand-by to be activated in order to be used.
Fig. 2. The Dynamic Deployment module’s architectural overview
The goal is to dynamically switch providers from one pool to another when certain conditions are met, in order to optimize resource usage; instead of re-serving a large number of nodes which eventually are not effectively used, the system only relies on the APP and self-adapts its execution using the BPP.
5.1.1. Architectural Overview. The dynamic
de-ployment decision is based on retrieving the mon-itoring data and computing a score that evaluates the status of each provider. The monitoring data is retrieved from two different sources, each one with specific metrics: BlobSeer-related data and physical resources information. These data are stored and processed using a Monitoring Repository. Based on the retime monitoring information the decision al-gorithm computes a heuristic score. Its value deter-mines the decision of removing or adding a node to the active pool of providers.
A first step involves taking the deployment de-cision based on retrieving the monitoring data and computing a score that evaluates the status of each provider. The monitoring data is retrieved from two different sources, each one with specific metrics: BlobSeer related data and physical resources infor-mation. These data are stored and processed using a Monitoring Repository. Based on the real-time moni-toring information the decision algorithm computes a heuristic score. Its value determines the decision of removing or adding a node to the active pool of providers.
In order to take the corresponding action based on the result obtained, the application needs to get a list of available nodes (Data Providers) from the Provider Manager which can be turned on or off, de-pending on the decision taken. This part is also re-sponsible for notifying the BlobSeer system, specifi-cally the Provider Manager, of the changes made in
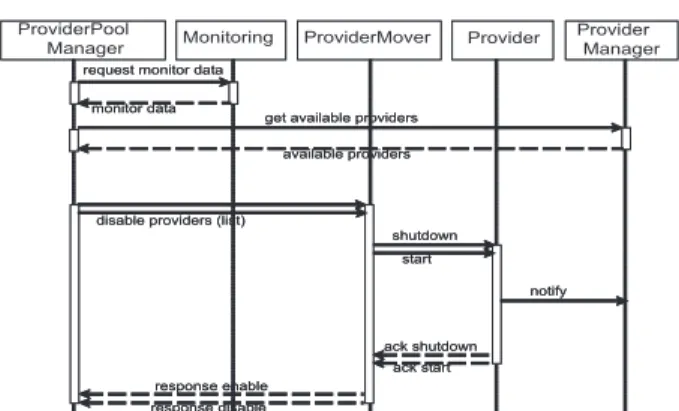
Fig. 3. The sequence diagram of the dynamic providers deployment
the system.
The main actors of the Dynamic Deployment service are the decision taking component (the ProviderPoolManager) and the decision enforce-ment component (the ProviderMover), as depicted in Figure 2. The ProviderPoolManager analyzes the monitoring information and using some config-urable policies takes the decision of either enabling or disabling a set of Data Providers. The Provi-derMover is responsible with putting this decision into practice by moving a provider from the Active Pool of Providers to the Backup Pool of Providers or vice-versa, depending on what commands it re-ceives from the ProviderPoolManager.
The interaction with the BlobSeer’s Provider Manager is represented by requests for the list of the active Data Providers running in the system at a specific moment in time. The ProviderPoolManager reads the coordinates of the Provider Manager and contacts it to obtain a list of tuples(host, port) that point to the nodes where Data Providers are active. The ProviderMover also manages the two pools, APP and BPP, and the Providers’ migra-tion between them. The ProviderMover notifies the Provider Manager of a change in the APP. If the noti-fication fails, the ProviderMover doesn’t retry it, re-lying on the watchdog facility implemented in Blob-Seer, which scans the entire list of Providers to track the active providers. Finally, the ProviderMover communicates directly with the Data Providers and issues the start or shutdown commands through which a Provider is moved from BPP to APP or from APP to BPP, respectively.
The sequence diagram depicted in Figure 3 il-lustrates the flow of actions within the Dynamic Deployment module. The monitoring data is re-trieved continuously, as a separate process by the monitoring module, and is stored into a monitoring repository. The ProvidePoolManager connects to the
Provider Manager to get the list of active providers. Once this data is obtained, the Pool Manager starts computing a score for each provider. Based on a con-figuration file specifying the targeted scenarios and the heuristic used, a decision is taken and communi-cated to the ProviderMover. This, in turn, calls the scripts that start or stop a particular provider.
5.1.2. Heuristic Providers Evaluation. The
scor-ing algorithm provides a method to detect which providers should be moved from APP to BPP. The factors to be taken into consideration and tracked using the introspection layer can be divided into two subcategories: physical factors (depending on the physical node that runs the Provider, e.g., the free disk space, the average bandwidth usage, the CPU load or the system uptime) and BlobSeer factors (met-rics referring to the BlobSeer behavior, e.g., the num-ber of read/write accesses per time unit, the size of stored chunks andBLOBs, the replication degree).
We illustrate this approach with a common sce-nario identified by the Dynamic Providers Deploy-ment module and treated accordingly by stopping the unnecessary providers. In this case, if the intro-spection layer detects that on one provider the free disk space is above the 70% threshold, the replica-tion factor for the stored chunks is greater than 1, with a small read and write access rate (e.g. less than one access per hour), it decides to shut down the provider. All the values referred to above are adjustable through a configuration file. The current values were chosen based on a set of performance evaluation experiments aiming to identify the trade-off between the costs of shutting down one provider and moving its data to another one, and the bene-fits of using less resources. The scenario illustrates the case of a provider with extra disk space avail-able, that is not used by clients. Considering all the stored data is also replicated on other providers, it is reasonable to shut down this provider in order to efficiently use the available resources. The stopping decision is only taken when the shutting down costs are smaller and there are available nodes where to transfer the data in order to preserve the replication factors.
The self-configuration engine is not limited to detecting this type of scenarios, several other pat-terns are identifiable using a simple specification mechanism. The conditions making up the scenarios are modeled as factors, used to compute a score for each provider. The heuristic used in the score com-putation is based on weight factors using the
follow-Algorithm 1Scaling down data providers.
1: procedureSCALING_DOWN(DataProvidersList)
2: for allDataProvider in DataProvidersList do
3: RetriveMonitoringData(DataProvider) 4: S←ComputeScore(DataProvider) 5: ifS<scoreThreshold then
6: Keep DataProvider in APP 7: else
8: if DataReplicationDegree >
replicationThreshold then
9: Move DataProvider to BPP
10: AvailableProviders ← retrieve available providers from the Provider Manager 11: TransferDataTo(AvailableProviders) 12: Update the metadata
13: ShutDown(DataProvider) 14: else
15: Keep DataProvider in APP
16: end if 17: end if 18: end for 19: end procedure ing formula: S= n
∑
i=1 w f ti∗wc fi (1)where w f tirepresents the weight of the factor i from
the total score and wc fi represents the weight of the
true condition from the factor i. With these notations the pseudo-code for scaling down data providers is presented in Algorithm 1.
5.2. Self-protection through malicious clients de-tection. Detecting malicious clients is the first step
towards enabling self-protection for the BlobSeer system. Such a feature has to take into account sev-eral types of security threats and to react when such attacks occur.
In this section, we propose a simple malicious clients detection mechanism that focuses on protocol breaches within BlobSeer, as this is a critical vulnera-bility of a data-management system that enables the clients to directly access the data storage nodes in or-der to provide very efficient data transfers. The goal of the detection component is to identify the known forms of protocol misuse, and thus to help the sys-tem to maintain the stored data in a consistent state.
5.2.1. Protocol breach scenarios for BlobSeer. A
malicious user can try to compromise the system by deliberately breaking the data-insertion protocols.
Algorithm 2Data-writing step.
1: procedureWRITE_DATA(buffer, offset, size)
2: wid←generate unique write id 3: noCh← ⌈size/chSize⌉
4: P←getnoChproviders from provider
man-ager 5: D←∅
6: for all0≤i<noCh in parallel do 7: cid←generate unique chunk id 8: chOffset←chSize∗i
9: storebuffer[chOffset .. chOffset+chSize] as chunk (cid,wid) on provider P[i]
10: D←D∪ {(cid, wid, i, chSize)} 11: Pglobal←Pglobal∪ {(cid, P[i])}
12: end for
13: end procedure
This kind of behavior is a starting point for DoS at-tacks, in which the user attempts to overload the sys-tem through large numbers of malformed or incom-plete requests. To cope with this security risk, spe-cific mechanisms have to be developed to quickly detect the illegal accesses and isolate the user that initiated them.
The most vulnerable data access operation is writing data into Blobseer, as it gives a malicious user not only the opportunity to overload the system and to increase its response time, but also the means to make available corrupted data.
TheWRITEoperation imposes a strict protocol
to the user that wants to correctly insert data into the system. We consider the typical case ofWRITE
operations in BlobSeer, that is when a user attempts to write a continuous range of chunks to a specific
BLOB. For simplicity we can assume that theWRITE
operation consists of two independent phases that have to be executed consecutively. These two steps can be summarized as follows (the full description of the data access primitives in BlobSeer can be found in (Nicolae et al., 2010)):
The data-writing step.A simplified description
of this operation is provided in Algorithm 2. We as-sume the size of data to be written is a multiple of a predefined chunk size, denoted chSize, as this is of-ten the case in BlobSeer. The input parameters of this step are the data to be written as a string buffer, the
offsetwithin theBLOBwhere the data has to be
in-serted and the size of the sequence.
The client connects to the provider manager and requests a list of data providers, P, which can host the chunks to be written. Then, the chunks are sent in parallel to the data providers, together with a unique identifier, cid, and the identifier of the
Algorithm 3Data-publication step
1: procedurePUBLISH_DATA(offset, size, D, wid)
2: writeInfo ← invoke remotely on version
managerASSIGN_VERSION(offset, size, wid)
3: BUILD_METADATA(writeInfo, D)
4: invoke remotely on version manager
COMPLETE_WRITE(writeInfo)
5: end procedure
WRITE operation, wid. Upon the successful
com-pletion of this step, the information associated with all the written chunks will be stored in a chunk de-scriptor map denoted D. Additionally, the providers that hold each cid are stored in Pglobal, a container
where the addresses of all the chunks in the system are saved.
The data-publication stepis represented by the
creation of the metadata associated with the written data and the publication of the written chunk range as a new version, as described in Algorithm 3.
First, the client asks the version manager for a new version for its chunk list, and then it proceeds to the creation of metadata, starting from the chunk de-scriptor map D generated in the first step. The write is finalized after the client successfully invokes the
COMPLETE_WRITEprocedure on the version
man-ager, which in turn is responsible for publishing the new version of theBLOB.
A correctWRITEoperation is defined as the
suc-cessful completion of the aforementioned steps, with the constraint that the published information con-cerning the written chunk range is consistent with the actual data sent to the data providers, that is, the values of D and wid that are sent to the version manager correspond to chunks that have been writ-ten on data providers. As a consequence, there are two types of protocol breaches that can be detected for theWRITEoperation:
Data written and not published. In this case, a ma-licious user obtains a list of providers from the provider manager and then starts writing data to the providers. The second step is never issued and thus the version manager, which keeps track of all theBLOBs and their versions,
will never be aware of the data inserted into the system. This kind of protocol breach can be de-veloped into a Denial of Service (DoS) attack, targeted to the overloading of one or more data providers.
Publication of inconsistent data. The attack that
corresponds to this situation aims to disrupt the computations that use data stored by the
BLOBs. As an example, a user may attempt
to compromise the system by making available data that does not actually exist. Therefore, an application can start reading and processing the data and without being aware that the metadata contain fake references. Hence the computa-tion would be compromised and the applicacomputa-tion forced to restart the processing.
5.2.2. The detection mechanism. Enabling
self-protection in BlobSeer relies on coupling a malicious-clients detection module with the intro-spection layer. On one hand, such a module has to identify the malicious activities that attempt to com-promise the system and to isolate users that initial-ize them. On the other hand, it should not interfere with BlobSeer operations, so as to preserve the effi-cient data-accesses for which BlobSeer is optimized. The introspection layer processes informations mon-itored independently of the interactions between the user and the system, and thus it is an ideal candidate to provide input data for a malicious clients detec-tion module.
We implemented a detection module that ad-dresses the protocol-breach attacks and generates
blacklistswith the users that attempt them. Its input data are provided as a history of the users’ actions by the introspection layer, which constantly moni-tors the real-time data-accesses and updates the his-tory. The user history stores the following types of monitoring parameters:
Data generated by the data providers. The
mon-itoring information collected from the data providers consists in tuples that aggregate the information about the stored data chunks. The data corresponding to a new chunk written in the system is defined as a tuple denoted (cid, wid, noCh, chSize, ts), where wid is the write identifier generated in the data-writing step and ts is the timestamp attached by the monitoring system when the data is recorded. Note that for the each wid there can be several records in the user history (with different timestamps), as not all the chunk writes are recorded by the monitoring system in the same time.
Data obtained from the version manager. The
introspection system records each new version published by the version manager in the form of tuples defined as (cid, wid, v, offset, size, ts), where wid is the same write identifier used for the data-writing step, v is the new published version, offset and size identify the chunk range
Algorithm 4Malicious clients detection
1: BL←∅
2: lastTsChecked=0
3: procedureDETECT_ILLEGAL_PUBLISH
4: maxTs=getCurentTime() −windowSize
5: PW ←getlist of published writes such that
ts>lastTsChecked and ts≤maxTs
6: DW←getlist of data writes such that ts >
lastTsChecked−windowSize
7: lastTsChecked←max(ts) from PW
8: forp∈PW, p= (cid, wid, o f f set, size, v)do
9: if ∄d ∈ DW, d =
(cidd, widd, noChd, chSized, tsd) such that
cidd=cid, widd=wid then
10: BL←UPDATE_SCORE(BL, cid, p)
11: else
12: ifsize6= ∑
d∈DWnoChd∗chSizedthen
13: BL←UPDATE_SCORE(BL, cid, p)
14: end if
15: end if
16: end for
17: end procedure
written into the system and ts is the timestamp assigned by the monitoring system.
The detection module comprises two compo-nents, each of them dealing with a specific type of protocol breach. The detection mechanism for incon-sistent data publication is presented in Algorithm 4.
TheDETECT_ILLEGAL_PUBLISH procedure is
ex-ecuted periodically and each time it inspects the most recent monitoring data recorded by the intro-spection module. The procedure searches for pub-lished versions that have no corresponding written data chunks or the written range of chunks does not match the published information. Each published write is matched against the set of chunk writes that occurred in a predefined time window, denoted
win-dowSize, surrounding its timestamp. If no chunks writes are found with the same client identifier and write id, or if the total size of the written chunks does not match the published size, the client is added to a global blacklistBL. Once blacklisted, a client is also associated with a score, which can be computed ac-cording to the type of illegal action. As an example, if no chunks are written, theUPDATE_SCORE
pro-cedure computes a score proportional to the write size declared by the publication step.
The goal of the detection mechanism is to keep track of the malicious users and to feed this informa-tion back into the BlobSeer system, so as to enable it to react when receiving new requests from the users identified as malicious. The malicious users can be
made available to the provider manager as a
black-list where each user’s score shows the amount of fake data that the user introduced into the BlobSeer system. The provider manager implements the allo-cation strategy that assigns providers for each user
WRITEoperation. Being aware of the blacklist, the
provider manager can decide to block the malicious users by not granting the providers when they want to write again into the system. The behavior of the provider manager can be further refined by taking into account the score associated with each client. In this case, there are several other constraints that can be enforced on the users, such as a decreased band-width for their WRITE operations, a waiting time
imposed before being assigned the necessary list of providers or a size limit for the data written.
6. Experimental evaluation
We evaluated the feasibility of gathering and terpreting the BlobSeer-specific data needed as in-put data for the different self-optimizing directions. Our approach was to create an introspection layer on top of the monitoring system, able to process the raw data collected from BlobSeer and to ex-tract significant information regarding the state and the behavior of the system. We performed a series of experiments that evaluate the introspection layer and also provide some preliminary results concern-ing the introduction of self-protection capabilities in BlobSeer. The experiments were conducted on the Grid’5000 (Jégou et al., 2006) testbed, a large-scale experimental Grid platform, that covers 9 sites geo-graphically distributed across France.
6.1. Visualization tool for BlobSeer-specific data.
We implemented a visualization tool that can pro-vide a graphical representation of the most impor-tant parameters yielded by the introspection layer.
We show the outcome of the introspection layer through an evaluation performed on 127 nodes be-longing to a Grid’5000 cluster in Rennes. The nodes are equipped with x86_64 CPUs and at least 4 GB of RAM. They are interconnected through a Gigabit Ethernet network. We deployed each BlobSeer en-tity on a dedicated node, as follows: two nodes were used for the version manager and the provider man-ager, 10 nodes for the metadata providers, 100 nodes for the storage providers and 10 nodes acted as Blob-Seer clients, writing data to the BlobBlob-Seer system. Four nodes hosted MonALISA monitoring services, which transferred the data generated by the instru-mentation layer built on top of the BlobSeer nodes to a MonALISA repository. The repository is the loca-tion where the data were stored and made available
(a) Number of WRITEaccesses on each chunk of a BLOB,
(each chunk is identified by its position within theBLOB). (b) The size of all the stored versions of aBLOB. Fig. 4. Visualization for BlobSeer-specific data
to the introspection layer.
In this experiment, we used 10BLOBs, each of
them having the chunk size of 1 MB and a total size larger than 20 GB. We created the BLOBs and we
wrote 10 data blocks of 2 GB on each BLOB. Each
data block overlaps the previous one by 10%. Next, we started 10 clients in parallel and each of them performed a number ofWRITEoperations on a ran-domly selectedBLOB. The blocks were written on
theBLOBat random offsets and they consisted of a
random number of chunks, ranging between 512 MB and 2 GB in size.
We processed the raw data collected by the monitoring layer and extracted the higher-level data within the introspection layer. Some results are pre-sented below, along with their graphical representa-tions.
Access patterns. They represent a significant
information that the introspection layer has to be aware of. It can be obtained by computing the num-ber of READ/WRITEaccesses. The access patterns
can be examined from two points of view. The first one regards the access patterns for each BLOB. It
considers the number ofREAD or WRITEaccesses for each chunk, for a specified version or for the whole BLOB and it identifies the regions of the
BLOBcomposed of chunks with the same number
of accesses (Figure 4(a)). The other one refers to the number of READ or WRITE operations performed
on each provider, allowing for a classification of the providers according to the pressure of the concurrent accesses they have to withstand.
The size of all the stored versions of aBLOB.
The differences between the versions of the same
BLOB are presented in Figure 4(b), where the size
of the new data introduced by each version into the system is shown in MB. This information, correlated
with the number of accesses for each version, can be used to identify versions that correspond to a small amount of data and are seldom accessed. Such ob-servations are necessary for a self-optimization com-ponent that handles the replication degree of each version.
6.2. Impact of the introspection architecture on the Blobseer data-access performance. This
exper-iment is designed to evaluate the impact of using the BlobSeer system in conjunction with the intro-spection architecture. The introspective layer col-lects data from BlobSeer without disrupting the in-teractions between its components, and thus no con-straint is enforced on the user’s accesses to the Seer entities. In this way the throughput of the Blob-Seer system is not influenced by the detection mod-ule. The only downside of such a system is the intru-siveness of the instrumentation layer that runs at the level of the BlobSeer components and is susceptible of decreasing their performance.
For this experiment we used the Grid’5000 clus-ters located in Rennes and Orsay. The nodes are equipped with x86_64 CPUs and at least 2 GB of RAM. We used a typical configuration for the Blob-Seer system, which enables the system to store mas-sive amounts of data that can reach the order of TB. It consists of 150 data providers, 20 metadata providers, one provider manager and one version manager. Both data and metadata providers store data on their hard disks and they are configured to store up to 64 GB and 8 GB, respectively. The MonALISA monitoring services are deployed on 20 nodes and they collect monitoring data from all the providers, each of them being dynamically assigned to a monitoring service in the deployment phase. The repository that gathers all the monitored
0 1000 2000 3000 4000 5000 0 10 20 30 40 50 60 70 80 Aggregated throughput (MB/s) Number of clients BSmon BS
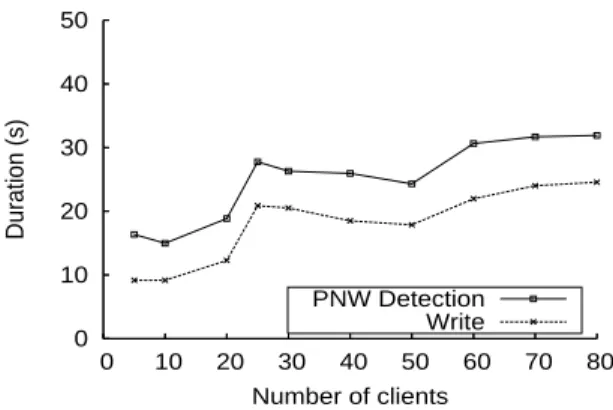
(a) The aggregated throughput of theWRITEoperation for BlobSeer (BS) and for BlobSeer with the monitoring support enabled (BSMON) 0 10 20 30 40 50 0 10 20 30 40 50 60 70 80 Duration (s) Number of clients PNW Detection Write
(b) TheWRITEduration and the detection delay when con-current clients that publish data without writing it (PNW) ac-cess the BlobSeer system
Fig. 5. Performance evaluations eters is located outside Grid’5000, as well as the
de-tection module that interacts only with the reposi-tory’s database. Each entity is deployed on a dedi-cated physical machine.
This test consists of deploying a number of con-current clients that make a singleWRITEoperation.
Each client writes 1 GB of data in a separateBLOB, using a chunk size of 8 MB. We analyze the ag-gregated throughput of the BlobSeer WRITE oper-ation obtained when deploying it standalone com-pared with the BlobSeer outfitted with the introspec-tion layers. The throughput is measured for a num-ber of clients ranging from 5 to 80 and the exper-iment was repeated 3 times for each value of the number of clients deployed. Figure 5(a) shows that the performance of the BlobSeer system is not influ-enced by the addition of the instrumentation code and the generation of the monitoring parameters, as in both cases the system is able to sustain the same throughput. Since the introspective layer computes its output based on the monitored data generated for each written chunk, the more fine-grained BLOBs
we use, the more monitoring information has to be processed. For this test, each BLOBconsists of 128 chunks and therefore the introspective component performs well even when the number of generated monitoring parameters reaches 10, 000, as it is the case when testing it with more than 80 clients.
6.3. Malicious clients detection. We aim to
ex-plore the first step towards a self-protecting BlobSeer system, by building a component that can detect il-legal actions and prevent malicious users from dam-aging the stored data. To reach this goal, the detec-tion mechanism for the malicious users has to de-liver an accurate image of the users’ interaction with
BlobSeer. Moreover, it has to expose the illegal op-erations as fast as possible, so as to limit the size of data illegally injected into the system and to prevent the malicious users from carrying on the harmful ac-cesses. We define the detection delay as the duration of the detection phase after the end of the client’s op-erations. We use the detection delay as a measure of the performance of the detection module.
The aim of this experiment is to analyze the performance of the detection module when the sys-tem is accessed by multiple concurrent malicious clients that publish data without actually writing them. This access pattern corresponds to a scenario where a number of clients access a reputation-based data-storage service. Each client can increase his rep-utation by sharing a large amount of data with the other users of the system. To achieve this goal, a ma-licious client may pretend to share huge data, while it only skips the data writing phase of the WRITE
operation and publishes inexistent data.
The deployment settings are identical to the pre-vious experiment. We want to assess the behavior of the system under illegal concurrent accesses. Thus we deploy only malicious clients, repeating the test with an increasing number of clients, ranging from 5 to 80. We measure both the duration of theWRITE
operation of the client and the delay between the beginning of the WRITE and the detection of the
client that initiated it as being malicious. All the clients start writing at the same time, thus having the same start time. For each point in the chart, we compute the average duration between all the clients deployed for that run. The results obtained in Fig-ure 5(b) show that the delay between the end of the write operation and the detection of the malicious clients remains constant as the number of clients
in-creases. This is a measure of the scalability of our ap-proach, showing that the detection process is able to cope with a large number of concurrent clients and to deliver results fast enough to allow the system to block the attackers, while sustaining the same level of performance.
7. Conclusions and future work
This paper addresses the challenges raised by the in-troduction of introspection into a data-management system for large-scale, distributed infrastructures. Such a feature aims at exposing general and service-specific data to a higher-level layer, in order to en-able the system to evolve towards an autonomic behavior. We propose a layered architecture built on top of the BlobSeer data-management system, a service dedicated to large-scale sharing of massive data. The goal of this architecture is to generate a set of specific data that can serve as input for a self-adaptive engine.
We also proposed a dynamic dimensioning module and a malicious clients detection component that rely on data yielded by the introspection layer. By reacting in real-time to changes in the state of the system, they represent the first step towards en-hancing this system with configuration and self-protection capabilities.
To build the monitoring layer, we relied on the MonALISA general-purpose, large-scale monitoring framework, for its versatility and extensibility. Our experiments showed that it was able to scale with the number of BlobSeer providers and to cope with the huge amount of monitoring data generated by a large number of clients. Moreover, it allowed us to define and to collect BlobSeer-specific data, as well as to visualize graphical representations associated with the various high-level data extracted.
The next step will consist in equipping Blob-Seer with other self-adaptive components in order to optimize the system’s performance and resource usage. As an example, by allowing the provider manager to rely on introspection data, this engine will help improving the storage resource allocation strategies. Besides, it can also provide information based on which adaptive data replication strategies can be implemented. Together, such features will enable an autonomic behavior of the BlobSeer data-management platform.
Acknowledgment
Experiments presented in this paper were carried out using the Grid’5000 experimental testbed, be-ing developed under the INRIA ALADDIN
devel-opment action with support from CNRS, RENATER and several Universities as well as other funding bodies (seehttp://www.grid5000.org/).
References
Albrecht, J., Oppenheimer, D., Vahdat, A. and Patterson, D. A. (2005). Design and implementation tradeoffs for wide-area resource discovery, In Proceedings of 14th IEEE Symposium on High Performance, Research Triangle Park, IEEE Computer Society, pp. 113–124. ALICE (2010). The MonALISA Repository for ALICE,
http://pcalimonitor.cern.ch/map.jsp.
Andreozzia, S., De Bortoli, N., Fantinel, S. et al. (2005). GridICE: a monitoring service for grid systems, Fu-ture Generation Computer Systems 21(4): 559–571. Cardosa, M. and Chandra, A. (2008). Resource
bun-dles: Using aggregation for statistical wide-area re-source discovery and allocation, 28th IEEE Inter-national Conference on Distributed Computing Systems (ICDCS 2008), Beijing, China, pp. 760–768.
Carpen-Amarie, A., Cai, J., Costan, A., Antoniu, G. and Bougé, L. (2010). Bringing introspection into the BlobSeer data-management system using the Mon-ALISA distributed monitoring framework, First In-ternational Workshop on Autonomic Distributed Systems (ADiS 2010), Krakow, Poland, pp. 508–513. Held in conjunction with CISIS 2010 Conference.
Cooke, A., Gray, A., Nutt, W. et al. (2004). The relational grid monitoring architecture: Mediating information about the grid, Journal of Grid Computing 2(4): 323– 339.
Cowell, R. G., Dawid, A. P., Lauritzen, S. L. and Spiegel-halter, D. J. (1999). Probabilistic Networks and Expert Systems, Springer-Verlag, New York.
Ding, J., Krämer, B. J., Bai, Y. and Chen, H. (2004). Prob-abilistic inference for network management, Univer-sal Multiservice Networks: Third European Conference, ECUMN 2004, pp. 498–507.
GGF (2010). The Global Grid Forum,http://www.ggf.org/.
Gunter, D., Tierney, B., Crowley, B., Holding, M. and Lee, J. (2000). Netlogger: A toolkit for distributed system performance analysis, MASCOTS ’00: Proceedings of the 8th International Symposium on Modeling, Analysis and Simulation of Computer and Telecommunication Sys-tems, IEEE Computer Society, Washington, DC, USA, p. 267.
Gurguis, S. and Zeid, A. (2005). Towards autonomic web services: Achieving self-healing using web services, DEASÕ05: Proceedings of Design and Evolution of Auto-nomic Application Software Conference, Missouri, USA. Hood, C. and Ji, C. (1997). Automated proactive anomaly detection, Proceedings of IEEE International Conference of Network Management (IM97), San Diego, California, pp. 688–699.
Jain, A., Chang, E. Y. and Wang, Y.-F. (2004). Adaptive stream resource management using Kalman filters, SIGMOD ’04: Proceedings of the 2004 ACM SIGMOD International Conference on Management of data, ACM, New York, NY, USA, pp. 11–22.
Jain, N., Kit, D., Mahajan, P., Yalagandula, P., Dahlin, M. and Zhang, Y. (2007). STAR: self-tuning aggregation for scalable monitoring, VLDB ’07: Proceedings of the 33rd international conference on Very Large Data Bases, VLDB Endowment, pp. 962–973.
Jégou, Y. et al. (2006). Grid’5000: a large scale and highly reconfigurable experimental grid testbed., Interna-tional Journal of High Performance Computing Applica-tions 20(4): 481–494.
Kephart, J. O. and Chess, D. M. (2003). The vision of auto-nomic computing, Computer 36(1): 41–50.
Legrand, I., Newman, H., Voicu, R. et al. (2004). Mon-ALISA: An agent based, dynamic service system to monitor, control and optimize grid based applica-tions, Computing for High Energy Physics, Interlaken, Switzerland.
Liang, J., Gu, X. and Nahrstedt, K. (2007). Self-configuring information management for large-scale service over-lays, INFOCOM 2007. 26th IEEE International Con-ference on Computer Communications, Joint ConCon-ference of the IEEE Computer and Communications Societies, pp. 472–480.
Massie, M., Chun, B. and Culler, D. (2004). The Ganglia distributed monitoring system: design, implementa-tion, and experience, Parallel Computing 30(7): 817– 840.
Nicolae, B., Antoniu, G. and Bougé, L. (2009). Enabling high data throughput in desktop grids through de-centralized data and metadata management: The BlobSeer approach, Proceedings of the 15th Inter-national Euro-Par Conference, Delft, Netherlands, pp. 404–416.
Nicolae, B., Antoniu, G., Bougé, L., Moise, D. and Carpen-Amarie, A. (2010). BlobSeer: Next generation data management for large scale infrastructures, Journal of Parallel and Distributed Computing.
Parashar, M. and Hariri, S. (2005). Autonomic computing: An overview, Unconventional Programming Paradigms, Springer Verlag, pp. 247–259.
Santos, Jr., E. and Young, J. D. (1999). Probabilistic tem-poral networks: A unified framework for reasoning with time and uncertainty, International Journal of Ap-proximate Reasoning 20(3): 263–291.
Steinder, M. and Sethi, A. S. (2004). Probabilistic fault localization in communication systems using be-lief networks, IEEE/ACM Transactions on Networking 12(5): 809–822.
Tierney, B., Aydt, R. and Gunter, D. (2002). A grid moni-toring architecture, Grid Working Draft GWD-PERF-16-3.http://www.gridforum.org/.
Van Renesse, R., Birman, K. P. and Vogels, W. (2003). Astrolabe: A robust and scalable technology for distributed system monitoring, management, and data mining, ACM Transactions on Computer Systems 21(2): 164–206.
Vuran, M. C. and Akyildiz, I. F. (2006). Spatial correlation-based collaborative medium access control in wire-less sensor networks, IEEE/ACM Transactions on Net-working 14(2): 316–329.
Zanikolas, S. and Sakellariou, R. (2005). A taxonomy of grid monitoring systems, Future Generation Comput-ing Systems 21(1): 163–188.
Alexandra Carpen-Amarie received her Engineering Degree in 2008 from the Com-puter Science Department of Politehnica University Bucharest, Romania. She is currently a Ph.D. student at ENS Cachan, France, working in the KerData Team at INRIA Rennes - Bretagne Atlantique. Her research interests include: large-scale dis-tributed data storage, cloud computing, monitoring in distributed systems.
Alexandru Costan is a Ph.D. student and Teaching Assistant at the Computer Science department of the Politehnica University of Bucharest. His research interests include: Grid Computing, Data Storage and Model-ing, P2P systems. He is actively involved in several research projects related to these domains, both national and international, from which it worth mentioning MonAL-ISA, MedioGRID, EGEE, P2P-NEXT, Blob-Seer. His Ph.D. thesis is oriented on Data Storage, Representation and Interpretation in Grid Environments. He has received a Ph.D. Excellency Grant from Oracle and was awarded an IBM Ph.D. Fel-lowship in 2009.
Jing Cai is a MPhil student in the Depart-ment of Computer Science, City University of Hong Kong. He has worked with the ker-Data team at INRIA-Rennes research center as a research intern in 2009. His research in-terests include distributed computing, mon-itoring in grid computing environment.
Gabriel Antoniu is a Research Scientist at
INRIA Rennes - Bretagne Atlantique (CR1) and is a member of the KerData research team. His research interests include: grid and cloud distributed storage, large-scale distributed data management and sharing, data consistency models and protocols, grid and peer-to-peer systems. Gabriel Antoniu received his Bachelor of Engineering degree from INSA Lyon in 1997; his Master degree in Computer Science from ENS Lyon in 1998; his Ph.D. degree in Computer Science in 2001 from ENS Lyon; his Habilitation for Research Supervision (HDR) from ENS Cachan in 2009.
Luc Bougé , Professor, is the Chair of the Informatics and Telecommunication Depart-ment (DIT) at ENS Cachan - Antenne de Bre-tagne. He is also the leader of the KerData Joint Team of INRIA Rennes - Bretagne At-lantique and ENS Cachan - Antenne de Bre-tagne. His research interests include the de-sign and semantics of parallel programming languages and the management of data in very large distributed systems such as grids, clouds and peer-to-peer (P2P) networks.