HAL Id: hal-01305644
https://hal.archives-ouvertes.fr/hal-01305644
Submitted on 21 Apr 2016HAL is a multi-disciplinary open access archive for the deposit and dissemination of sci-entific research documents, whether they are pub-lished or not. The documents may come from teaching and research institutions in France or
L’archive ouverte pluridisciplinaire HAL, est destinée au dépôt et à la diffusion de documents scientifiques de niveau recherche, publiés ou non, émanant des établissements d’enseignement et de recherche français ou étrangers, des laboratoires
Performance evaluation of legacy QCN for multicast and
multiple unicast traffic transmission
Hela Mliki, Lamia Chaari, Lotfi Kamoun, Bernard Cousin
To cite this version:
Hela Mliki, Lamia Chaari, Lotfi Kamoun, Bernard Cousin. Performance evaluation of legacy QCN for multicast and multiple unicast traffic transmission. International Journal of Network Management, Wiley, 2016, �10.1002/nem.1927�. �hal-01305644�
Performance evaluation of legacy QCN for multicast
and multiple unicast traffic transmission
Hela MLIKI, Lamia CHAARI, Lotfi KAMOUN, Bernard COUSIN
LETI Laboratory, Engineering School of Sfax (ENIS), University of Sfax, 3038 Sfax, Tunisia IRISA/University of Rennes 1, Campus de Beaulieu, 35042 Rennes cedex, France
[email protected], [email protected], [email protected], [email protected]
Abstract
A multicast congestion control scheme is an interesting feature to control group communication applications such as teleconferencing tools and information dis-semination services. This paper addresses a comparison between multiple unicast and multicast traffic congestion control for Carrier Ethernet. In this work, we pro-posed to study the Quantized Congestion Notification (QCN), which is a Layer 2 congestion control scheme, in the case of multicast traffic and multiple unicast traffic. Indeed, the QCN has recently been standardized as the IEEE 802.1Qau Ethernet Congestion Notification standard. This scheme is evaluated through sim-ulation experiments, which are implemented by the OMNeT++ framework. This paper evaluates the Reaction Point (RP) start time congestion detection, feedback rate, loss rate, stability, fairness and scalability performance of the QCN for mul-ticast traffic transmission and multiple unicast traffic transmission. This paper also draws a parallel between QCN for multicast traffic transmission and that for multiple unicast traffic transmission. Despite the benefit of integrating the multi-cast traffic, results show that performance could degrade when the network scales up. The evaluation results also show that it is probable that the feedback implo-sion problem caused by the bottlenecks could be solved if we choose to set the queue parameter Qeq threshold value at a high value, 3/4 of the queue capacity for instance.
keywords –Ethernet Congestion Management; Multicast; IEEE 802.1Qau; QCN.
1
Introduction
Carrier Ethernet extends the original set of Ethernet LAN technologies with support-ing new required capabilities to deliver enhanced services [1], [2], [3], [4]. Hence, the IEEE 802.1 standards committee studied the issue of using Ethernet as an infrastruc-ture to enable Data Center applications [5], [6], [7].
Two major issues are noticed with Ethernet for a data center network: (i) Ethernet switches use shallow buffers to reduce frame latency. This causes a limitation on the magnitude of fluctuations. (ii) There is a typically small number of active sources on each path with high sending rates. This could result in difficulties to control their rates [8], [9].
In an effort to keep up with the traffic demand and maximize QoS, IEEE802.1 Qau is specifying congestion control mechanisms for Carrier Ethernet. It proposes
Quantized Congestion Notification (QCN) as a mechanism to manage and control congestion in a Carrier Ethernet network [10].
The QCN basically introduces end-to-end congestion notification in Layer 2 net-works. The QCN scheme uses feedback as notification messages, which are sent as soon as congestion arises. The feedback frame is generated by the switch that experi-ences a queue overflow. This switch is called a Congestion Point (CP). The feedback frame is sent in the backward direction to frame senders that have induced the queue overflow. Frame senders—known as Reaction Points (RP)—use the received feedback to adjust the rate of data flows causing congestion [11] [10], [12], [13].
The QCN has been analyzed, evaluated and enhanced for unicast traffic [14], [15], [16], [17], [18], [19], [20], [21]. For multicast traffic, the paper [22] studies the QCN for multicast traffic and proposes an enhancement scheme. In this work, we studied this scheme in the case of multicast traffic and multiple unicast traffic transmission.
Unicast is a single destination, point to point communication method. Multiple unicast expands the concept of unicast by creating multiple connections from one source to a specific selection of destinations. When multiple distinct users request the same information, the sender transmits several separate copies of the data. These mul-tiple copies of the same frame cause extra load on the network. However, multicast is a point to multipoint communication method. This method could reduce the trans-mission overhead on senders and the stress of network links. Actually, multicasting allows sending a single copy of the data from a source to a group address to be deliv-ered to multiple destinations sharing this address. The group address is a multicast IP address in the IP network [23], [24], whereas in Ethernet, it is a MAC group address. At branching nodes (at switches), frames are copied and sent to different downstream links. Multicast and multiple unicast can provide support for services such as stream-ing media, file transfer, real time application and distributed conferences. Multicast and multiple unicast data stream is often sent to multiple destinations along multiple paths through the network, whereas a unicast data stream normally travels along a single path. Therefore, a multicast and multiple unicast streams are more likely to face congested switches than a simple unicast stream.
However, neither the control of multicast streams nor the control of multiple uni-cast streams were the object of the QCN standard [10] and no simulation or experi-ments involving multicast and multiple unicast traffic have been implemented as far as we know. As we think that multicast and multiple unicast are a mandatory concept that must be adopted for Carrier Ethernet, we studied in this paper the congestion control scheme QCN for the Carrier Ethernet in the case of a multicast and multiple unicast traffic and we compare between them.
When congestion occurs, traffic may face the following problems:
(i) The loss rate of frames may rise. Frames are lost in a network because they may be dropped when a queue in the switch node overflows. It is important to consider the frame loss because some applications (e.g., audio and video appli-cations) do not perform well (or at all) in the case of a high loss rate.
(ii) The state of the queues can fluctuate between underutilization and overuse states. These fluctuations can reduce the network efficiency and result in rate
fluctua-tions (increase/decrease) on the source transmission side. Therefore we evaluate the stability of the QCN for multicast traffic.
(iii) As the network scales, the RP may face the feedback implosion problem, defined by a significant number of feedback frames, which may be returned by over flown CPs for each copy of a multicast or multiple unicast data frame sent. This paper evaluates the following criteria for a QCN scheme for multicast and multiple unicast traffic transmission:
(i) The RP start time congestion detection: when the QCN detects congestion. (ii) Feedback overhead: how many feedback frames are generated when congestion
is detected.
(iii) Loss rate: how many frames are dropped when a queue size is exceeded. (iv) Stability: how the sending rate and the queue length behave.
(v) Fairness: how the QCN multicast traffic shares the bandwidth among multicast group receivers.
(vi) Scalability: how the QCN behaves when the number of switches along the paths increases. Actually, for a source to adjust its data rate according to a network traffic status, it must receive feedback from the CPs. When the number of the CPs increases, the multicast source or the multiple unicast sources can face a feedback implosion problem and eventually performance degradation.
The contribution of this paper is thus as follows: it first evaluates, through simula-tions, the QCN performance for multicast and multiple unicast traffic in terms of RP start time congestion detection, feedback rate, loss rate, stability, fairness and scalabil-ity. It also draws a parallel between the QCN for multicast traffic transmission and that for multiple unicast traffic transmission. Besides, it provides the results of the study of two solutions (i.e., the multicast traffic transmission and the multiple unicast traffic transmission) using the legacy QCN congestion control.
The rest of the paper is organized as follows. The QCN congestion control scheme for Carrier Ethernet is presented in section 2. In section 3 we describe the settings for our studies, as well as the performance criteria used to evaluate the QCN with multicast and multiple unicast traffic. We report on our findings in section 4. Finally, section 5 presents the conclusions drawn from our study.
2
Background
In this section, the QCN scheme is presented according to [10].
When the aggregate traffic rate exceeds the capacity of a link in the network, the queue associated with the switch is saturated and the switch is subject to congestion. The source rate could become very low and drop to zero; this is known as conges-tion collapse. In order to mitigate congesconges-tion, the QCN uses a rate-based mechanism for traffic regulation at the source. It consists in adjusting the flow rate dynamically
according to the network load. Thus, the RP parameters are tuned relying on the con-tinuous feedback coming from the CP. Congestion detection with this scheme is based on a switch queue load. Actually, the QCN monitors queue utilization by requiring a queue length threshold (Qeq) at the output queues of the switch to trigger congestion feedback. A feedback frame is transmitted back to the RP that sent the data frame that has triggered the feedback. The RP tries to keep the current rate ( CR) of transmission from the source below the target rate (TR). TR is the sending rate of the RP just before receiving a feedback frame. The basic steps of the QCN scheme are the following:
(i) Congestion Detection. (ii) Congestion Notification. (iii) Source Reaction.
2.1 Congestion Detection
The key idea is to detect congestion in its early stages and notify the sources about the state of congestion, before the switch queue overflows. In such a case, the CP computes a congestion measure Fb, puts it in the feedback frame and sends explicit congestion notification (feedback) to the source of the triggering frame. The Fb value is quantized to 6 bits [10]. Thus the maximum Fb value (Fbmax) is equal to 63.
Let Qlen denote the instantaneous queue size and Qold denote the queue size when the last feedback message was generated.
Let Qo f f = Qlen−Qeq and Qdelta= Qlen−Qold.
Fb captures a linear combination of the queue size excess (Qo f f ) and the rate
excess (Qdelta). It is given by the formula:
Fb= −(Qo f f +w×Qdelta) (1) The parameter w is a non negative constant, chosen to be 2 in the standard QCN [10].
A CP detects congestion when the computed Fb value is negative.
2.2 Congestion Notification
The goal of congestion notification is to keep the queue size near the queue length threshold Qeq. When Fb is negative, it indicates that the current queue size is larger than the target queue length Qeq and/or the queue size is increasing. A feedback frame is then sent to the triggered frame source to alert it. When Fb is positive it means that there is no congestion and no feedback frame to send back. A CP announces congestion by generating a feedback frame addressed to the source of the triggered frame. The feedback frame contains the feedback information (Fb), which informs the triggered frame source about the extent of congestion at the CP.
2.3 Source Reaction
The RP performs the AIMD (Additive Increase Multiplicative Decrease) [25] rate adap-tion. The rate is decreased when a negative feedback is received from the CP. However,
it is increased when the RP infers that there is extra available bandwidth. The source rate is also increased to allow the RP to recover from previously lost bandwidth. The RP decreases its rate when a feedback frame is received. Consequently, the current rate CR and the target rate TR are updated as follows:
CR=CR× (1−Gd× |Fb|) (2)
TR=CR (3)
The parameter Gd is a constant chosen so that Gd× |Fbmax| = 1/2. Hence, the
sending rate can decrease by at most 50%.
The RP does not receive any notification to increase its data rate. Therefore, after decreasing its rate, the RP goes through the following phases: Fast Recovery (FR), Active Increase (AI) and Hyper Active Increase (HAI). Each phase consists of several cycles. To compute the duration of each cycle, the RP uses a Byte Counter, which counts the number of transmitted bytes and a Timer, which times the rate increase. Each time the RP is in the AI or the HAI cycles and a feedback frame is received, it resets the Byte Counter and the Timer, performs a multiplicative decrease for the transmission rate and goes to the FR phase. The underlying goal of these phases is to smoothly increase the transmission rate of sources and avoid network flooding. Figure 1 models the workflow at the RP using an UML Activity Diagram. This figure visually distinguishes responsibilities for each phase of the RP process.
2.3.1 Fast Recovery
When no more feedback frames are received, the aim of the FR is to rapidly recover the data rate lost during the last rate decrease episode. The FR consists of 5 cycles, each cycle is equal to 150 Kbytes. At the end of each cycle, the TR does not change, while the CR is updated as follows:
CR= 1
2 × (TR+CR) (4)
2.3.2 Active Increase
At the end of the 5 cycles in the FR phase, if no feedback is received, the RP infers that there is available bandwidth; it enters the AI phase where it increases the transmission rate much more compared to the previous phase (i.e., FR). During the AI, the Byte Counter counts out one cycle of 75 KBytes. Then at the end of the cycle, the RP updates the TR and the CR as follows:
TR= TR+RAI (5)
CR= 1
2 × (CR+TR) (6)
Figure 1:Reaction Point Workflow
2.3.3 Hyper Active Increase
At the end of the AI phase, if no feedback is received, the RP interprets that there is available bandwidth, it moves to the HAI phase and increases the transmission rate substantially. This substantive rate increase is processed only after providing the network with adequate opportunities to send feedback frames in the FR and the AI phases. The RP increases the TR and the CR as follows:
TR= TR+i×RH AI (7)
CR= 1
2 × (CR+TR) (8)
The parameter i is the number of HAI cycles, chosen to be equal to one and RH AI
is set to 50 Mbps in the QCN standard [10].
3
Performance Evaluation of Legacy QCN for Multicast and
multi unicast Traffic
An evaluation including simulation and measurements needs to cover several network scenarios to examine the scheme behavior. The evaluation of the QCN for multicast or multiple unicast traffic transmission has not been the subject of much research interest. Various simulation experiments were performed to evaluate the performance of the QCN for multicast and multiple unicast traffic using the following criteria:
(i) The RP start time congestion detection: computes the first time the RP recognizes congestion.
(ii) Feedback overhead: computes the rate of feedback frames delivered by the CP. (iii) Loss rate: computes the rate of dropped frames by the CP.
(iv) Stability: computes the standard deviation (StdDev) of the rate CR at the RP and the queue length deviation at the CP.
(v) Fairness: computes the Raj Jain fairness index [26] to measure fairness among sources, which is defined as:
F(r1, r2, ..., rk) = (∑
k i=1ri)2
k×∑ki=1r2i (9)
The parameter ri is the already assigned rate of the corresponding source i, and
k is the total number of sources. The fairness index always results in a number
between 0 and 1, with 1 representing the greatest fairness.
(vi) Scalability: computes the feedback rate, the loss rate, the stability and the fair-ness performance criteria when the number of CPs increases.
We have selected two topologies represented in Figures 2 and 17: dumbell topology and multi-link topology, respectively. The RP start time congestion detection, feedback rate, loss rate, stability and fairness are studied within the topology described in Figure 2, while scalability is studied within the topology described in Figure 17.
We have run several OMNeT++ simulations and made use of the INET framework to test the QCN performance for multicast and multiple unicast traffic. There is one queue per switch output port. We used drop tail queues with fifo scheduling. In our simulations, without loss of generality, all queues have the same size and their total size is equal to 100 f rames, each 1500 bytes long. Each queue may be shared among several concurrent flows. Each queue sets its Qeq threshold to control its target size. Our network used Ethernet links with a capacity equal to 1 Gbit/s. There are six sources and each one sends traffic at 200 Mbit/s with a constant UDP frame size and a constant UDP frame generation time. The first source starts transmission at 0.1 s, the second source starts transmission at 1 s, the third source starts transmission at 2 s, the fourth source starts transmission at 3 s, the fifth source starts transmission at 4 s and the sixth source starts transmission at 5 s. The initial value of the CR is set to the transmission rate of the Ethernet interface (1 Gbit/s). The simulated data traffic uses UDP (User Datagram Protocol). UDP is a simple message-based connectionless protocol [27]. Multicast traffic is generally based on UDP. In addition, time-sensitive applications often use UDP because waiting is not an option in many real-time systems [28], thus the dropping frames technique is often preferred to waiting for a long time for retransmitted frames. As UDP does not support a congestion control mechanism, frame queuing and dropping techniques (in the switches, i.e., at Layer 2) are often the only available alternative to handle excessive UDP traffic [29]. Therefore, congestion control at Layer 2 is a mandatory functionality at switches in such a case.
Each receiver of a multicast group is permitted to stay in the group during all the multicast session duration, regardless of the network congestion status. The traffic con-trol at the source must adhere to the congestion constraints on all receivers’ paths. This means that the source rate could be essentially dictated by the slowest receiver. The multiple unicast decomposition is the easiest approach in which to adjust the source rate of a multicast session [30]. In this approach, a multicast session with N receivers is initially viewed as a set of N independent unicast sessions, with an adjusted rate of each of these unicast sessions based on the congestion status of the path leading to the corresponding receiver. Thus, traffic in a multicast session is adjusted according to the path forming the tighter bottleneck. Hence, let ri be the transmission rate to each
receiver i in the multicast group, where ri is based on the congestion status of the path
leading to i. The overall multicast rate CR is then defined as CR=miniri.
3.1 RP start time congestion detection
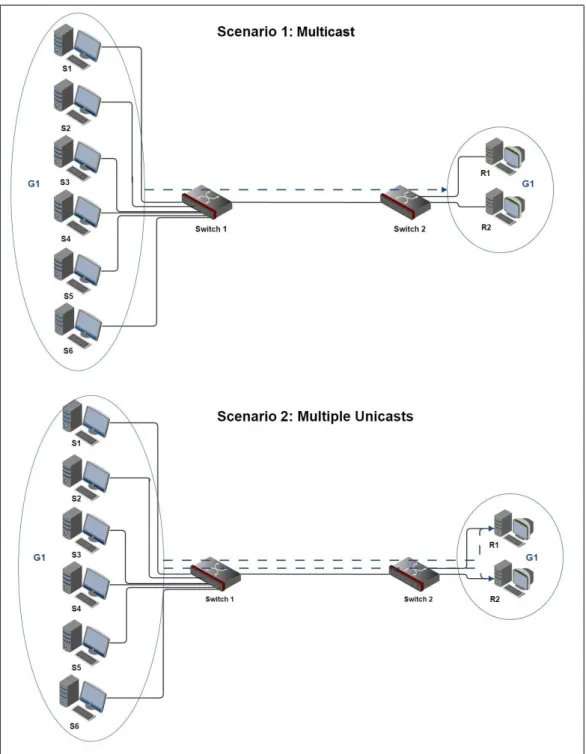
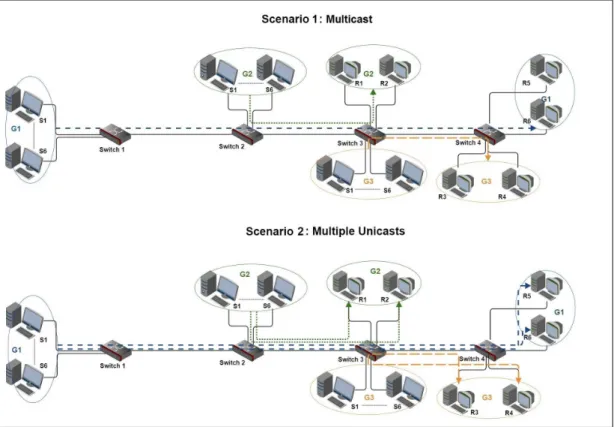
In order to respond to congestion, the QCN source adjusts the sending rate by carrying out the phases of Fast Recovery, Active Increase and Hyper Active Increase as it is described in section 2.3. The dumbell topology described in Figure 2 was used to test the QCN scheme behavior when congestion occurs. The first scenario consists of six multicast sessions; each of them has one source S1...S6. The second scenario consists of six multiple unicast sessions; each of them has one source, S1...S6. Each session source sends UDP traffic and implements a QCN reaction point module at the Ethernet interface to deal with congestion. R1, R2 are the receiver nodes for all the sessions.
In the case of the multicast scenario, the multicast flow goes from each of the sources (S1, S2, S3, S4, S5 and S6) through one link (Switch 1 - Switch 2) to all receivers in group 1 (R1, R2). In the case of the multiple unicast scenario, there are two unicast flows for each source. Each one is assigned to a receiver (either R1 or R2). It goes without saying that if the number of destinations increases the number of unicast flows will increase accordingly.
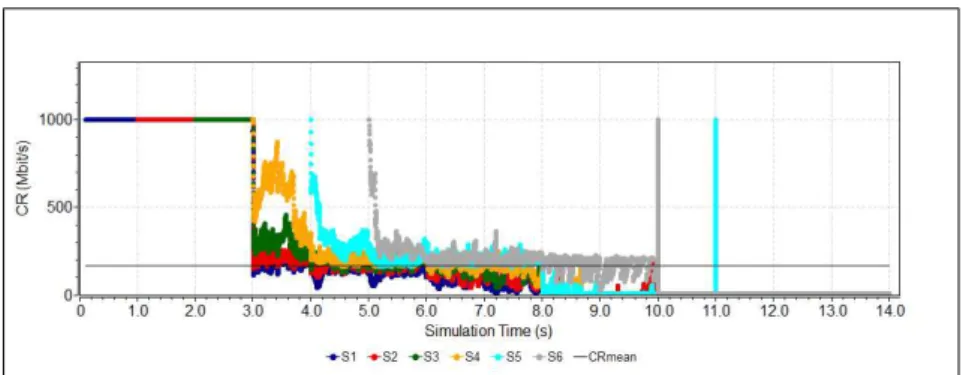
We want to evaluate the impact of the Qeq threshold on the QCN scheme. We conducted experiments for different values of Qeq threshold. Figures 3, 4, and 5 plot the rate variation of each of the six multicast flows respectively when Qeq=25 f rames,
Qeq = 50 f rames and Qeq= 75 f rames in the case of a multicast scenario. In Figure 3, the four colors seen sequentially at 1000 Mbit/s for the first four seconds are an artifact of the plotting algorithm: from 0 s to 1 s, only the blue source (S1) is transmitting; from 1 s to 2 s, the blue and the red sources (S1 and S2) are transmitting, and the value of
CR plotted last is for the red source (S2), so the red color overrides the blue color.
Figures 6, 7 and 8 plot the rate variation of each of the six sources flows when
Qeq = 25 f rames, Qeq = 50 f rames and Qeq = 75 f rames, respectively, in the case of the multiple unicast scenario. At the beginning of the simulation, queues at the switch do not detect any congestion. Then as congestion arises (Fb < 0), the sources tune their parameters according to the received feedback frames to handle congestion as described in section 2. We find that in the case of the multicast scenario congestion oc-curs after the first 4 s when five successive multicast flows try to transmit at 200 Mbit/s each. However, in the case of a multiple unicast scenario, congestion occurs after the
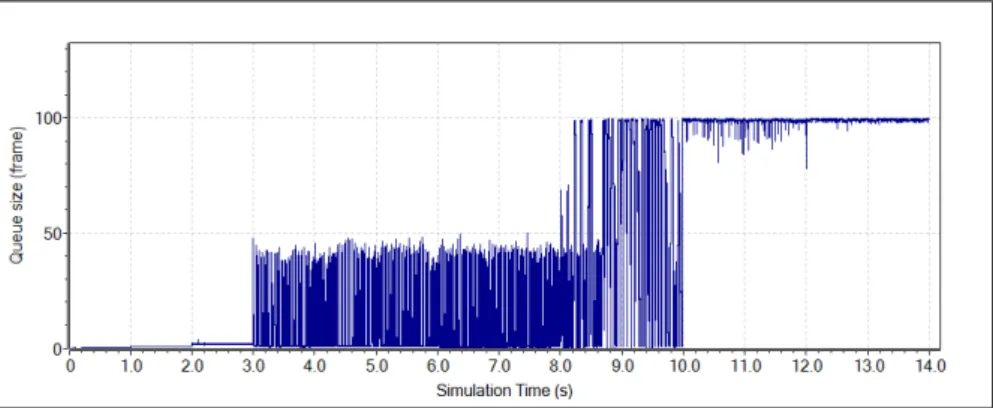
first 3 s when four successive multiple unicast flows try to transmit at 200 Mbit/s each. We can infer that congestion in the case of the multiple unicast scenario occurs faster than in the simple multicast one. Indeed, Figure 9 shows the queue size variation when the Qeq = 25 f rames in the case of the multicast scenario. We note that the queue load starts to build up after the first 4 s. However, Figure 10 plots the queue size variation when the Qeq = 25 f rames in the case of the multiple unicast scenario. We note that the queue load starts to build up after the first 3 s.
Results also show that sources do not suffer from a drop to zero problem (conges-tion collapse). The minimum value that can be reached is Rmin=10 Mbit/s.
To check the effectiveness of feedback sending according to different threshold parameters, both feedback and loss rates were explored.
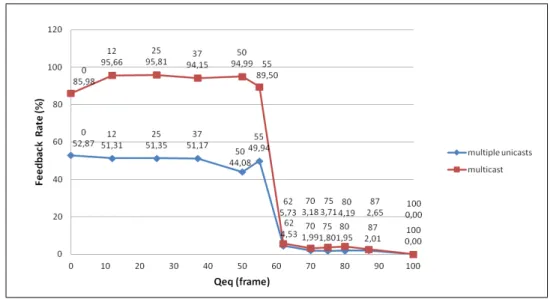
3.2 Feedback Rate
Figure 11 shows the feedback rate according to different values of Qeq threshold. We note, in the case of multiple unicast transmission traffic, that the more the Qeq old decreases, the more the queues generate feedback frames. Indeed, low Qeq thresh-old values can easily be exceeded and then congestion detection occurs. For example, when the Qeq = 75 frames the feedback rate is equal to 1.87% of the total frame stream, when the Qeq = 50 frames the feedback rate is equal to 44.49% of the total frame stream, and when the Qeq = 25 frames the feedback rate is equal to 48.05% of the total frame stream. In contrast, in the case of a multicast transmission traffic, the queue generates feedback almost steadily with the different parameter values of the
Qeq threshold. For example, when the Qeq = 25 frames the feedback rate is equal to 2.49% of the total frame stream, when the Qeq= 50 frames the feedback rate is equal to 3.35% of the total frame stream, and when the Qeq=75 frames the feedback rate is equal to 2.46% of the total frame stream. As demonstrated in section 3.3, the multiple unicast scenario generates heavier congestion than the simple multicast scenario. We observe that the feedback rate is higher in the case of a multiple unicast scenario than that in the case of a multicast scenario.
3.3 Loss Rate
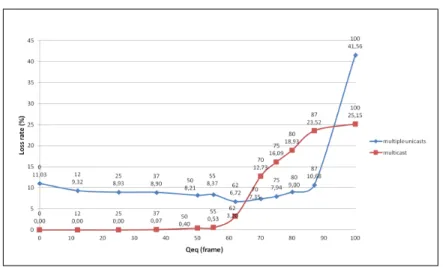
Figure 12 shows the frame loss rate according to different Qeq threshold values in the case of multicast and multiple unicast traffic transmission scenarios. We note that in the multiple unicast traffic scenario the loss rate is high for most of the cases of different Qeq threshold values compared to the multicast scenario. For example, when the Qeq = 25 frames the loss rate is equal to 8.93% of the total frame stream, when the Qeq=50 frames the feedback rate is equal to 8.20% of the total frame stream, and when the Qeq=75 frames the feedback rate is equal to 7.94% of the total frame stream. However, in the multicast traffic scenario, the loss rate remains close to zero until Qeq is 50 f rames, and then rises steeply as the Qeq threshold value further increases. For example, when the Qeq = 25 frames the loss rate is equal to 0% of the total frame stream, when the Qeq = 50 frames the feedback rate is equal to 0.39% of the total frame stream, and when the Qeq = 75 frames the feedback rate is equal to 16.09% of the total frame stream.
Figure 3:CR when Qeq=25 f rames in the case of multicast scenario
Figure 4:CR when Qeq=50 f rames in the case of multicast scenario
Figure 5:CR when Qeq=75 f rames in the case of multicast scenario
Figure 7: CR when Qeq=50 f rames in the case of multiple unicast scenario
Figure 8: CR when Qeq=75 f rames in the case of multiple unicast scenario
Figure 9:Queue size variation when Qeq=25 f rames in the case of multicast scenario
Figure 11: Feedback rate of dumbell topology
Figure 12:Loss rate of dumbell topology
Therefore, as the Qeq threshold increases, the loss rate also increases. This is be-cause the low Qeq threshold value leaves a safety margin for burst arrivals of new flows. That is why it has a lower drop rate than those of a high Qeq threshold.
3.4 Stability
Stability properties characterize the fluctuation magnitude of the system variables. Stability is associated with fluctuation of the sending rate (CR), which results in fluctuations in the length of queues and may cause queue overflows. We study the stability of the queue length and the sending rate CR for both multiple unicast and multicast traffic transmission scenarios. CR mean represents a reference value, which defines the level at which the CR is expected to stabilize (CR mean = 1 Gbit/s÷6). Figures 3–8 show the CR fluctuation around the stable rate CR mean.
In the case of a multicast scenario (Figures 3, 4 and 5), we find that as the Qeq threshold increases, the CR converges to a value that is larger than the CR mean, which represents the value the CR each flow should reach. Consequently the loss rate increases when the CR converges over CR mean.
Figure 13:Standard deviation of the CR with different Qeq thresholds at dumbell topology
different values of Qeq threshold the CR does not stabilize around the CR mean. It rather converges to fluctuate under the CR mean.
Indeed, in the multicast scenario, when the Qeq threshold value increases the CR converges over the CRmean, because it does not receive enough feedback frames to converge to the appropriate value. In fact, large Qeq value does not allow an early detection of congestion to adjust the CR adequately. In the multiple unicast scenario, there is heavy congestion as the traffic is sent twice (because we have two destina-tion). Therefore, the source receives more feedback frames compared to the multicast scenario. This can tune the CR sharply.
Figure 13 shows the standard deviation of the CR at the RP for the multicast and multiple unicast traffic transmission scenarios for different Qeq threshold values. We notice that the frame rate undergoes more fluctuations in the case of multiple unicast scenario than the multicast scenario for most Qeq threshold values. This is because the congestion point sends more feedback frames in the case of multiple unicast scenario than in the multicast scenario case. As the sending rate CR is updated thanks to the received feedback, a large feedback rate leads to fluctuations at the sources. We remark that rate fluctuations at the sources results in queue length fluctuations and then a high frame loss rate .
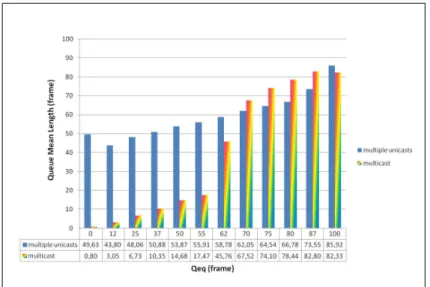
Figure 14 shows the mean queue length for different values of Qeq threshold. Fig-ure 15 plots the deviation of the mean queue length from the Qeq threshold for multi-cast and multiple unimulti-cast scenarios. In fact, the aim is not to exceed the Qeq threshold while transmitting the source frames to their destinations. When the deviation value is negative it means that the mean queue length is under the Qeq threshold. Otherwise, when it is positive, it means that the mean queue length goes over the Qeq threshold, which indicates poor control of the congestion. We find that in the multiple unicast scenario the congestion is far too inadequately controlled in the case of low values of
Figure 14:Queue mean length for different Qeq threshold at dumbell topology
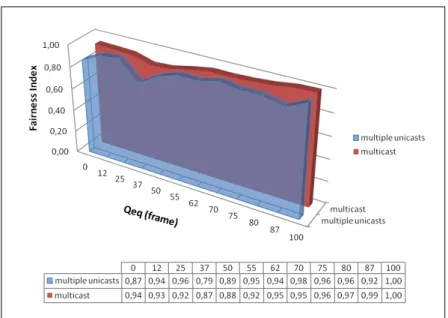
Figure 16:Fairness index with dumbell topology for multicast and multiple unicast scenarios
3.5 Fairness
We used the network topology described in Figure 2 to run our simulations for multi-cast and multiple unimulti-cast scenarios in the case of different Qeq thresholds. According to max-min fairness [31], network resources are allocated in such a way that the bit rate of a flow cannot be increased without decreasing the bit rate of a flow with a smaller bit rate.
Figure 16 plots the fairness index comparison between multicast and multiple uni-cast scenarios for different Qeq thresholds. We find that the fairness index in the case of a multicast scenario is better than the one in the case of multiple unicast scenario for different Qeq threshold values. Indeed, the larger the fairness index, the better the fairness among users.
3.6 Scalability
There is usually more than one bottleneck on a network path. It is desirable to check how flows compete together and the way the QCN performance can be achieved in both multicast and multiple unicast scenarios when the network scales.
We studied a scenario with multiple paths as described in Figure 17. A large number of CPs can lead to feedback implosion because each CP sends feedback to its sources. The source rate has to be adapted based on the sum of the congestion feedback indications generated by these CPs. When the network size scales (multi-link topology), with several multicast members placed on distinct branches of the network topology, a multiple unicast QCN and a simple multicast QCN can exhibit a deteriorated performance.
In the case of a multicast scenario, the multicast flow goes through three potential bottlenecks (Switch 1, Switch 2 and Switch 3), from six sources (S1, S2, S3, S4, S5 and S6) to receivers in group 1 (R5, R6). There are also two other multicast flows, which go through only one bottleneck from six sources to group 2 receivers (R1, R2) and from
Figure 17:Multi-link topology with multiple potential bottlenecks
six sources of group 3 (G3), to group 3 receivers (R3, R4). Each group has two receivers. Whereas, in the case of multiple unicast scenario, there are two unicast flows that are sent from each group of sources and are assigned to a corresponding destination as it is described in Figure 17. Obviously, the number of unicast flows increases as the number of destinations increases.
3.6.1 Feedback Rate in a Multi-Link Topology
Figure 18 illustrates the rate of the feedback indications received at the sources of each multicast group with different Qeq threshold values. Figure 19 plots the rate of the feedback indications received at the sources of each multiple unicast group with different Qeq threshold values. The results display a high feedback rate when the Qeq threshold is low. The sources of G1, which are far from CPs, receive fewer feedback frames than those of G2 and G3 in both multiple unicast traffic and multicast traffic. We also find that as the Qeq decreases the generation of feedback frames from CPs increases.
Figure 20 shows the feedback rate for different Qeq thresholds in multiple unicast traffic and multicast traffic scenarios. We notice that when the number of multicast groups increases, in the case of multicast traffic scenario, the network faces a heavier congestion than in the case of multiple unicast scenario observed from the significant feedback rate generated in the multicast scenario compared to the multiple unicast one.
Figure 18:Feedback rate with multicast scenario in multi-link topology
Figure 20:Feedback rate mean in multi-link topology
3.6.2 Loss Rate in a Multi-Link Topology
Figure 21 displays the frame loss rate on the network for the different multicast groups and different Qeq threshold values in the case of a multicast scenario. Figure 22 plots the frame loss rate on the network for different multiple unicast groups and different
Qeq threshold values in the case of multiple unicast scenario. The frame loss rate is
high when the threshold Qeq value gets increased. Frames of G1 where the sources are far from the congested links exhibit less loss than those of G2 and G3. Figure 23 shows that as the number of multicast groups in the case of multicast scenario increases, the loss rate performance criterion degrades much more than in the case of the multiple unicast scenario.
3.6.3 Stability in a Multi-Link Topology
Figure 24 plots the queue length deviation from different values of Qeq threshold at switch 1 of the multi-link topology. Figure 25 shows the queue length deviation from different values of Qeq threshold at switch 2 of the multi-link topology. Figure 26, however, displays the queue length deviation from different values of Qeq threshold at switch 3 of the multi-link topology.
Qeq represents the managed queue length threshold that should not be exceeded.
When the Qeq threshold is low, the deviation from the Qeq equilibrium threshold is high for both mutliple unicast and multicast scenarios. As the number of multi-cast groups increases in the multimulti-cast scenario, the queue resource of the switch gets overused. The queue overuse in a multicast scenario is found to be as large as that of the multiple unicast scenario.
Figures 27, 28, and 29 show the CR standard deviation of G1 traffic, the CR stan-dard deviation of G2 traffic, and the CR stanstan-dard deviation of G3 traffic, respectively, for different Qeq threshold values.
Figure 21: Loss rate for multicast traffic in a multi-link topology
Figure 23: Loss rate of the three groups in multi-link topology
Figure 24:Queue length deviation at queue for different Qeq thresholds in switch 1 of the multi-link topology
seems to be more stable in the case of multiple unicast traffic than the multicast traffic scenario case. However, the stability rate of G2 in a multicast scenario is better than that of the multiple unicast scenario. The stability rate of G3 in a multicast scenario is also better than that of the multiple unicast scenario but only for low Qeq threshold values.
3.6.4 Fairness in Multi-Link Topology
Figure 30 compares between fairness index for each of the groups (G1, G2, G3) for various Qeq thresholds in the case of a multiple unicast scenario. It is worth noticing that the fairness index of G1 shows the best performance, because it has the greatest values of fairness index for different Qeq thresholds, compared to those of G2 and G3. Figure 31 identifies the fairness indexes for the flows of each of the groups (G1, G2, G3) for various Qeq thresholds in the case of multicast scenario. Fairness index of G1 reveals the best fairness index compared to G2 and G3 in the case of a multicast
Figure 25:Queue length deviation for different Qeq thresholds in switch 2 of the multi-link topology
Figure 27:Standard deviation of CR for G1 traffic for different Qeq thresholds in the multi-link topol-ogy
Figure 28:Standard deviation of CR for G2 traffic for different Qeq thresholds in the multi-link topol-ogy
Figure 29:Standard deviation of CR for G3 traffic for different Qeq thresholds in the multi-link topol-ogy
scenario, too.
4
Final remarks
The QCN anticipates congestion and tries to prevent it by undertaking suitable reac-tions at the source to adjust the traffic rate. The QCN uses feedback to capture the variation of queue capacities.
Our results show that a high feedback rate causes sending rate fluctuations and impedes the queue stability at the switches, which leads to frame loss. In addition, the implosion of feedback frames when the feedback rate gets high can overload the upstream path (till the source) and limit the sending rate.
Results show that sources do not suffer from drop to zero problem (congestion collapse). Indeed, the minimum value that can be reached is Rmin = 10 Mbit/s as it is defined by the standard QCN [10].
Table 1 draws a parallel between multicast traffic transmission and multiple unicast traffic transmission performance criteria.
In the case of the multiple unicast scenario, if the number of destinations increases the number of unicast flows will increase accordingly. In addition, congestion in the case of a multiple unicast scenario occurs faster than in the simple multicast one. Therefore, the congestion is far too inadequately controlled compared to the multi-cast scenario. The multiple unimulti-cast scenario generates heavier congestion than the simple multicast scenario; this is obvious from the feedback rate, which is higher in the case of multiple unicast scenario compared to the case of multicast scenario. The high feedback rate makes the frame rate undergo more fluctuations and then, stability is not well maintained. The rate fluctuations at the sources result in queue length
Figure 30:Fairness index for multiple unicast scenario at multi-Link topology
Table 1: A comparison between performance criteria of multicast traffic transmission and multiple uni-cast traffic transmission cases
Performance criteria
Multicast traffic transmission Multiple unicast traffic transmission
The RP
start time congestion detection
- Congestion occurs slower than the multiple unicast traffic transmission sce-nario.
- Congestion occurs faster than the mul-ticast traffic transmission scenario.
Feedback overhead
- The queue generates feedback frames almost steadily with the different pa-rameter values of the threshold Qeq. - The feedback rate is lower than
the multiple unicast traffic transmission case.
- The more the threshold Qeq decreases, the more the queue generate feedback frames.
- The feedback rate is higher than the multicast traffic transmission case. Loss rate - The loss rate is lower than the multiple
unicast traffic transmission case. - As the threshold Qeq increases, the loss
rate also increases.
- The loss rate is higher than the multi-cast traffic transmission case.
- The loss rate increases when the thresh-old Qeq increases.
Stability - The stability is better than the multiple unicast traffic transmission case.
- The stability is not well maintained compared to the multicast traffic trans-mission case.
Fairness - The fairness is better than the multiple unicast traffic transmission case.
- The fairness is worse than the multicast traffic transmission case.
Scalability - The performance criteria degrade in terms of feedback overhead, loss rate, sta-bility and fairness.
- Multicast group that is far from CPs has better performance than those near to CPs.
fluctuations and then a high rate of frame loss. We wanted to evaluate the impact of the Qeq threshold on the QCN scheme. We conducted experiments for different values of Qeq threshold. We found that the more the Qeq threshold decreases, the more the queues generate feedback frames. Indeed, low Qeq threshold values can easily be exceeded and then congestion detection occurs. We also found that as the
Qeq threshold increases, the CR converges to a value that is larger than the CR mean,
which represents the value that the CR of each flow should reach. Consequently, the loss rate increases when the CR converges just over CR mean. We noticed that as the
Qeq threshold increases, loss rate also increases. Indeed, a low Qeq threshold value
leaves a safety margin for burst arrivals of new flows.
The QCN with multicast traffic has a better performance than the multiple uni-cast scenario. However, as the network scales up the performance of the QCN with multicast traffic degrades. Indeed, the frame loss rate increases.
From the tested scenarios, it can be inferred that it is recommended to use 3/4 of the queue length size just like the Qeq threshold values in the case of multicast or multiple unicast traffic if we would like to mitigate the results in terms of feedback implosion. Unlike the unicast traffic, multicast or multiple unicast traffic has many destinations. In one multicast or multiple unicast session, the shared output queues among switches (CP) may suffer from congestion and then send feedback. Therefore, the suggestion of 1/4 Qeq threshold parameter of the queue length as a standard [10] does not fit with the case of multicast or multiple unicast traffic because it generates a high feedback rate.
5
Conclusion and perspectives
Our objective in the present paper was to study the QCN congestion control scheme for Carrier Ethernet in the case of multicast traffic transmission and multiple unicast traffic transmission. QCN is based on congestion notification feedback frames generated by a congestion point (i.e., switch). Notifications are then sent to a data source node to adjust its sending traffic rate. When the source receives feedback, it decreases its rate, and carries out the QCN successive phases: Fast Recovery (FR), Active Increase (AI) and Hyper Active Increase (HAI).
Due to the dearth of studies for the QCN in the case of multicast traffic transmis-sion, this paper investigated the QCN performance as well as the congestion control mechanism, for multicast and multiple unicast traffic. This paper evaluated, through simulations, the QCN performance for multicast and multiple unicast traffic in terms of RP start time congestion detection, feedback rate, loss rate, stability, fairness and scalability. This paper also drew a parallel between the QCN for multicast traffic transmission and that for multiple unicast traffic transmission. In fact, we provided the results of the study of two solutions using the legacy QCN congestion control for multicast traffic transmission. The first solution refers to using the QCN over multiple regular unicast sessions (multiple unicasts). This solution suggests that, when a source wants to send a frame to several destinations, it sends a copy of the frame to each des-tination. When a frame is received at a switch it is forwarded toward its destination interface. The frame is queued at the end of the buffer associated with this interface, and the QCN scheme is applied on this queuing frame. With multiple unicast, only unicast frames circulate on the network and switches do not have to forward multicast frames. The second solution refers to using the QCN over multicast traffic session and can be formulated as follows: when a source wants to send a frame to several destinations, it sends only one copy of the multicast frame. The switches that are at the branching point toward two or more destinations duplicate the multicast frame and forward a copy of the frame on the outgoing interfaces towards each destination. Each copy of the multicast frame is queued at the end of the buffer associated with each interface.
We carried out traffic simulations for different Qeq thresholds. It appears from our findings that the QCN with a multicast traffic has a better performance than the QCN with a multiple unicast traffic. However, the performance of the QCN with a multicast traffic might undergo degradation when the network scales up. Evaluation results show that it is probable that the feedback implosion problem caused by the bottlenecks when the Qeq is low (for example when it is set to 1/4 the queue capacity) could be solved if we choose a high Qeq threshold value, for instance 3/4 of the queue capacity.
Future work should evaluate the QCN for a multicast traffic in the scenario of heterogeneous link parameters and try to find solutions in order to improve the QCN performance in the case of multicast traffic. This should be useful in the ongoing efforts to expand the deployment of Carrier Ethernet.
References
[1] R. Fu, Y. Wang, and M.S. Berger. Carrier Ethernet network control plane based on the next generation network. IEEE Kaleidoscope Academic Conference Innovations
in NGN: Future Network and Services, pages 293–198, May 2008.
[2] R. Fu, M.S. Berger, Y. Zheng, L. Brewka, and H. Wessing. Next generation network based Carrier Ethernet test bed for IPTV traffic. IEEE EUROCON 09, pages 1781– 1787, May 2009.
[3] M.S. Berger, H. Wessing, and S. Ruepp. Proposal for tutorial: Resilience in Carrier Ethernet transport. IEEE 7th International Workshop on Design of Reliable
Communi-cation Networks, pages 381–384, October 2009.
[4] R. Ruepp, H. Wessing, and M. Berger. Protection switching for Carrier Ethernet multicast. IEEE GLOBECOM Workshops (GC Wkshps), pages 1968–1972, December 2010.
[5] L. Fang, R. Zhang, and M. Taylor. The evolution of Carrier Ethernet services-requirements and deployment case studies [next-generation Carrier Ethernet].
IEEE Communication Magazine, V.46, March 2008.
[6] Y. Cai, Y. Yan, Z. Zhang, and Y. Yang. Survey on converged data center networks with DCB and FCoE: standards and protocols. IEEE Network, V.27, 2013.
[7] M. Wadekar. Enhanced Ethernet for data center: Reliable, channelized and robust.
15th IEEE Workshop on Local and Metropolitan Area Network, pages 65–71, June 2007.
[8] A. Greenberg, P. Lahiri, D. A. Maltz, P. Patel, and S. Sengupta. Towards a next generation data center architecture: scalability and commoditization. ACM
work-shop on Programmable routers for extensible services of tomorrow, pages 57–62, 2008.
[9] Cisco System Inc. Data Center Networking: Internet Edge Design Architectures,
March 2003.
[10] IEEE Computer Society. IEEE Std 802.1Qau Amendment 13: Congestion Notification.
Local and Metropolitan area Networks-Virtual Bridged Local Area Networks, 2010.
[11] H. Mliki, L. Chaari, and L. Kamoun. A comprehensive survey on carrier ether-net congestion management mechanism. Elsevier Journal of Network and Computer
Applications, V.47:107–130, January 2015.
[12] W. Jiang, F. Ren, and C. Lin. Phase plane analysis of quantized congestion no-tification for data center Ethernet. IEEE/ACM Transactions on Networking, V.PP, December 2013.
[13] M. Alizadeh, B. Atikoglu, A. Kabbani, A. Lakshmikantha, P. Rong, B. Prabhakar, and M. Seaman. Data center transport mechanisms: Congestion control theory and IEEE standardization. Annual Allerton Conference on Communication, Control
[14] Z. Yan and A. Nirwan. Fair quantized congestion notification in data center networks. IEEE Transactions on Communications, V.61, November 2013.
[15] M. Yamamoto, Y. Hayashi, and H. Itsumi. Improving fairness of quantized con-gestion notification for data center Ethernet networks, minneapolis, mn. IEEE
International Conference on Distributed Computing Systems Workshops, pages 20–25,
June 2011.
[16] Y. Ren, Y. Zhao, P. Liu, K. Dou, and J. Li. A survey on TCP incast in data cen-ter networks. Incen-ternational Journal of Communication Systems, V.27:1160–1172, July 2012.
[17] N. Ansari and Y. Zhang. On mitigating TCP incast in data center networks. IEEE
INFOCOM, pages 51–55, April 2011.
[18] A. L. N. Reddy and P. Devkota. Performance of quantized congestion notification in TCP incast scenarios of data centers. IEEE International Symposium on Modeling,
Analysis and Simulation of Computer and Telecommunication Systems (MASCOTS),
pages 235–243, August 2010.
[19] R. Shu, C. Lin, W. Jiang, and F. Ren. Sliding mode congestion control for data center Ethernet networks. IEEE INFOCOM, pages 1404–1412, March 2012.
[20] A. KAbbani, M. Alizadeh, M. Yasuda, R.Pan, and B. Prabhakar. AF-QCN: Ap-proximate fairness with quantized congestion notification for muti-tenanted data centers. IEEE Symposium on High Performance Interconnects, pages 58–65, August 2010.
[21] M. Alizadeh, A. Kabbani, B. Atikoglu, and B. Prabhakar. Stability analysis of QCN: the averaging principle. ACM SIGMETRICS joint international conference on
Measurement and modeling of computer systems, pages 49–60, 2011.
[22] Y. Tanisawa, Y. Hayashi, and M. Yamamoto. Quantized congestion notification for multicast in data center networks. IEEE International Conference on Cloud
Net-working (CLOUDNET), pages 51–56, November 2012.
[23] Cisco Systems Inc. IP Multicast Technology Overview, 2009.
[24] D. Ooms, B. Sales, W. Livens, A. Acharya, F. Griffoul, and F. Ansari. Overview of
IP Multicast in a Multi-Protocol Label Switching (MPLS) Environment, 2002.
[25] R.H. Middleton, C.M. Kellett, and R.N. Shorten. Fairness and convergence results for additive-increase multiplicative-decrease multiple-bottleneck networks. IEEE
Conference on Decision and Control, pages 1864–1869, December 2006.
[26] R. Jain, W. Hawe, and D. Chiu. A quantitative measure of fairness and discrim-ination for resource allocation in shared computer systems. DEC-TR-301, pages 1–38, September 1984.
[28] M. Zhang, M. Dusi, W.John, and C. Changjia. Analysis of UDP traffic usage on internet backbone links. Annual International Symposium Applications and the
Internet, pages 280–281, July 2009.
[29] S. Bradner. OSI connectionless transport services on top of UDP applicability statement for historic status. RFC 2556, 1999.
[30] S.J. Golestani and K.K. Sabnani. Fundamental observations on multicast conges-tion control in the internet. IEEE INFOCOM, Eighteenth Annual Joint Conference of
the IEEE Computer and Communications Societies, pages 990–1000, Mars 1999.
[31] T. Bonald, L. Massoulie, A. Proutiere, and J. Virtamo. A queueing analysis of max-min fairness, proportional fairness and balanced fairness. Queueing Systems, V.53:65–84, June 2006.