HAL Id: hal-01087210
https://hal.inria.fr/hal-01087210
Submitted on 25 Nov 2014
HAL is a multi-disciplinary open access
archive for the deposit and dissemination of
sci-entific research documents, whether they are
pub-lished or not. The documents may come from
teaching and research institutions in France or
abroad, or from public or private research centers.
L’archive ouverte pluridisciplinaire HAL, est
destinée au dépôt et à la diffusion de documents
scientifiques de niveau recherche, publiés ou non,
émanant des établissements d’enseignement et de
recherche français ou étrangers, des laboratoires
publics ou privés.
Handwritten text segmentation using blurred image
Aurélie Lemaitre, Jean Camillerapp, Bertrand Coüasnon
To cite this version:
Aurélie Lemaitre, Jean Camillerapp, Bertrand Coüasnon.
Handwritten text segmentation using
blurred image. DRR - Document Recognition and Retrieval XXI, Jan 2014, San Francisco, United
States. �hal-01087210�
Handwritten text segmentation using blurred image
Aur´
elie Lemaitre
aand Jean Camillerapp
band Bertrand Co¨
uasnon
ba
IRISA - Universit´
e Rennes 2, Campus de Beaulieu, 35042 Rennes cedex, France;
bIRISA - INSA, Campus de Beaulieu, 35042 Rennes cedex, France
ABSTRACT
In this paper, we present our new method for the segmentation of handwritten text pages into lines, which has been submitted to ICDAR’2013 handwritten segmentation competition. This method is based on two levels of perception of the image: a rough perception based on a blurred image, and a precise perception based on the presence of connected components. The combination of those two levels of perception enables to deal with the difficulties of handwritten text segmentation: curvature, irregular slope and overlapping strokes. Thus, the analysis of the blurred image is efficient in images with high density of text, whereas the use of connected components enables to connect the text lines in the pages with low text density. The combination of those two kinds of data is implemented with a grammatical description, which enables to externalize the knowledge linked to the page model. The page model contains a strategy of analysis that can be associated to an applicative goal. Indeed, the text line segmentation is linked to the kind of data that is analysed: homogeneous text pages, separated text blocks or unconstrained text. This method obtained a recognition rate of more than 98% on last ICDAR’2013 competition.
Keywords: text line segmentation, handwritten document, structure analysis, blurred image
1. INTRODUCTION
Handwritten text line segmentation is still an open problem, as shown by the recent competitions on this topic, for example in ICDAR’2013.1 Thus, if text line detection in printed document is considered as an easy task, the handwriting brings uncertainty in the recognition. Thus, in handwritten documents, the text lines are not regularly spaced. They often overlap each-other. They may have a global slope or a local curvature, which differs from one writer to another, and even inside a given text, from one line to another. These properties are common for many languages, and many scripts: Latin letters, Greek, Bangla... Thus, in the competitions that are proposed in the community, these languages are often mixed.
In this paper, we present our new method for text line detection that has been submitted for ICDAR’2013 text line segmentation competition.1 This method is based on two levels of analysis: a low level analysis of a
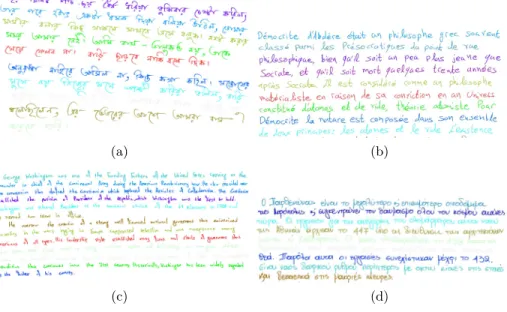
blurred image, and a high level description of a page model. This method is able to deal with the difficulties of the handwritten irregular texts, and with various kinds of scripts (figure 11).
Moreover, our method is implemented with two levels of analysis: a generic low level of primitive extraction, and a grammatical level that enables to introduce some knowledge about each specific kind of document to analyze. Indeed, we consider that it is necessary to take into account the page model of a collection to set up some sepecific recognition strategies or parameters. Thus, the segmentation process may slightly differ if we work on single text blocs, on unconstrained handwritten notes or even in heterogeneous documents that contains both handwritten and printed text. In particular, it is important to decide how to interpret the white spaces bewteen pieces of text lines.This is the kind of information that we want to express with a grammatical description. Consequently, the low level analysis is generic, whereas the introduction of the necessary knowledge is restricted to the grammatical part.
The paper is organized as follows. Section 2 presents some related work on handwritten text segmentation. Then, the sections 3 and 4 detail the two steps of our method. The section 5 shows our results on some various international competition databases and ends by a discussion.
Further author information: (Send correspondence to Aur´elie Lemaitre) Aur´elie Lemaitre: E-mail: [email protected]
Jean Camillerapp: E-mail: [email protected] Bertrand Co¨uasnon: E-mail: [email protected]
2. RELATED WORK
The text line segmentation has been studied in various fields: typewritten documents, historical documents,2
unconstrained documents,3 handwritten documents . . . The presented approaches sometimes only detect the
presence of text lines in the document, by representing the base line of the text. However, some application fields require a more precise segmentation, at pixel level, for example in the case of a pre-processing for handwriting recognition.
We focus on the methods that address the same problem as our, that is to say the segmentation of single handwritten text pages into text lines, at pixel level. This task is defined in the competitions that have been proposed by Gatos et al. in ICDAR’2009,4 ICFHR 20105 and ICDAR’2013.
The results of the segmentation competition5 highlight a few methods that obtained good recognition rates in the previous years. Thus, Louloudis et al.6 present an efficient method based on Hough transform mapping.
This method requires various post-processing treatments that are based on the presence and the re-segmentation of connected components.
Papavassiliou et al.7 apply a smooth version of the projection profile. They base their analysis on an over-segmentation of the document into small regions; those regions are then classified into text and gap regions using a HMM. Their method is convenient to deal with skew and irregular patterns but has limits when the majority of the characters are broken into many fragments.
More recently, another approach has been proposed in.8 It combines several different existing techniques such
as vertical projections, grouping connected components, nearest neighbor. This work is applied on ICFHR’2010 database, but it cannot be compared to the other participants as the used metric is different.
All those methods presented for the competition often seems dedicated to the specific database of the com-petition, that is to say single column handwritten pages.
We ourselves took part to the previous competition with a method based on the perceptive vision.9 In this
method, we proposed to combine two points of view of the document. In a low resolution image, we use a line segment extractor based on Kalman filtering to predict the position of the text lines in the document. We verify this prediction by taking into account the presence of connected components in a high resolution level of image. This approach has shown its limits during ICFHR’2010 competition: the extraction of line segments is realized at a very low resolution (image dimensions are divided by 16). Thus, it is sensitive to very small variations of the image, and to quantization noise.
In this paper, we present our new method. We keep thinking that combining two ways of interpreting the image can improve the recognition, as the human brain combines several perceptions for the interpretation of a scene. That is why we propose to combine two levels of analysis: the extraction of significant black regions in a blurred image, and an analysis of connected component.
Our low level analysis is close to the one proposed in.3 However, the difference with this method is the way we combine the two perception levels. Thus, we propose to use a grammatical description of the page model, in order to introduce some knowledge on ”how to combine the two points of view”, depending on the context of application. Thus, we estimate that, in order to have a better recognition of text lines, it is necessary to include knowledge about the page context. Indeed, the thresholds or the parameters may differ when finding text lines on handwritten or printed documents, in single column text (figure 11), in multi column text (figure 5) or in unconstrained documents with erasures or word insertions.3
That is why we separate two levels of analysis: a low level analysis that is generic and enables to detect the significant black regions (with high density of black pixels) on any kind of document; and a high level analysis, based on a grammatical description, which enables to introduce the necessary dedicated knowledge, for the recognition of a kind of page model. An overview of our method is proposed on the flowchart of figure 1.
Figure 1. Overview of the steps of the proposed method
3. LOW LEVEL IMAGE ANALYSIS
The goal of the low level image analysis is to extract some indications about the position of text lines, called line axes, without introduction of knowledge about the page model. Thus, this part of the work is generic and can be applied for the detection of text lines in various kinds of documents.
The low level image analysis is based on a blurred image. It is composed of two steps: the extraction of significant black regions in the image to build parts of line axes, and the construction of line axes.
3.1 Extraction of significant black regions
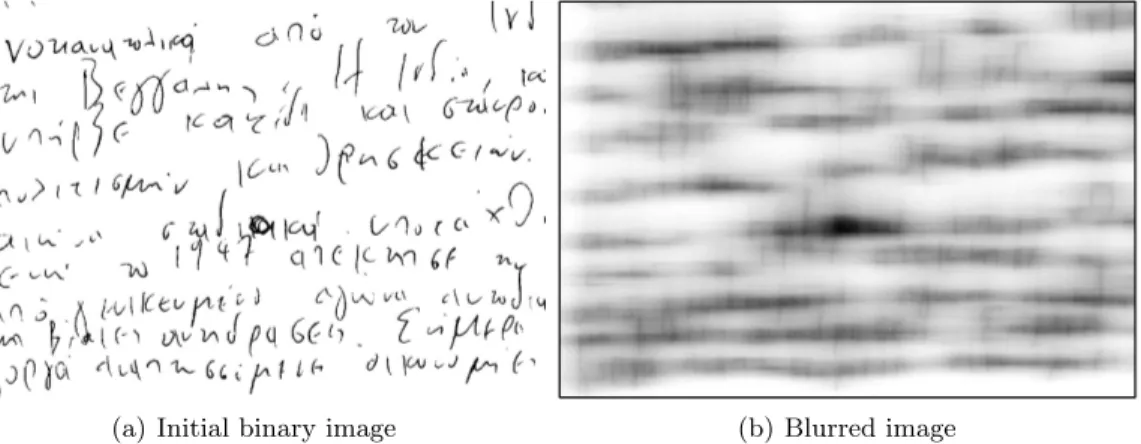
The analysis is based on a binary image (the image is binarized if necessary). On the first step, the image is blurred. For this purpose, we use a recursive low pass filter with IIR (Infinite Impulse Response). An example of blurred image is shown on figure 2.
(a) Initial binary image (b) Blurred image
Figure 2. Construction of the blurred image
Then, a double binarization is applied on the blurred image, as presented on figure 3. We first compute the average grey-level of the blurred image, and use this value as a threshold for the first binarization. It gives some rough indication on the zones that contains text (in red on figure 3(a)). As we work after a low pass filter, we use only a sub-sampling of the columns. For the second binarization, we compute a threshold for each run-lentgh in a column of the image that contains some text: the threshold value is 50% of the darkest black pixel of the run-length. We obtain the second binarization (in blue on figure 3(b)). This second binarization corresponds to the presence of significant black regions in the image that will be used to build the line axes.
(a) First binarization (b) Second binarization Figure 3. Double binarization of the blurred image, with a sub-sampling of the columns
The interest of this method is that we can find the significant black region, and the method is not very sensitive to the size of the characters or of the vertical line spacings.
3.2 Construction of line axes
Once the significant black regions have been detected, they are used to build line axes. We study the black regions, column after column, with a criteria of position and thickness to link them. When the black regions have a regular position and thickness among several columns, we produce a line axis. Some example of produced line axes are presented on the figure 4(a). This first step of analysis enables to compute an average thickness of the black regions, and an average slope of the document. Those thickness and slope are then used for the extension of the line axes.
(a) Analysis of significant black regions (b) Final line axes Figure 4. Construction of line axes
We then classify the pieces of line axes depending on their average thickness, relatively to the medium thickness on the page:
• when two line axes have a medium thickness and a regular slope and position, they are grouped into a single line axis,
• a line axis with a too thin thickness is removed, it may not correspond to a significant text line, • a line axis with a too large thickness is studied to determine if it corresponds to:
– an error in the construction of the significant black region: there is a single black region that corre-sponds to two text lines;
– a larger text zone in the initial document, such as capital letters, title. . .
At the end of this low level treatment, we obtain the line axes as presented on figure 4(b). The line axes are not complete, but at that low level, we cannot determine if the holes between the axes correspond to an incomplete line (like in image 4(b)) or to a real blank in the document, for example between two columns (figure 5). That is why we delegate to the page model the role to combine the line axes into text lines.
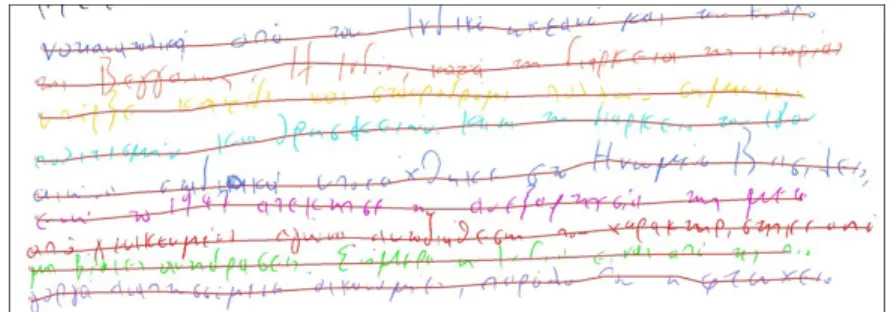
Figure 5. Example of extracted line axes on a mail document
4. GRAMMATICAL DESCRIPTION OF THE PAGE MODEL
This second step aims at building the text lines of the document, using the line axes that have been detected at the low level image analysis. In this second step, it is necessary to express some knowledge about the kind of images that are studied. Thus, the process of text line construction may vary if we study regular single column text pages, isolated text blocks or multi-column text pages, such as mail pages, or even totally unconstrained text pages. Depending on the organization of the document, the aligned or close line axes must be gathered together into a single text line, or must remain separated with two isolated text lines.
In order to externalize the knowledge related to the page model, we propose to express it using a grammatical description of the page. This grammatical description is based on two kinds of primitives: the connected components and the line axes extracted at the previous step (figure 6). The grammatical description of the page model can include two steps for line recognition: the localization of the text lines in the document, and then the assignment of the pixels to the text lines.
In this paper, we present the page model that has been applied for ICDAR’2013 competitions. The images contain single column text. The images do not contain extra information as images or graphics, that is to say all the pixels belong to a text line. Consequently, our grammatical description of the content must join together the line axes that belong to the same text line.
Figure 6. Input data for the grammatical step: line axes and connected components in red
4.1 Localization of text lines
The localization of text lines exploits the presence of line axes to compute the global text lines. As we have seen previously, the line axes are not always complete, and the page model must define whether they have to be linked with each other or not.
However, the handwritten nature of the document makes it not so easy: the text lines may contain some slope, some curvature. A brutal concatenation of line axes at a global level is too rough to produce the global
segmentation. That is why we propose to locally use the presence of connected components to build the text lines.
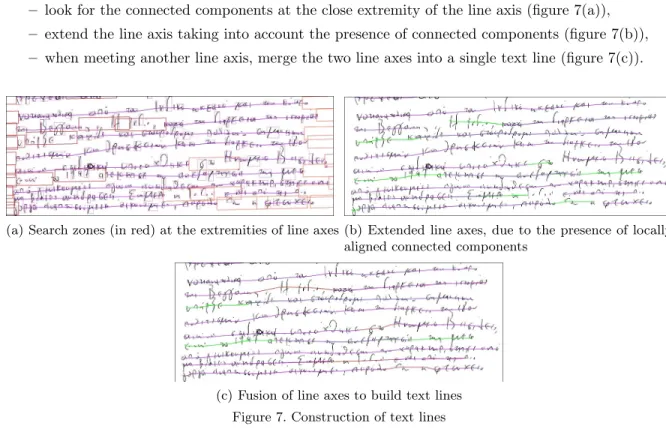
Our grammatical description follows the rules below: • For each line axis
– look for the connected components at the close extremity of the line axis (figure 7(a)), – extend the line axis taking into account the presence of connected components (figure 7(b)), – when meeting another line axis, merge the two line axes into a single text line (figure 7(c)).
(a) Search zones (in red) at the extremities of line axes (b) Extended line axes, due to the presence of locally aligned connected components
(c) Fusion of line axes to build text lines Figure 7. Construction of text lines
This description enables to build the text lines that are directly deduced from the line axes. However, sometimes some line axes are not detected at all on text lines, more particularly on short text lines. Thus, when the density level of black pixels is too weak, we cannot detect any significant black region on the blurred image. To deal with that limit, we add a second rule in our grammatical description:
• For each isolated connected component that does not belong to a text line – look for the neighbor connected components,
– build a text line when finding an isolated set of aligned connected components.
This step enables to build some additional text lines (in red on figure 8), that had been forgotten in the blurred image analysis.
At that step of the analysis, we know the position of each text line in the document. This information can be sufficient, depending on the context of application, mainly for global structure document recognition. However, for certain tasks such as handwriting recognition, it is necessary to know which pixel belongs to each text line. This association is realized in the next step of analysis.
4.2 Assignment of pixels to text lines
The assignment of each pixel to a text line is realized using a grammatical description of the document. Thus, this step of analysis requires some specific knowledge, linked to the field of application: do we need a precise assignation of each pixel? is each pixel associated to a given text line or is there some unassigned noise pixels?
In the proposed model, used for ICDAR’2013 competition, each pixel must be assigned to a given text line. That is what we express in our grammatical description. In order to simplify the assignment of pixels, we use the entity of connected component: each connected component is assigned to a text line. However, when necessary, we can re-segment the conflicting connected components, so that they are associated to several text lines.
Our grammatical description follows the rules below: • For each connected component
– look for the upper and lower nearest text lines,
– identify the connected component as conflicting if it is near at least two text lines, taking into account the base lines of the upper and the lower text lines (figure 9(a)),
– re-segment the conflicting connected components, using the medium position between upper and lower baselines (figure 9(b)).
• After the re-segmentation, for each connected component
– assign the connected component to the nearest text line (figure 10).
(a) Identification of possible conflicting connected com-ponents
(b) Re-segmentation of connected components when touching two text lines
Figure 9. Re-segmentation of connected components
5. EXPERIMENTS
We present the application of our handwritten text line segmentation method on public available databases. We first present the databases and metrics, and our comparative results. We show that we have applied our method on several international databases. We present our results on ICDAR’2013 competition, the comparison with our previous Kalman based method and with the other participants of the competiton. We evaluate the quality of our text-line detection system. We then discuss the interests and the limits of our approach.
5.1 Databases and metrics
We apply our method on five different databases, all provided by Gatos, Stamatopoulos and Louloudis for the different international competitions of the past years: ICDAR’2009,4 ICFHR’2010,5 and ICDAR’2013. In
addition of the three competition databases, we also present our results on the two training databases that were provided to the participants.
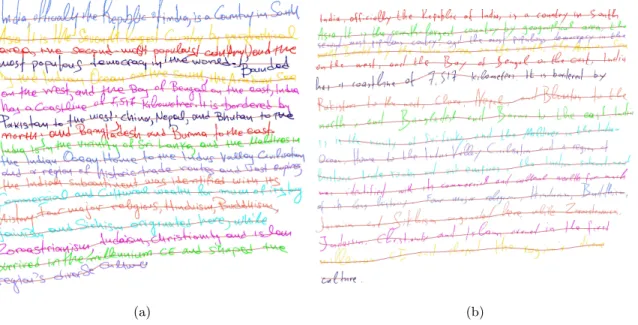
The properties of those five databases are presented on table 1: each database is made of 100 or 200 images. The images are handwritten document pages in various scripts and languages: French, English, Latin, Greek, and India Bangla. Some examples of the proposed images are presented on figures 11 and 12 .
(a) (b)
(c) (d)
Figure 11. Example of obtained line segmentation results, on images with various scripts and languages
The metric used is the one proposed by Gatos et al.4 For each text line, we compute the rate of pixels that has been correctly labeled. If this rate is bigger than a threshold called Ta, Threshold of acceptance, then the text line is considered as recognized. By default, Ta equals 95%, which means that a text line is recognized if 95% of its pixels have been correctly labeled.
Let N the number of lines present in the ground-truth, M is the number of text lines retrieved in the hypothesis, and o2o is the number of recognized text lines, according to the Ta threshold. Three values are then computed:
• the Detection Rate, DR=o2o/N, • the Recognition Accuracy, RA=o2o/M,
• the performance metric FM=2*DR*RA/(DR+RA).
5.2 Results
(a) (b)
Figure 12. Example of obtained line segmentation results, on images with difficulties: overlapping text lines, varying slope and curvature
5.2.1 Application to various databases
First, we apply our method on the five databases that we have presented above. The table 1 presents the obtained performances. We have mainly trained our method on the two training databases. The results show that the recognition rates are quite stable between 98 and 99%. The slight variations from one database to another come from very small differences of difficulty on the images.
Database 2008 training ICDAR’2009 ICFHR’2010 2013 training ICDAR’2013 competition competition competition
Image nb 100 200 100 200 150
Line nb 2242 4034 1629 3727 2679
FM 98,10% 99,52% 99,35% 99,26% 98,06%
Table 1. Properties of several competition databases and comparative results obtained by our method
5.2.2 Results on ICDAR’2013 competition
We now present the performances of our method for ICDAR’2013 competition. The method that has been presented for the competition is called Submitted method. However, we must precise that our method was not totally achieved when we had to take part to ICDAR’2013 competition. Thus, we have kept going on improving our method, after the submission for the competition, but before obtaining the competition image database. We call Last version of our method the last obtained method.
When we received the competition database, we could compare three methods:
• our previous method, based on Kalman filtering,9 that took part to ICFHR’2010 competition,
• the submitted method, that took part to the ICDAR’2013 competition, • the achieved last version of our method.
The table 2 presents the comparative recognition rates on the competition database. The results shows that our new method based on blurred image significantly improves the results, compared with our Kalman based
filtering method: FM rates goes from 94.6% to 98.0%. This is due to the limits of the method based on Kalman filtering. We can also notice that the last version is slightly better than the submitted method.
Database Previous Kalman method Submitted method Last version of our method
DR 94,9% 97,8% 98,4%
RA 94,2% 96,9% 97,7%
FM 94,60% 97,38% 98,06%
Table 2. Comparative results of our three methods on ICDAR’2013 competition
5.2.3 Comparative results with other participants
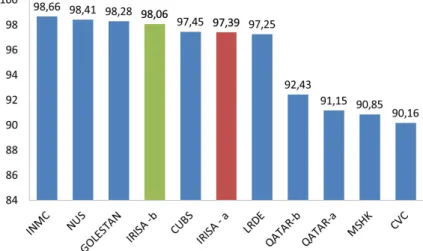
In order to evaluate our new method in comparison with the other approaches, we present some results on the ICDAR’2013 competition, on figure 13. The blue items are the methods that were proposed by the other participants of the competition in 2013.1 The red item presents our participation in 2013. Our method is in the best five ones, over 13 proposed methods. The green item presents the rate obtained with our last version of the method: it obtains the third place with a FM rate of 98.06%.
Figure 13. Comparative results on ICFHR’2013 competition: results obtained by all the participants, including our latest version, named IRISA-b
5.2.4 Quality of the text line detection
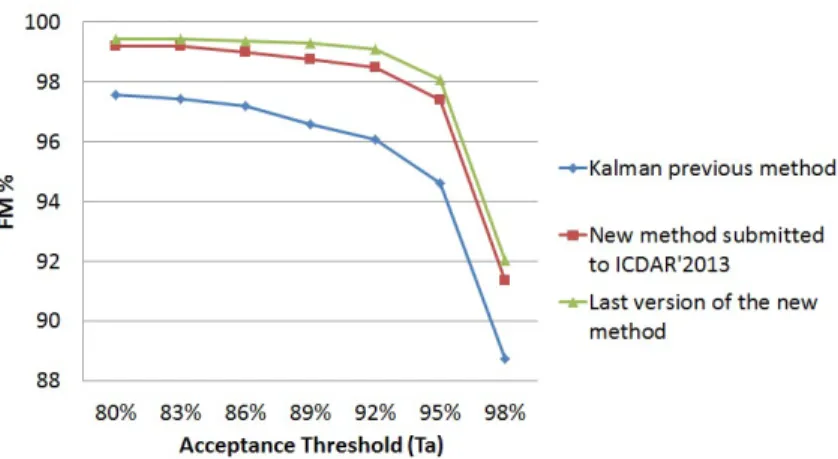
As presented in the metric section 5.1, the result rates are strongly linked to the threshold of acceptance Ta, which is the rate of pixels correctly affected to recognize one line. By default, this rate is 95%. Thus, sometimes, a text line that is quite well detected, for example with 92% of pixels will be count as 0 in the final rate FM. In order to evaluate the global quality of the detected text line, we propose to study the evolution of our systems, depending on the threshold of acceptance Ta (figure 14). These results show that our new method is able to localize more than 99% of text lines, even if sometimes only 89% of pixels are correctly assigned. This is really much better than the previous Kalman filtering method that reaches a maximum at 97% of text lines.
These results shows that the main limit of our method is the association of pixels to the text lines. We will discuss that point in the following section.
5.3 Discussion
The results have really been improved, by comparison with our previous work. The strength of this method comes from the combination of two levels of analysis of the image: the blurred image at a global level and the
Figure 14. Comparison results for text line segmentation using various acceptance threshold values on the competition 2013 database.
connected components at a local level. This combination enable to deal with the difficulties met in handwritten documents: irregular slope, curvature and overlapping text lines.
Thus, the construction of line axes on the blurred image is very convenient in high density zones of text (figure 15(a)). On those kinds of images, the analysis of connected components would be difficult because of the overlapping text lines that require a lot of re-segmentation.
On the opposite, in the locally low density images, the analysis of the blurred image is incomplete (figure 15(b)), because some significant black regions are difficult to extract. However, on those images, it is very easy to follow the local presence of connected components to find the presence of a text line, because the connected components are well isolated.
(a) The blurred image enables a good line seg-mentation in high density zones.
(b) In low density zones, the blurred images gives incomplete lines, which can be easily improved by the connected component analysis
Figure 15. Interest of the cooperation between blurred image and connected components analysis
We will now discuss the limits of our method. As presented in the results, we are missing about 1% of text line in the segmentation process. The main limit of our method is due to the assignation of the pixels to the text lines.
On the one hand, our method for re-segmenting connected components on overlapping text lines is really rudimentary (figure 16(a)): the connected components are roughly segmented in the middle position between the upper and the lower lines. We should improve this segmentation.
On the other hand, the connected components are associated to the nearest text line, which presents limits with very small and segmented connected components, like on figure 16(b): the upper pixels of the second line are allocated to the first one.
6. CONCLUSION
In this paper, we have presented the method that took part to the ICDAR’2013 handwritten segmentation competition.
(a) Limits of our method for the re-segmentation of connected components
(b) Difficult pixel affectation in dotted text lines
Figure 16. Main limit of our method: assignation of pixels to lines
This method is based on the cooperation of two levels of analysis of the image: the low level analysis of a blurred image, that gives some indications about the position of line axes, and a local analysis of connected components in order to obtain the precise position of text lines. We have shown in the results that those two levels of analysis are complementary as they enable to address different difficulties, in high density zones of black pixels, such as in low density zones.
Moreover, those two steps of analysis can be reused in other kinds of document processing. Thus, the first step of blurred image analysis is generic and can be applied for searching significant black regions in any kind of document. The second step contains the page model. We choose to use a grammatical description. Thus, for studying a new kind of document, it is only necessary to change the knowledge contained in the page model. For example, we could easily describe the text lines present in a multi-block document such as mail document by only changing the page model (figure 5).
For the future work, we should focus on the assignment of pixels to the text lines, and more particularly the re-segmentation of connected components, which is too rough in the current version. We will also focus on applying our text line segmentation method on other kinds of document. The difficulty for that purpose is to evaluate the text line segmentation as few public databases are available with a ground truth at pixel level.
REFERENCES
1. N. Stamatopoulos, B. Gatos, G. Louloudis, U. Pal, and A. Alei, “Icdar 2013 handwriting segmention contest,” in 12th International Conference on Document Analysis and Recognition, 2013.
2. L. Likforman-Sulem, A. Zahour, and B. Taconet, “Text line segmentation of historical documents: a survey,” International Journal on Document Analysis and Recognition 9, pp. 123–138, Apr. 2007.
3. Y. Li, Y. F. Zheng, D. Doermann, and S. Jaeger, “Script-independent text line segmentation in freestyle handwritten documents,” IEEE Trans. Pattern Analysis and Machine Intelligence 30, pp. 1313–1329, Aug. 2008.
4. B. Gatos, N. Stamatopoulos, and G. Louloudis, “Icdar2009 handwriting segmentation contest,” International Journal on Document Analysis and Recognition (IJDAR) 14(1), pp. 25–33, 2011.
5. B. Gatos, N. Stamatopoulos, and G. Louloudis, “Icfhr 2010 handwriting segmentation contest,” Frontiers in Handwriting Recognition, International Conference on , pp. 737–742, IEEE Computer Society, (Los Alamitos, CA, USA), 2010.
6. G. Louloudis, B. Gatos, I. Pratikakis, and C. Halatsis, “Text line and word segmentation of handwritten documents,” Pattern Recognition 42, pp. 3169–3183,, Dec. 2009.
7. V. Papavassiliou, T. Stafylakis, V. Katsouros, and G. Carayannis, “Handwritten document image segmenta-tion into text lines and words,” Pattern Recognisegmenta-tion 43, pp. 369–377,, Jan. 2010.
8. I. Messaoud, H. Amiri, H. Abed, and V. Margner, “A multilevel text-line segmentation framework for hand-written historical documents,” in Frontiers in Handwriting Recognition (ICFHR), 2012 International Con-ference on, pp. 515–520, 2012.
9. A. Lemaitre, J. Camillerapp, and B. Co¨uasnon, “A perceptive method for handwritten text segmentation,” in Document Recognition and Retrieval XVIII, 2011.