HAL Id: hal-01224577
https://hal.archives-ouvertes.fr/hal-01224577
Submitted on 19 Nov 2015HAL is a multi-disciplinary open access archive for the deposit and dissemination of sci-entific research documents, whether they are pub-lished or not. The documents may come from teaching and research institutions in France or abroad, or from public or private research centers.
L’archive ouverte pluridisciplinaire HAL, est destinée au dépôt et à la diffusion de documents scientifiques de niveau recherche, publiés ou non, émanant des établissements d’enseignement et de recherche français ou étrangers, des laboratoires publics ou privés.
IBRACS Integrating Bioavailability in Risk Assessment
of Contaminated Soils: opportunities and feasibilities.
Final research report
Dan Berggren Kleja, Anja Enell, Michael Pettersson, Jurate Kumpiene,
Gerard Cornelissen, Hans Peter Arp, Joan Dupuy, Pierre Leglize, Stéphanie
Ouvrard, Thibault Sterckeman, et al.
To cite this version:
Dan Berggren Kleja, Anja Enell, Michael Pettersson, Jurate Kumpiene, Gerard Cornelissen, et al.. IBRACS Integrating Bioavailability in Risk Assessment of Contaminated Soils: opportunities and feasibilities. Final research report. [Contract] auto-saisine. 2015, 178 p. �hal-01224577�
SNOWMAN NETWORK
Knowledge for sustainable soils
Project No. SN03-06
IBRACS
Integrating Bioavailability in Risk Assessment of Contaminated Soils: opportunities and
feasibilities
Final Research Report
Start date of project: 01.10.2011 Project duration: 36 months (year 1 – year 3)
End date of project: 30.09.2014 Date of report: 22.12.2014
Project coordinator:
Dan Berggren Kleja
2 Acknowledgements
The present study was supported by the Public Waste Agency of Flanders and the General Operational Direction of Agriculture, Natural Resources and Environment of the Public Service of Wallonia (SPW), the Swedish Research Council for Environment, Agricultural Sciences, and Spatial Planning (Formas), the Swedish Geotechnical institute and Agence de l’Environment et de la Maltrise de l’Energie (ADEME). The work was made within the research project ‘Integrating Bioavailability in Risk Assessment of Contaminated Soils: opportunities and feasibilities’, which was founded by the SNOWMAN network.
The work on PAH ecotoxicity and plant uptake of PAHs was performed in close collaboration with the SNOWMAN program PACMAN (headed by Staffan Lundstedt, Umeå University).
The report authors are:
Dan Berggren Kleja, Swedish Geotechnical Institute (project leader) Anja Enell, Swedish Geotechnical Institute
Michael Pettersson, Swedish Geotechnical Institute Jurate Kumpiene, Luleå University of Technology Gerard Cornelissen, Stockholm University
Hans Peter Arp, Norweigian Geotechnical Institute
Joan Dupuy, Université de Lorraine/ Institut National de la Recherche Agronomique Pierre Leglize, Université de Lorraine/ Institut National de la Recherche Agronomique Stéphanie Ouvrard, Université de Lorraine/ Institut National de la Recherche Agronomique Thibault Sterckeman, Université de Lorraine/ Institut National de la Recherche Agronomique Erik Smolders, Katholieke Universiteit Leuven
Fanny Hamels, Katholieke Universiteit Leuven Philippe Sonnet, Université Catholique de Louvain
3
EXECUTIVE SUMMARY
In all countries in Europe, and probably the rest of the world, soil quality criteria (SQC) are based on total concentrations of contaminants. Indeed, the total concentration is an indicator of toxicity, but vast amounts of laboratory and field studies have shown that biological effects are not directly related to the total concentration. Instead, soil organisms respond to the fraction of contaminant that is biologically available. One way to deal with bioavalability is to use biological tests directly, with the aim to cover relevant organisms and/or soil functions. Although being of high relevance, biological tests are generally costly, time consuming, and complicated to perform and evaluate, which limits their use in practical risk assessments. In this respect, chemical methods offer an alternative, having the potential to be faster, cheaper and easier to commercialise. However, before any chemical bioavailability method can be used in a risk assessment framework, a corresponding reference system based on ecotoxicity test data must have been developed. In other words, we need a framework that relates the measured bioavailable concentration to predefined ecosystem protection goals, e.g. protection of a certain fraction of species. To our knowledge, no such “official” framework including a bioavailablity methodology yet exist in any country. By introducing bioavailability in risk assessment frameworks, the accuracy of the assessment is expected to increase, which are expected to save money and result in more sustainable remediation actions.
The overall aim of IBRACS has been to provide policymakers, other authorities and service providers with guidelines on how chemical bioavailability tests and results of bioavailability-based risk assessment models can be used for risk-based management decisions on contaminated land. The specific objectives were:
1) To review existing risk assessment models for soils in Sweden, Belgium (Flanders, Wallonia) and the Netherlands with focus on bioavailablity.
2) To evaluate the ability of so-called passive samplers and established soil extracts to predict toxic responses of plants to exposures of metals (Cu, Ni, Zn) and organic contaminants (polycyclic aromatic hydrocarbons, PAHs).
3) To evaluate plant uptake models and soil tests for PAH and how to incorporate them into risk assessment models.
4) To make a cost-benefit analysis of including bioavailability tests in site specific risk assessment. 5) To give recommendations on how to integrate chemical bioavailability tests in risk assessment
frameworks (Cu, Zn, Ni and PAH).
The review of risk assessment models used for deriving SQC showed that soil property corrections only are made in the Flanders (OVAM, 2008) and Dutch (VROM, 2009) models. However, the equations used for metals in the two countries are of different origin; in the Flanders model the equations are derived from ecotoxicological tests, whereas in the Dutch model the equations are based on regression analyses of observed background concentrations in nature area's and "unpolluted agricultural areas". For PAHs the equations used for soil property correction are similar in both countries/regions, i.e. based on the theory of equilibrium partitioning of PAHs between the water and organic matter phases.
4
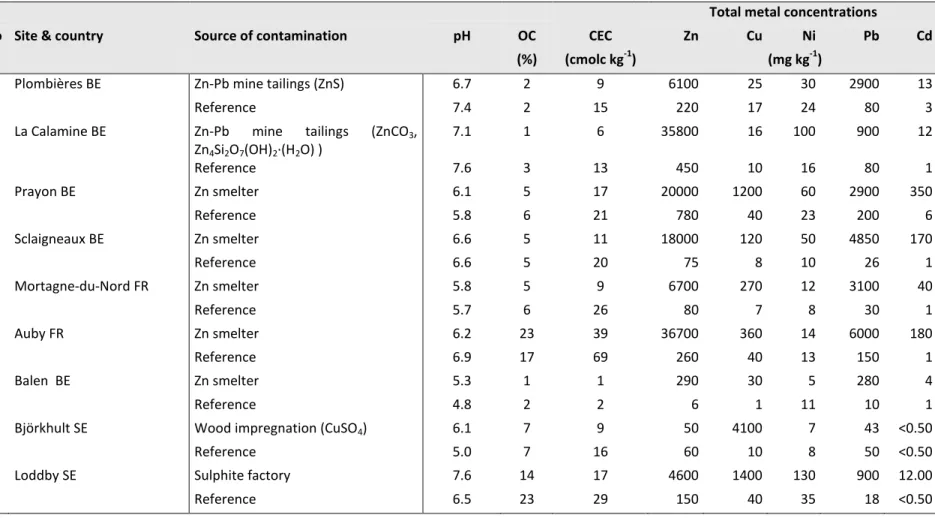
The work on metal toxicity aimed to identify a chemical method that accounts for bioavailability and is applicable on historically contaminated soils. The method should ideally draw on existing soil limits that are based on soils spiked with metal salts. For that reason we compared the toxic response of barley in nine Zn or Cu contaminated soils and in corresponding ZnCl2 or CuCl2 spiked reference soils. In total,
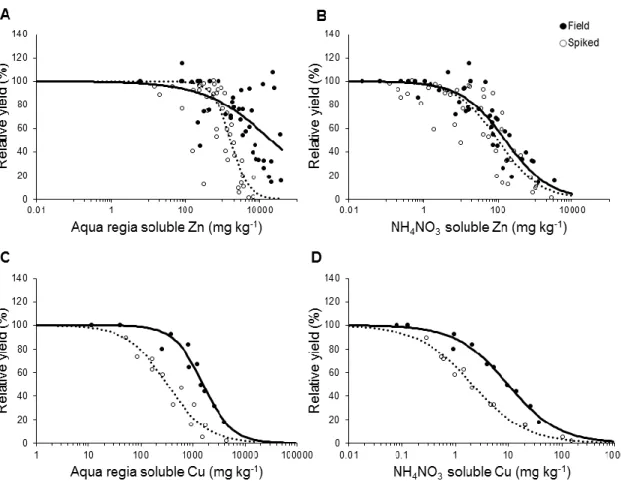
eight different soil tests were compared, including six soil extracts, diffusive gradients in thin films (DGT) and an isotopic exchange method using stable isotopes. Total metal toxicity to barley seedling grown in the field contaminated soils was up to 30 times lower than in corresponding spiked soils. Total metal (aqua regia soluble) toxicity thresholds (EC50) varied with factors up to 260 (Zn) or 6 (Cu) among soils. For Zn, variations in EC50 thresholds decreased as aqua regia > 0.43 M HNO3 >0.05 M EDTA > 1 M
NH4NO3 > cobaltihexamine > DGT > 0.001 M CaCl2, suggesting that the latter extraction is the most
robust phytotoxicity index for Zn. The EDTA extraction was the most robust for Cu contaminated soils. Converting the limits for Zn using an intensity based soil test (e.g. 0.001 M CaCl2) to obtain an estimation
of bioavailable metal requires a full recalibration exercise, i.e. numerous tests (different species, endpoints, soils) with associated doses confirmed with methods such as, for instance, 0.001 M CaCl2.
Practically, this is a huge task. Instead, the isotopic dilution method offers a pragmatic solution. The relative metal toxicity found in barley tests (EC50 for historically contaminated soils/EC50 for spiked soils) corresponded well with the fraction of aqua regia soluble (total) metal that is isotopically exchangeable. Accordingly, the fraction of isotopically exchangeable metal can be used as a site specific measure of a “leaching/ageing factor” (L/A factor). The concept of L/A factor is presently used in a well established software for deriving soil ecotoxicological limits for metals, i.e. the soil PNEC calculator (http://www.arche-consulting.be/metal-csa-toolbox/soil-pnec-calculator/). In that software, as in the EU risk assessment, generic values for L/A factors are being used, e.g. a value of 3 has been selected for Zn contaminated soils and a factor of 2 for Cu (Smolders et al., 2009). A revised version of the soil PNEC calculator has been developed by the consulting company ARCHE, in collaboration with IBRACS, that allows for the entry of site specific L/A factors. Since an increasing proportion of laboratories have been equipped with ICP-MS, stable isotopes can now be used instead of radiosotopes, i.e. isotopic exchange methods are no longer limited to facilities with permission to use radio isotopes.
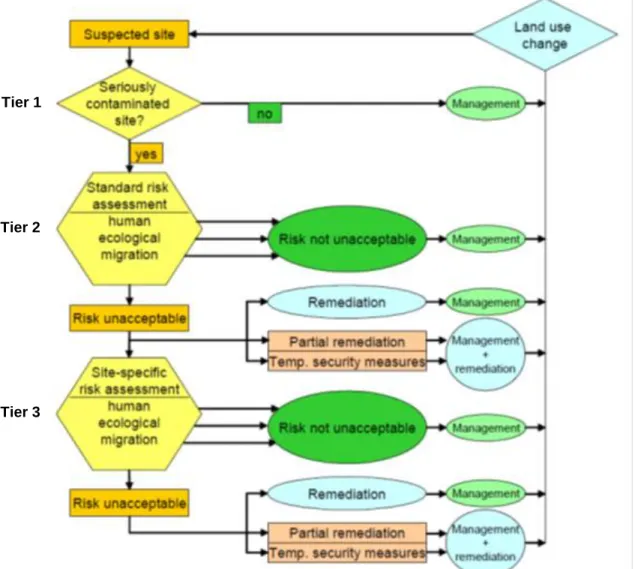
We propose the following approach to integrate different chemical measures of metal toxicity in a tierd ecological risk assessment: in tier 1 total concentrations are analysed and compared with national generic soil limits; in tier 2 soil type specific soil limits are obtained by the PNEC-calculator using total metal concentration, clay content, organic matter content and pH as input values; in site specific tier 3 risk assessments, soil and contaminant specific soil limits are obtained by applying the isotopic dilution method to obtain site specific L/A factors, which can be used as inputs to the revised version of the PNEC-calculator. Note that this approach can be used as an integrated part of a more extensive site specific ecological risk assessment procedure, also involving toxicological and ecological measures of “risks”, like the Sediment Quality Triad (Chapman 2000).
The feasibility of introducing the tier 1 and 2 procedures into the soil law currently in place Wallonia was the focus of a case study investigation. Copper was chosen as the pollutant and a method inspired by the PNEC calculator was adopted to develop new soil limit values protecting ecosystems. Both local pollution and proximal atmospheric pollution taken ito consideration. The feasibility study demonstrated that
5
bioavailability could readily be introduced into one of the steps of the legal procedure that allows the most flexibility, namely tier 1 of the risk assessment studies. Concrete proposals have also been suggested which could allow for further developments for taking bioavailability into account at the tier 2 level.
The tier 3 procedure was used to calculated site specific guideline values for two metal contaminated sites, Björkhult in Sweden (Cu) and La Calamine in Belgium (Zn). The Björkhult site was used for impregnation of telegraph poles by so called Boucherie method using 1.5-2% copper sulphate solution as an impregnation agent. The area was severly contaminated with total Cu concentrations up to 2190 mg/kg dw. The site-specific L/A factor was 2.3, i.e. close to the default L/A factor for Cu of 2.0. The calculated site specific PNEC value for ecological risks was similar to the Swedish generic guideline value (less sensitive landuse, 200 mg/kg). As a result, no substantial changes in the final conclusions regarding the site management to the ones suggested by the previous site investigators could be made. In contrast, when applying the proposed site specific risk assessment procedure on the La Calamine site, the site specific risk limit became considerable higher than the Walloon generic trigger values for soil Zn. La Calamine is one of the two most important mines along the Geul river. A significant fraction of Zn is bound in ore minerals. The site specific L/A factor was about one order of magnitude higher than the default L/A factor (35 vs. 3), which resulted in PNEC concentrations in the range 2000-2800 mg/kg dependent on soil type. The generic trigger values for soil Zn in residential areas and industrial sites in Wallonia is 230 and 320 mg/kg, respectively. At this site it would be a considerable cost-saving if the proposed tier 3 procedure is applied in the site specific risk assessment.
Regarding PAH ecotoxicity assessment, we have evaluated the option to use a passive sampler method, in combination with the equilibrium partitioning theory, as a basis for a risk assessment framework. The equilibrium passive sampler polyoxymethylene (POM) was used to assess the bioavailability of native polycyclic aromatic hydrocarbons (PAHs) in 22 diverse historically contaminated soils (coke work, gas work and wood tar sites), alongside the lipid concentrations in exposed worms (Enchytraeus crypticus). The soils studied covered a wide range in soils properties, including texture, pH and organic carbon content. Total concentrations of PAHs in soils varied considerably (0.27 - 2651 µg/g); so did the corresponding POM derived pore water concentrations (0.02 - 460 µg/). One major finding was that the TOC normalized partition coefficients for PAHs was about one order of magnitude higher than those recommended by national agencies, like the United States Environmental Protection Agency (USEPA) for sediments and the Netherlands' National Institute for Public Health and the Environment (RIVM) for soils and sediments, i.e. the sorption of PAHs was significantly stronger in the historically contaminated soils than in “spiked soils” normally used in toxicity experiments. This illustrates the need to actually measure pore water concentrations in historically contaminated soils as a first step in a site specific risk assessment that accounts for bioavailability.
Soil quality standards and critical limit values for non-polar organic compounds, like PAHs, are in most countries based on the assumption of equilibrium partitioning. According to this theory, freely dissolved PAHs in the pore water are in equilibrium with both the soil organic matter component and the lipid phase of soil organisms. Our results support that the assumption of equilibrium partitioning also holds
6
for diverse historically contaminated soils; i.e. we found strong correlations between pore water concentrations and lipid concentrations for the investigated PAHs.
A key issue in a risk assessment framework that uses chemical methods for assessing a “bioavailable” concentration or fraction is to develop a reference system to which this concentration or fraction can be related. In this respect we draw on a recent RIVM compilation (Verbruggen, 2012). Here, “critical lipid concentrations” for a wide range of organisms (soils, sediments and waters) were presented. The critical lipid concept is based on the assumption that toxicity of individual PAHs is similar after entering the cell membrane (narcosis model). The RIVM compilation resulted in two proposed “critical lipid concentration”, corresponding to two sets of critical pore water concentrations for individual PAHs, indicating “no risk” (Maximum Permissible Concentration, MPC) or “serious risk” (Serious Risk Concentration, SRC).
We propose the following scheme to include equilibrium-based chemical bioavailability tests in site specific ecological risk assessments of PAHs contaminated soils: 1) Determine pore water concentration of freely dissolved PAHs, 2) Relate individual concentrations to risk limits (e.g. RIVM’s MPC or SRC values), using the toxic unit approach, 3) Assume additive effect and calculate the toxic unit value (if > 1, risk). This procedure is in line with the one proposed by Brand et al. (2013). To facilitate the application of this procedure, we have developed the IBRACS calculator, which is available at IBRACS homepage (http://projects.swedgeo.se/ibracs/). The procedure has been applied on two Swedish PAH contaminated sites (Riksten in Botkyrka and Wermlandskajen in Karlstad) and the outcome was compared with an assessment based on the Swedish generic guideline values. The comparison showed that the number of samples indicating “no risk” (MPC) to soil organisms decreased from 80% to 20% at Riksten, and from 100% to 60% at Wermlandskajen, when applying the proposed procedure. Accordingly, the time and money invested in extra POM analyses are likely to be paid off during the remediation phase.
PAH uptake experiments with maize plants were perfomed with the same soils as the ecotoxicity experiments. In addition to pore water determinations using the POM method also a Tenax solid phase exctraction was used. The main transfer route to plants is generally supposed to be through soil solution uptake and risk assessment models rely on pore water PAH concentrations estimated from total soil concentrations using equilibrium partitioning theory. Our results lend no support to this hypothesis, because of lack of correlation between determined pore water concetrations and plant uptake. In contrast, uptake by roots was closely correlated to the total soil concentration. This would suggest a direct uptake route between roots and soil solid phase.
The most frequently applied modeling approach used is the one proposed by Briggs et al. (1982, 1983), both for roots and shoots compartments. The hypothesis supporting this model are mostly overruled in the case of PAH (log Kow higher than 4), but it gave the best estimate of PAH uptake in our study. Thus,
this model can be used for rough estimates of plant uptake of PAHs. However, given the great uncertainty in this modelling approach, measurements of plant root and shoot concentrations would be the superior and most accurate option in site specific rsik assessments.
7 Table of content
1. Background ... 20
2. Aims ... 22
3. General description of the project ... 22
4. Soil property corrections in existing soil quality standards ... 24
4.1 Introduction ... 24
4.2 Flanders (Belgium) ... 26
4.3 The Netherlands ... 28
5. Validation of eight different soil tests to assess phytotoxicity of metals ... 30
5.1 Background ... 30
5.2 Description of experimental work ... 31
5.2.1 Experimental design ... 31
5.2.2 Soils ... 31
5.2.3 Soil characterization ... 32
5.2.4 Soil treatment and experimental design ... 32
5.2.5 Toxicity test ... 33
5.2.6 Soil tests for metal bioavailability ... 33
5.2.7 Statistical analysis ... 37
5.3 Results ... 37
5.4 Discussion and conclusions ... 43
5.4.1 Mixture toxicity ... 43
5.4.2 Comparison of soil tests ... 44
6. Evaluating a passive sampler method to assess bioaccumulation and ecotoxicity of PAHs in soils to worms ... 46
6.1 Background ... 46
6.2 Description of experimental and modelling work ... 48
6.2.1 Chemicals ... 48
6.2.2 Soils ... 49
6.2.3 Soil analysis ... 49
6.2.4 TOC and BC Determination ... 50
6.2.5 Passive Sampler analysis ... 51
6.2.6 Reproduction assays ... 52
6.2.7 Bioaccumulation assay ... 52
6.2.8 Worm analysis ... 52
6.2.9 GC/MS-analysis ... 52
6.2.10 Soil Partitioning calculations ... 53
6.2.11 PAH Toxicity ... 54
8 6.3.1 Soil concentrations ... 58 6.3.2 Porewater concentrations... 59 6.3.3 Partitioning ... 59 6.3.4 Worm Bioaccumulation ... 62 6.3.5 Worm Toxicity ... 69 6.3.6 "Dose"-Response Curves ... 70 6.4 Conclusions ... 73
7. Evaluating soil extraction and passive sampler methods to assess plant uptake of PAHs ... 74
7.1 Background ... 74
7.2 Description of experimental work ... 76
7.2.1 Contaminated soils: origin and main properties ... 76
7.2.2 Soil extraction methods ... 79
7.2.3 Passive sampler method ... 79
7.2.4 Culture experiment ... 79
7.2.5 Plant extraction ... 79
7.2.6 PAHs analysis ... 80
7.3 Results ... 80
7.3.1 Pore-water concentration predictions ... 80
7.3.2 Shoot and root concentrations ... 82
7.3.3 Prediction of PAH uptake ... 83
7.4 Discussion and conclusions ... 86
8. Application of phytoavailability tests for metals in national soil policy frameworks – the Swiss and German examples ... 87
8.1 The Swiss approach ... 87
8.1.1 Methods of establishing the OSol threshold values ... 90
8.2 German approach ... 94
8.2.1 German regulation on soil protection ... 94
8.2.2 Method for setting the threshold values of the Federal Ordinance (BBodSchV) ... 97
9. Recommendations on implementation of chemical bioavailability methods in site specific ecological risk assessment frameworks ... 99
9.1 Introduction ... 99
9.2 Metals ...100
9.2.1 Implementation of soil tests in risk assessment ... 100
9.3 PAHs ...102
9.3.1 Strategy 1 – Accounting for the Partitioning Regime ... 103
9.3.2 Strategy 2 – Porewater based risk assessments ... 104
9.3.3 Startegy 3 – Lipid residue based risk assessments ... 105
9.3.4 IBRACS calculator ... 106
10. Recommendation on implementation of chemical methods assessing plant uptake of PAHs in site specific risk assessments ... 107
9
11. Using heavy metal bioavailability to derive new soil limit values protecting ecosystems in Wallonia
(Belgium) ... 107
11.1 Introduction ...107
11.2 The Walloon soil context: a rapid overview ...108
11.2.1 The Walloon soil law ... 108
11.2.2 Importance of distinguishing local pollution from proximal atmospheric pollution (PAP) ... 109
11.2.3 Legal implications of exceeding the threshold values VS as a function of the legal status of the pollution: local pollution versus proximal atmospheric pollution (PAP) ... 111
11.2.4 Risk assessment procedure: simplified (tier 1) and detailed (tier 2) risk assessment ... 113
11.3 Implementation of bioavailability in the Walloon context ...114
11.4 Choosing a method for correcting the limit values for ecosystems (VSE) taking into account bioavailability115 11.5 Proposed method for introducing bioavailability into the VSE calculation ...116
11.6 Future work ...120
12. Cost-benefit analysis of applying bioavailability in site specific ecological risk assessment – some case studies ... 121
12.1 PAH sites ...121
12.2 Case study 1: Riksten ...122
12.2.1 Background ... 122
12.2.2 Site specific ecological risk assessment... 123
12.2.3 Cost-benefit-analysis ... 125
12.3 Case study 2: Karlstad (Wermlandskajen) ...126
12.3.1 Background ... 126
12.3.2 Site specific ecological risk assessment using POM method... 126
12.3.3 Cost-benefit-analysis ... 128
12.4 Metal contaminated sites ...129
12.5 Case Study 1: Björkhult ...130
12.5.1 Background ... 130
12.5.2 Site specific PNEC ... 131
12.6 Case study 2: La Calamine ...136
12.6.1 Background ... 136
12.6.2 Site specific PNEC ... 137
13. Project management and co-ordination ... 138
14. Dissemination and exploitation ... 139
14.1 Stakeholder interactions ...139
14.2 National and international workshops and conferences ...139
14.3 Reports ...140
14.4 Scientific publications ...140
15. References... 141
10
Appendicies with supplementary information ... 154 A1 Appendix Stable Isotope dilution method
A2 Appendix POM extraction method for soils
A3 Appendix Supporting information to Chapter 6: Evaluating a passive sampler method to assess bioaccumulation and ecotoxicity of PAHs in soils to worms
A4 Appendix Supporting information to Chapter 7: Evaluating a soil extraction and passive sampler methods to assess plant uptake of PAHs
11 List of figures
Figure 1.1 Tiers within the Dutch regulatory framework for soil contamination (VROM 2009). ... 21 Figure 3.1 The IBRACS structure. ... 23 Figure 4.1 A schematic representation of risk objects and exposure pathways in the Swedish risk assessment model (Naturvårdsverket, 2009). In IBRACS we have focused on exposure pathways 1 and 2. ... 24 Figure 5.1 An illustration of different factors affecting the toxicity of metals and the outcome of an “ideal” chemical bioavailability method. ... 31 Figure 5.2 Different steps of the isotope dilution extraction. Step 1 & 2 represents the first equilibration of the soil with Ca(NO3)2 extraction solution. Step 3 is right after addition of the enriched stable
isotope spike solution and step 4 is after the second equilibration with the spiked extraction solution. The isotope abundance of the metals in the extract is expected to be the same as that of the labile metal fraction in the soil. Blue: extraction solution, grey: soil. Adapted from (Garforth 2013). ... 36 Figure 5.3 Above: barley plants grown on mixtures of a field-contaminateds soil (Zn: principal metal) and its corresponding reference soil. Below: The corresponding reference soil spiked with ZnCl2. There is
a reduced toxicity of total Zn (aqua regia) in the field-contaminated case compared to the spiked case. ... 39 Figure 5.4 The difference in metal toxicity to barley growth between field-contaminated soils (solid circles) and their corresponding spiked soils amended with metal chloride of the principal contaminant (filled circles). Dose-response curves fitted with the log-logistic dose-response model. Standard error bars of means are represented. ... 40 Figure 5.5 Comparison of Zn toxicity to barley growth in field-contaminated soils ( solid circles) and in their corresponding reference soils spiked with metal salts (empty circles) with doses expressed as aqua regia and NH4NO3 soluble metal. A and B are data for 14 soils with Zn as principal contaminant, C and D are data for 4 soils with Cu as principal contaminant. Fitted log-logistic dose-response curves are for field soils (solid lines) and for spiked soils (dotted lines). Each symbol is the average of 4 replicates. ... 41 Figure 5.6 Labile metal fraction in the field-contaminated soil (fraction of aqua regia soluble metal that is isotopically exchangeable) plotted versus the relative metal toxicity (expressed as the ratio between the EC50 of the spiked soil and the EC50 field-contaminated soil). The 1:1 line is indicated, (r=0.82 on log-log plot). ... 42 Figure 6.1 Species sensitivity distribution plot of 54 species with NOER values for various individual PAH (from Verbruggen, 2012). ... 55
12
Figure 6.2 a) measured log KTOC values (L/kgTOC) for PAHs, b) measured log KBC values (L/kgBC) for PAHs. Also plotted in a) are estimated log KTOC based on the Raoult's Law Coal Tar sorption model
(Arp et al. 2009), recommended KTOC values used by the USEPA for sediments (USEPA 2003), RIVM
for soils and sediments (Verbruggen 2012), and KOW values. Note the range in obtained log KBC
values in b) is larger than log KTOC values in a), except for acenapthene but this only because there
are fewer log KBC values for this compound as log KBC cannot be derived when log KD < log KOW (see
eq 6.6). ... 60 Figure 6.3 A comparison of average log KTOC values (± standard deviations in error bars) measured in this study for all PACs and in the literature for PAHs (from 24 literature soils) (ter Laak et al. 2006b, Jonker et al. 2007, Brandli et al. 2008) with those predicted using the Raoult's Law Coal Tar sorption model (Arp et al. 2009) described in eq 6.5. ... 61 Figure 6.4 Correlations of log Cworm for EPA-16 with various chemical measurements, including a) log CPOM, b) estimated log Cworm based on CPOM * Kliposome/Kpom, c) log Csoil, d) log CTOC, e) log Cpw (units TU
based on SRC levels in (Verbruggen 2012), g) log Cpw (units TU based on FCV levels in USEPA, 2003).
... 66 Figure 6.5 A comparison of average (± standard deviation) measured log BCFlipid values (Lpw/kglipid) for PAHs, oxy-PAHs and N-PACs for E. crypticus exposed to historically contaminated soils in this study vs. a) measured (or estimated if unavailable) log Kliposome values and b) measured or estimated log KOW values; log-log linear regression equations are presented in the figures. ... 67 Figure 6.6 A comparison of measured Clipid values for individual PAHs with those derived from CPOM and Kliposome using Clipid = CPOM(Kliposome/KPOM)... 68 Figure 6.7 Relative % of juveniles of E crypticus in test soils vs a) measured total lipid concentrations, Clipid, of all PACs analysed in this study, b) total POM estimated lipid concentrations, Clipid-POM, of all
PACs (see eq 6.9), c) CPW normalized to RIVM MPCeco benchmark values for PAH-16 (no benchmark
values exist for N-PACs and oxy-PAHs, see Table 6.4), (Verbruggen 2012) to generate total Toxicity Units (TU), d) Csoil normalized to fTOC and then normalized standard soil RIVM MPCeco benchmarks for
PAH-16 (see Table 6.4), (Verbruggen 2012) to generate total TU. Soils are differentiated by having low and high metal content (where high metal content samples are the samples from Belgium and France, indicated in red), as well as samples that contain low TOC (<6%) and high clay+silt (>24%), which are indicative of good soil texture for worms. The solid orange line is the fit from a logistic regression, and dotted lines represent the 95% confidence intervals. ... 71 Figure 7.1 Pathways for contaminant uptake in vegetables (from Swartjes et al. 2007). ... 74 Figure 7.2 Comparison between POM measured and a) Tenax or b) total soil concentration predicted individual PAH pore water concentrations in mg/L, using the Nguyen equation and c) using the coal-tar model. ... 81 Figure 7.3 Comparison of Nguyen and Karickhoff models for pore water concentration estimates from a) Tenax extracted and b) total soil concentrations. ... 82
13
Figure 7.4 Total PAH concentrations in a) roots and b) shoots. ... 83 Figure 7.5 Total PAH concentration in roots () and in shoots () as a function of total soil concentration.
... 83 Figure 7.6 Comparison between experimental and predicted individual PAH root concentrations obtained with Briggs and Nguyen models and using pore water concentrations obtained from a) and b) POM measurements, c) and d) Tenax extracted fraction, e) and f) total soil concentrations... 85 Figure 7.7 Comparison between experimental and predicted individual PAH shoot concentrations obtained with Briggs model and using pore water concentrations obtained from a) POM measurements, b) Tenax extracted fraction, c) total soil concentrations. ... 86 Figure 9.1 A flow chart for conducting a tiered risk assessment applying the isotope dilution method and the PNEC-calculator in tier 3. ... 101 Figure 9.2. Screenshot of the software to calculate a soil type specific PNEC value. Available from: http://www.arche-consulting.be/metal-csa-toolbox/soil-pnec-calculator/ ... 102 Figure 9.3 Schematic for conducting a risk assessment that accounts for difference in partitioning behavior of pyrogenically impacted sites and reference soils. ... 104 Figure 9.4 Schematic for conducting a risk assessment that is based on bioavailable porewater concentrations. ... 105 Figure 9.5 Schematic for conducting a risk assessment that is based on derived lipid concentrations, and risk guideline values developed from no observable effect residues (NOERs). ... 106 Figure 11.1 Concepts used to designate pollution in Wallonia as a function of the distance to the emitting source. The left-hand side of the diagram represents a location far away from any source of pollution. The right-hand side represents a location close to a single and well identified pollution source (local pollution). Purple: natural pedogeochemical background (originating from the parent material); blue: generalized diffuse pollution that is present even far away from any source of pollution; yellow: proximal atmospheric pollution due to historic or current sources that cannot be identified individually; orange: a spatially limited area affected by one or multiple pollution sources that are well identified individually; dashed line: where there is no local pollution, the Walloon soil legislation considers the measured pollutant concentration in the soil as the “background concentration”. Guide pour la définition des concentrations de fond en polluants dans les sols de
Wallonie. Cahier de Bonnes Pratiques n°10, Pereira, Sonnet and Capette, 2010, 84 p., SPAQuE. ... 109
Figure 11.2 Upper table: current zinc limit values for the ecosystem (VSE). Map: zinc (Zn) background content in Wallonia. Left hand side: proportion of the overall area of Wallonia where the zinc concentration exceeds the current limit value for ecosystems (VSE). ... 111 Figure 11.3 The mechanism in the Walloon soil law that designates who is responsible for taking action when the total content exceeds VS. ... 111
14
Figure 11.4 Steps in the Walloon soil law where a risk assessment studies could be performed (red ellipse or the left-hand side of the figure). ... 112 Figure 11.5 The Walloon risk assessment studies within the detailed site study. The first-tier risk assessment study (upper red rectangle) is a simplified procedure which has two possible outcomes: an hypothesis of serious threat (or biological stress for ecosystems) or an absence of serious threat. The second-tier risk assessment study (lower red rectangle) is a detailed study and has two possible outcomes: confirmation of the presence or of the absence of a serious threat. ... 114 Figure 11.6 Comparison between the LA factors used in the PNEC calculator and the L/A field-spiking factors measured during the experiments performed in IBRACS on metal polluted soils. ... 116 Figure 11.7 The first two steps of the method for introducing bioavailability into the Walloon legislation. Left-hand side: sequence of steps to apply the proposed method to any one pollutant (Cu, in our case study). The data necessary for the first two steps are examined here. For step 1, Risk Assessment Reports by metal producers have been used to provide ecotoxicity data for a range of organisms present in the ecosystem. For step 2, the definition of the leaching/ageing factors is given. The table presents the leaching/ageing factors used in the PNEC Calculator. For nickel (Ni) and cobalt (Co), the factors can be adjusted for site specific soil parameters. ... 117 Figure 11.8 The third step of the method for introducing bioavailability into the Walloon legislation. NOEC (No Observed Effect Concentration) for each organism is adjusted to the properties of each one of the three standard Walloon soils using the given equation. The slope, obtained by regression, is found in the EU RAR files. The upper table presents the soil parameters of the three Walloon reference soils. Type I corresponds to a “natural” land use ; Types II, III and IV correspond to agricultural, residential, commercial/recreational land uses and type V to industrial land use. The lower table provides the “slope” for the effect of CEC on the bioavailability of Cu for monocotyledon plants (one of the organisms used in our case study). ... 118 Figure 11.9 The fourth step of the method for introducing bioavailability into the Walloon legislation. Graph X-axis: logarithm of the total concentration of copper (Cu) corrected for leaching/aging and for the properties of the Walloon standard soil; Y-axis: cumulative proportion of organisms that are affected, expressed as a fraction of 1. Each point represents one particular species of the ecosystem for which a NOEC value has been obtained by following the first three steps. Circled numbers along the Y-axis are the proportions of the organisms present in the ecosystem that must be protected. The table compares the VSE values currently used in the simplified risk assessment procedure to the new values corrected to account for bioavailability. ... 120 Figure 12.1 The procedure used to derive site specific "Serious risk concentration" (RIVM SRC) and "Maximum permissible concentration serious risk concentrations (RVIM MPC (SRC). The procedure is identical to the one described in Figure 9.5 using the POM approach. ... 122 Figure 12.2 The scheme of sampling points at Riksten, Sweden. ... 124 Figure 12.3 The scheme of sampling points at Wermlandskajen. ... 127
15
Figure 12.4 Location of Televerk site in Björkhult, Kinda Municipality, Sweden. ... 130 Figure 12.5 Distribution of samples based on the measured Cu concentration at Björkhult site and calculated site specific guideline value for soil with less sensitive use (211 mg/kg DW). ... 135 Figure 12.6 Location of the La Calamine mine (Van Damme et al., 2010). ... 136
16 List of tables
Table 3.1 Partners and members of the IBRACS team. Project contacs are indicated in bold. ... 23 Table 4.1 Protection targets considered in calculating SQS in different countries (Carlon, 2007). ... 25 Table 4.2 Summary of generic soil quality standards (mg/kg dw) and protection target determining the soil quality standard. The values given are for standard soil conditions; 10% organic matter, 25% clay (the Netherlands, Flanders, Wallonia) or 2% organic matter, pH 5-7 (Sweden)... 25 Table 4.3 Equations used for soil property corrections of SQS in Flanders, where x = clay content (%), y = organic matter content (%), z = pH-KCl. Index I, II and III are according to the type of use for the excavated soil, "bestemmingstype" (OVAM, 2008). ... 27 Table 4.4 Metal-dependent soil properity correction factors in the Dutch model (VROM, 2009). ... 29 Table 5.1 Selected properties of contaminated soils and corresponding reference soils after correction of pH and OC. ... 34 Table 5.2 The extracted metal fraction using different soil tests. Data are fractions (%) of extracted metal relative to the aqua regia soluble metal and are averaged over all soils. Soil extractions/tests are sorted from most aggressive (left) to weakest extractions (right)... 42 Table 5.3 The predictive power of soil tests for metal toxicity indicated by its potential to minimize variation in toxicity thresholds. The toxicity thresholds (50% effect, i.e. EC50) are for 14 soils with Zn as principal toxic metal and 4 soils with Cu as principal toxic metal. The variation in EC50 is expressed in different ways and lowest values among soil tests are indicated in bold. (F: field-contaminated soil series; S: spiked soil series). ... 43 Table 6.1 Soil sample identification, location, texture properties, pH, CaCO3 content and CEC. ... 49 Table 6.2 Carbon measurements in the soil, including total organic carbon (TOC), black carbon (BC) stable under oxidation at 375°C, amorphous organic carbon (AOC) (i.e. TOC which is not BC), and the ratio of BC to TOC. ... 50 Table 6.3 Definitions of MPC and SRC (Verbruggen, 2012)... 55 Table 6.4 Screening values for PAHs for water and soils, and the KTOC values used as part of their derivation for soils, including the final chronic values (FCV) derived by the US Environment Protection Agency (USEPA) for sediments, Maximum Permissible Concentration (MPC) and Serious Risk Concentrations (SRC) derived by the Dutch National institute for Public Health and the Environment (RIVM). (SRC values for “ All PAHs” in Table 99 of that report, using the All PAH "No Obersvable Effect Residue" (NOER) method (for 54 species)). ... 57
17
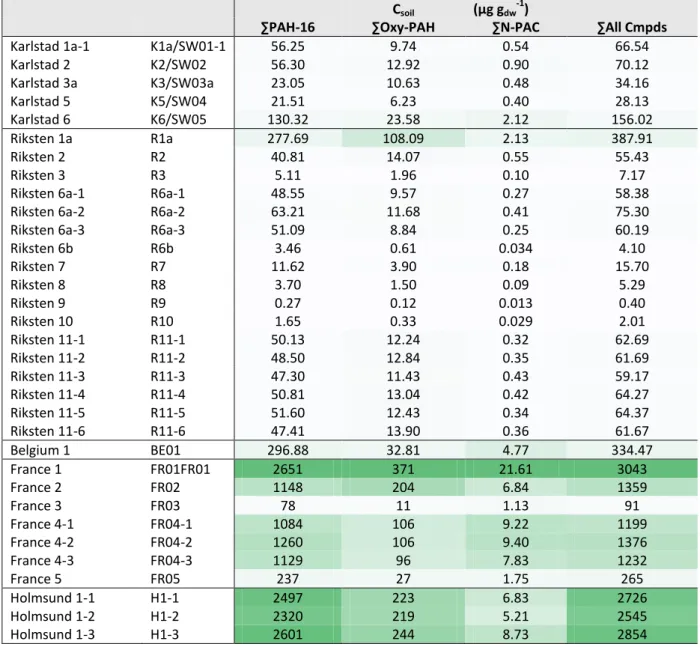
Table 6.5 Sum PAH-16, oxy-PAH and N-PAC soil concentrations (Csoil), and logCsoil, with increasing concentrations indicated by green shading. ... 58 Table 6.6 Sum PAH-16, oxy-PAH and N-PAC POM concentrations in porewater, with increasing concentrations indicated with green shading. ... 59 Table 6.7 Sum PAH-16, oxy-PAH and N-PAC lipid normalized worm (Enchytraeus crypticus)concentrations (flipid = 3.84 ± 0.77 %) expressed as internal residues (mmol kg-1lipid), with increasing concentrations indicated by green shading. ... 63 Table 6.8 Slope and intercept values of various log-log correlation coefficients (r2) of selected lipid concentrations in Enchytraeus crypticus vs. various chemical measurements (where n > 9). ... 64 Table 6.9 log-log correlation coefficients (r2) of lipid concentrations in Enchytraeus crypticus vs. various chemical measurements (where n > 9). ... 65 Table 6.10 Derived coefficients (inflection point and slope) of a logistic regression between relative % of juveniles of Enchytraeus crypticus vs. various chemical measurements. Also presented are the range of different concentrations measured and those of literature effect concentrations (see Arp et al., 2014), and correlation coffecients for relative % juveniles vs log (Concentration). ... 72 Table 7.1: Approaches for calculating the concentration in crops used by the different models (from Rikken et al. 2001). ... 76 Table 7.2: Main properties of the industrial soils. ... 78 Table 8.1 Guide values for soil pollutants in soils, mg kg-1 soil, air-dried, for the two regulatory extraction methods according to the two successive ordinances (OSol 1986, OSol 1998). ... 89 Table 8.2 Trigger values for soil pollutant contents, mg kg-1 dry soil, according to the ordinance OSol (1998). ... 89 Table 8.3 Clean-up values for soil pollutant contents, mg kg-1 dry soil, according to the ordinance OSol (1998). ... 90 Table 8.4 Precautionary values, in mg kg-1, for soil contents obtained after extraction with aqua regia (DIN ISO 11466). ... 95 Table 8.5 Trigger values for the pathway Sol → Man by direct contact, in mg kg-1, for soil contents obtained after extraction with aqua regia (DIN ISO 11466). ... 96 Table 8.6 Trigger and action values, in mg kg-1 for the Soil → Food crop exposure pathway. ... 96 Table 8.7 Action values concerning grassland, in mg kg-1 for soil concentrations obtained after extraction with aqua regia. ... 97
18
Table 8.8 Trigger values for the pathway Soil → Plant and the phytotoxicity risks in mg kg-1, for soil contents obtained after extraction with NH4NO3 in 1 mol L-1. ... 97
Table 12.1 Log Cpw TU for soil from Riksten site calculated using US EPA sediment benchmarks (US EPA), RIVM "Serious risk concentration" (RIVM SRC) and RIVM "Maximum permissible concentration" (RVIM MPC) as references. The values marked orange exceed the Swedish generic guideline values for the protection of soil environment for soil with sensitive use and those in red exceed the values for soil with less sensitive use. ... 124 Table 12.2 Cost estimates of soil remediation through excavation and landfilling (in Swedish crowns (SEK), 1 EURO = 8-9 SEK)... 125 Table 12.3 Log Cpw TU for soil from Wermlandskajen site calculated using US EPA sediment benchmarks
(US EPA), RIVM "Serious risk concentration" (RIVM SRC) and RIVM "Maximum permissible concentration" (RVIM MPC) as references. The values marked orange exceed the Swedish generic guideline values for the protection of soil environment for soil with sensitive use and those in red exceed the values for soil with less sensitive use. ... 127 Table 12.4 Cost estimates of soil remediation through excavation and landfilling (in Swedish crowns (SEK), 1 EURO = 8-9 SEK)... 128 Table 12.5 Default leaching-ageing factors in REACH dossier used in PNEC and RCR calculations. ... 129 Table 12.6 Site specific PNEC and PAF values calculated with the default L/A factor of 2.0 for five sampling points of Björkhult Cu-contaminated site. ... 132 Table 12.7 Site specific PNEC and PAF values calculated with the site specific L/A factor of 6.0 for five sampling points of Björkhult Cu-contaminated site. The L/A factor was calculated from EC50 field/EC50 spiked soil measured using barley plants. ... 133 Table 12.8 Site specific PNEC and PAF values calculated with the site specific L/A factor of 2.3 for five sampling points of Björkhult Cu-contaminated site. The L/A factor was measured with a soil test, i.e. using isotopic dilution method. ... 133 Table 12.9 Calculated total soil Cu concentrations at which 50% (land with less sensitive use) and 75% (land with sensitive used) species are protected assuming the same site conditions as in Table 12.6 and L/S factor of 2.3. ... 134 Table 12.10 Copper concentration in soil samples collected in pits and boreholes at Björkhult (WSP, 2011). Samples with Cu concentration <211 mg/kg, corresponding the calculated site specific guideline value for land with less sensitive use, are marked in green. ... 135 Table 12.11 Site specific PNEC and PAF values calculated with the default and site specific L/A factors for two samples of Zn-contaminated site at La Calamine. ... 137
19
Table 12.12 Zinc concentrations at which 50% and 75% soil organisms are protected assuming the same site conditions as in Table 12.11 and the L/S factor of 34.8. ... 138 Table A3.1 The molecular properties of polycyclic aromatic hydrocarbons (PAHs), oxygenated-PAHs
(oxy-PAHs) and nitrogen containing polycyclic aromatic compounds (N-PACs) considered in this study, including logarithms of POM-water (KPOM), octanol-water partitioning coefficients (KOW),
liposome-water partitioning coefficients (Kliposome) and subcooled liquid solubility (S*L). ... 3-2
Table A3.2 Soil concentrations (µg/gdw) of individual PAH-16.a ... 3-3
Table A3.3 Soil concentrations (µg/gdw) of oxy-PAHs and N-PACs. ... 3-4 Table A3.4 Freely-dissolved porewater concentrations (Cpw, µg/mL) of individual PAH-16. a) ... 3-5 Table A3.5 Freely-dissolved porewater concentrations (Cpw, µg/mL) of oxy-PAHs and N-PACs. ... 3-6 Table A3.6 Results of the survival and reproducibility study of Enchytraeus crypticus exposed to the historically contaminated soils considered in this study. For reference, the soils with high metal content are indicated, as well as those with low TOC (<6%) and high clay/silt content (>24%). ... 3-7 Table A3.7 Literature no observable effect concentrations (NOEC), 10th and 50th percentile effect concentration (EC10, EC50) on reproduction (number of juveniles) as well as Lethal Concentration (LC) for Enchytraeus crypticus exposed to soils spiked with individual PAHs. The concentrations are also expressed as toxicity units (TU) based on the RIVM system of Maximum Permissible Concentration (MPC) and Serious Risk Concentration benchmarks.(Verbruggen 2012) Note that the literature values were used as part of the database to establish the RIVM values. ... 3-8 Table A4.1 Total PAH concentrations in mg kg-1 ... 4-2 Table A4.2 Tenax extractable PAH in mg kg-1 ... 4-3 Table A4.3 Pore water concentrations measured with the POM method in µg L-1 ... 4-4
20
1. Background
In all countries in Europe, and probably the rest of the world, soil quality criteria (SQC) are based on total concentrations of contaminants (Carlon, 2007). Indeed, the total concentration is an indicator of toxicity, but vast amounts of laboratory and field studies have shown that biological effects are not directly related to the total concentration. Instead, soil organisms respond to the fraction of contaminant that is biologically available. To find a chemical method that measures “the bioavailable fraction” might sound easy. However, in reality there are many complicating factors that are related both to the chemical behaviour of contaminats in the soil, and to the mechanisms of interaction of contaminants with the soil organisms.
In order to get a common conceptual view of biological availability, or bioavalability as it is more commonly referred to, an international standard has been developed by ISO (ISO 17402). Bioavailablity is being defined as “the degree to which chemicals present in the soil may be taken up or metabolised by human or ecological receptors or are available to interact with biological systems”. Accordingly, the bioavailablity has to be defined in relation to the organism or soil function that has to be protected. Ideally, of course, the methods or concepts proposed should be as general as possible, i.e. being applicable to a as many types of organisms as possible. One way to deal with bioavalability is to use biological tests directly, with the aim to cover relevant organisms and/or soil functions (e.g. ISO 16198 RHIZOTEST) . In biological tests, organisms are being exposed to soil materials and possible effects are being monitored. If uptake of contaminant and/or effect (e.g. mortality, growth inhibition) are being detected, it is likely that a bioavailable contaminant is present. Although being of high relevance, biological tests are generally costly, time consuming, and complicated to perform and evaluate, which limits their use in practical risk assessments. In this respect, chemical methods offer an alternative, having the potential to be faster, cheaper and easier to commercialise. However, before any chemical bioavailability method can be used in a risk assessment framework, a corresponding reference system based on ecotoxicity test data must have been developed. In other words, we need a framework that relates the measured bioavailable concentration to predefined ecosystem protection goals, e.g. protection of a certain fraction of species. To our knowledge, no such “official” framework including a bioavailablity methodology yet exist in any country.
The main driver of introducing bioavailability in risk assessment is to increase the accuracy in the risk assessment, which are expected to save money and result in more sustainable remediation actions. For example, even at strongly contaminated sites, there are normally areas that are moderately contaminated. These areas might be large, resulting in high costs if remediated. An improved risk assessment methodology, accounting for bioavailability in a proper way, could make a large difference, both in terms of treated soil masses, money and environmental impact. Furtermore, adopting the bioavailability concept in riskassessments opens up site specific management options based on immobilization of contaminants (reducing bioavailablity). As stated in the final report from the 6th International workshop on Chemical Bioavailability in the Terrestrial Environment held on 7-9 September 2011 in Adelaide, Australia “bioavailablity is a tool for smarter risk based land management” (Harmsen and Naidu, 2013).
21
In most countries a tiered risk assessment approach for contaminated land is being used, going from a simplistic, general level (tier 1) to more detailed levels (tier 2 and 3). A schematic presentation of the Dutch regulatory framework is shown in Figure 1.1. In tier 1 and 2, measured total concentrations are compared with postulated SQC. In a few countries, the SQC can be corrected for soil properties using simple mathematical functions based on e.g. organic matter and clay content. This is the case in the Netherlands and Belgium (Flanders), as will be discussed further in chapter 4. The most realistic level to introduce chemical bioavalability methods in a risk assessment framework is in tier 3. In IBRACS we have tested eight different soil tests to assess phytotoxiciy of metals, which is presented in chapter 5, and a passive sampler procedure to assess the bioavalability of polycyclic aromatic hydrocarbons (PAH), reported in chapter 6. Furthermore, recommendations on how to integrate the selected methods in site specific risk assessment frameworks are being discussed in chapter 9. In addition to toxic effects of PAH we have been investigated the possibility to use the passive sampler procedure for assessing uptake of PAH by plants (chapter 7).
Figure 1.1 Tiers within the Dutch regulatory framework for soil contamination (VROM 2009). Tier 1
Tier 2
22
2. Aims
The overall aim of IBRACS is to provide policymakers, other authorities and service providers with guidelines on how chemical bioavailability tests and results of bioavailability-based risk assessment models can be used for risk-based management decisions on contaminated land.
Experimental calibration/validation exercises have been made on soil-plant transfer and ecotoxicity of contaminants. The focus has been on selected contaminants for which either soil-plant transfer (PAH) or ecotoxicity (Cu, Zn, Ni, PAH) normally are decisive for their over-all risk assessment (e.g. Naturvårdsverket, 2009). The soil-plant transfer is the first critical step in the soil-plant-human exposure pathway.
The specific objectives were:
1) To review existing risk assessment models for soils in Belgium (Flanders, Wallonia), Sweden, and the Netherlands with focus on bioavailablity.
2) To evaluate the ability of so-called passive samplers and established soil extracts to predict toxic responses of plants to exposures of metals (Cu, Ni, Zn) and organic contaminants (PAH).
3) To evaluate plant uptake models and soil tests for PAH and how to incorporate them into risk assessment models.
4) To make a cost-benefit analysis of including chemical bioavailability tests in site specific risk assessment.
5) To give recommendations on how to integrate chemical bioavailability tests in risk assessment frameworks (Cu, Zn, Ni and PAH).
3. General description of the project
The program structure and individual work packages (WPs) are shown in Figure 3.1 and partner organisations and members in Table 3.1. The general idea with the project structure was to start with experimental work in WP4 and WP5, aiming at validating some promising chemical test methods. In WP4 we tested methods to assess phytotoxicity of metals and toxicity of PAH to Enchytraeus crypticus, whereas in WP5 plant uptake of PAH was in focus. The toxicity tests developed in WP4 was later applied on “real cases” in WP6 and the outcome was compared with the outcome based on national default risk limits. Parallel to this work a review of existing risk assessment models in Sweden, Belgium (Flanders, Wallonia), France and the Netherlands was made in WP3. Here, the focus was on the potential roll of bioavailability in ecological risk assessment and the soil plant transfer of pollutants.
23 Figure 3.1 The IBRACS structure.
Table 3.1 Partners and members of the IBRACS team. Project contacs are indicated in bold.
Partners Members Leading
Swedish Geotechnical Institute / SGI
On sub-contract: Swedish
Environmental Research Institute /IVL
Dan Berggren Kleja Anja Enell Michael Pettersson Ann-Sofie Allard WP1, WP2 and WP3 Stockholm University / SU On sub-contract: Norweigian Geotechnical Institute /NGI
Gerard Cornelissen Hans-Peter Arp
WP4 (PAH)
Luleå University of Technology/LTU Jurate Kumpiene WP6
Katholieke Universiteit Leuven /KUL Erik Smolders Fanny hemmels
WP4 (metals)
Université Catholique de Louvain /UCL
Philippe Sonnet
Henri Halen (associated) Joop Vegter (associated) Université de Lorraine/ UL
Institut National de la Recherche Agronomique/INRA Thibault Sterckeman Stéphanie Ouvrard Joan Dupuy Pierre Leglize WP5
A report on project management and co-ordination (WP1) is given in chapter 13 and dissemination and exploitation (WP2) in chapter 14.
WP1. Project management
WP3. Comparison of existing risk assessment models for soil with focus on bioavailability
WP4. Ecotoxicity and bioavailability testing
WP5. Uptake of pollutants by plant and bioavailability
WP2. Dissemination and Exploitation WP6. Application of unified risk assessment framework on major contaminated sites WP4. Incorporating soil chemical tests in a unified risk assessment framework
24
4. Soil property corrections in existing soil quality standards
4.1 Introduction
In this chapter we focus on soil quality standards (SQS) or soil guideline values (SGV), which can be used as reference values in tier 1 and 2 risk assessments. A fairly recent review on soil screening values in European countries, and how they have been derived, was published by EU’s Joint Research Centre (Carlon, 2007). For a more detailed overview on SQS, we refer to that work. In IBRACS we have focus on the official guide line documents provided by authorities in Belgium (Flanders, Wallonia), France, Sweden and the Netherlands. In deriving SQS, relevant protection targets need to be identified, as illustrated by the Swedish model in Figure 4.1. The SQS obtained are intended to protect 1) people living on or visiting the site, 2) soil environment (ecosystem), and 3) ground and surface water (off-site effects). The final guide line value for a certain contaminant is the lowest of the values derived to protect any of these three protection targets. The protection target and exposure pathways differ for different contaminants. For example, for metals like Cd and Co, and high molecular weight PAHs human exposure via consumption of vegetables grown on the site is decisive for the guideline value (sensitive landuse scenario). As a consequence, soil factors modifying the availability of these contaminants for plants are affecting their over-all risk assessment. For other contaminants like Cu, Zn, Ni and low molecular weight PAHs, protection of the soil ecosystem is decisive for the guideline value. However, the protection targets accounted for in the risk assessment models varies between countries (Table 4.1). In all models protection of human health is being considered, whereas protection of the terrestrial ecosystem is considered in all but in the French model. Actually, in the French model only human health is being considered explicitly.
Figure 4.1 A schematic representation of risk objects and exposure pathways in the Swedish risk assessment model (Naturvårdsverket, 2009). In IBRACS we have focused on exposure pathways 1 and 2.
Human Plant Eco-system Soil pollutant soil intake vapour, dust, etc
1
2
Off-site effects
Ground water, etc plant uptake exposure
25
Table 4.1 Protection targets considered in calculating SQS in different countries (Carlon, 2007). Human health Terrestrial ecosystem Ground- water Surface water Belgium (Flanders) X X X France X The Netherlands X X X X Sweden X X X X Belgium (Waloonia) X X X
In Table 4.2, we have summarized SQS for the contaminants considered in IBRACS. As can be seen, these values are different for different landuse according to a soil multi-functionality principle. The values given are valid for a “standard soil”, which are being assigned slightly different properties in different countries. In two countries/regions, the Netherlands and Belgium (Flanders), there is an obligation to make soil property corrections when applying the generic SQS for metals and PAHs, which is being discussed below. In Sweden and Belgium (Wallonia) on the other hand, such an option is not possible. Table 4.2 Summary of generic soil quality standards (mg/kg dw) and protection target determining the soil quality standard. The values given are for standard soil conditions; 10% organic matter, 25% clay (the Netherlands, Belgium (Flanders, Wallonia)) or 2% organic matter, pH 5-7 (Sweden).
Sweden The Netherlands Belgium (Flanders) Belgium (Wallonia)
SQC 1) Protection target 2) SQC 3) Protection target 2) SQC 4) Protection target 2) SQC 6) Protection target 2)
Cu 80/200 E/E 190 E 197/500 E/H 110/120 E/E
Ni 40/120 GW/E 100 E 95/530 E/H 150/210 E/E
Zn 250/500 E/E 720 E6) 333/1
250
E/H 230/320 E/E
PAH-L 3/15 E/E - - 1/40 5) H/H 0.8/43 H/GW
PAH-M 3/20 H/H - - 30/270 5) H/H 23/47 GW/E
PAH-H 1/10 H/E - - 2.9/3.6 5) H/H 0.6/1.4 H/E
PAH-10 - - 40 E - - - -
1) Naturvårdsverket (2009a). Lower value – sensitive land use, higher value – less sensitive land use 2) E = soil ecosystem, GW = groundwater, H = human health
3) Swartjes et al. (2012).
4) VLAREBO (2008). Bodemsaneringsnormen. Lower value – Type III (e.g. residential), higher value – Type V (e.g. industrial) 5) PAH-L is represented by acenaphtylene, PAH-M by fluoranthene, PAH-H by dibenz(a,h)anthracene.
6) Annex I of the Walloon Soil Decree (5/12/08) & GRER (2012) : Trigger Values (“Valeurs Seuil”) ; lower value – Type III (residential), higher value – Type V (industrial). Note: natural and agricultural landuses have Trigger Values that are more restrictive than residential use.
26
4.2 Flanders (Belgium)
The Flemish soil decree from October 27, 2006 has been revised in October 2013. New normative values have been issued in the so-called Vlarebo, "Vlaams reglement rond bodemsanering en bodembescherming" (Flemish rules about soil remediation and soil protection) which implements the decree
(http://www.ovam.be/sites/default/files/20131010_Vlarebo2008_Geconsolideerde_versie10oktober201 3.pdf). The revised values take into account the concept of bioavailability. They are based on ecotoxicological data and are computed as a function of the local soil properties using formulae which take into account the bioavailability of the contaminants.
There are three types of normative values in the Flemish soil decree, increasing in values (limits) based on increased risk: “soil screening values” (streefwaarden), “soil target values” (richtwaarden) and “clean-up values” (bodem-saneringsnormen). The practical and legal consequences of exceeding the limits are beyond the scope of this study but are in principle that new contaminations should be remediated when the third limit is exceeded, that the clean-up goals are to be below the second limit and that values below the soil target values mean that there is no concern.
The “soil screening values” for metals are based on the upper percentile of natural background values derived from a geochemical survey in non-contaminated areas. They are assigned a constant value for all soils (e.g. Cd) or they are function of soil properties as derived from the survey (Table 4.3).
The “soil target values” indicate where the soil can perform all its functions without any limitation. It represents the concentration that has to be achieved in case of any soil remediation action. These values correspond to 60% of the clean up values for residential areas (type II). The “soil target values” can be adjusted to the local soil parameters (percentage of clay, organic matter content or pH-KCl value), according to Table 4.3. For ecotoxicity of metals, the target organisms used in the Flemish decree to derive the soil property corrections was only plants. From the REACH data, it was observed that for any given metal one particular soil property predominantly influenced plant toxicity. For example, Cu toxicity to plants were mainly influenced by the CEC (cation exchange capacity). Since the CEC is not among the parameters required to be analysed by the Flemish Decree, it was obtained by a formula involving pH, clay and organic matter. The equations presented in Table 4.3 were obtained from regression analyses performed on ecotoxicity data with different soil property parameters as independent variable (e.g. CEC). For arsenic, which is a metalloid, the ecotoxicity was found to be correlated with its solubility. For Cd, the main protection targed is human health, and soil parameters that were correlated with plant uptake was therefore evaluated. A comprehensive statistical analysis on a wide range of different vegetables that are grown in contaminated and non-contamined soils in Flanders and The Netherlands showed a significant correlation with soil pH. As a result, the “soil target value” for Cd is solely a function of pH (Table 4.3).
The remediation value, “clean-up value”, is the threshold value at which a significant risk of adverse effect occurs. Beyond this value, an additional investigation (tier 3) or remediation action must be
27
carried out. Unlike the “soil target values” they depend on the type of planned land use (natural, agricultural, residential, recreational or industrial). Values for ecosystem protection were calculated, as well as values for human health protection. The lowest value of the two is selected as the clean-up value. The “clean-up values” were also obtained using SSD curves based on ecotoxicological data. In this case, the degree of ecosystem protection was chosen to be HC25 or HC50. For example, for Cu HC25 was chosen
for natural and agricultural land use, whereas HC50 was chosen for residential land use. For Zinc, HC50
was chosen for all types of land use. Soil property corrections ware determined in the same way as for the “soil target values”.
Table 4.3 Equations used for soil property corrections of SQS in Flanders, where x = clay content (%), y = organic matter content (%), z = pH-KCl. Index I, II and III are according to the type of use for the excavated soil, "bestemmingstype" (OVAM, 2008).
Metal Correction equation
Streefwaarden (soil screening values)
As ( ) Cr ( ) ( ) Cu ( ) ( ) Pb ( ) ( ) Ni ( ) Zn ( ) ( )
Richtwaarden (soil target values)
As ( )
Cd ( )
Cu ( ) ( ) Zn ( ) ( )
Bodemsaneringsnormen (soil clean-up values)
As (Type I and II) ( ) Cd (Type I and II) ( )
Cu (Type I and II) ( ) ( )
Cu (Type III) ( ) ( ) Zn(Type I - III) ( ) ( )
For PAHs, the Flemish SQS is adjusted based on the soil content of organic matter according to:
This relation was first introduced the Netherlands in 1987 (Milieuprogramma 1988-1991, Tweede Kamer, vergaderjaar 1987-1988, 20202, nrs 1-2) to allow the derivation of soil values from aquatic (and drinking water) quality criteria by equilibrium partitioning. This reflects in a way also the bioavailability of the
28
organic substances in question. The minimum and maximum value of organic matter in the equation above is 1 % and 10 %, respectively. For soils outside this range fixed values of 1% and 10% is used respectively. It can be noted that the same equation is used in the Netherlands for correcting intervention values for organic contaminants except PAH, but the minimum and maximum values of organic matter in the equation is 2% and 30 %.
4.3 The Netherlands
Central to the Dutch soil protection policy is the principle of soil multi-functionality, and this applies to soil remediation as well. The risk assessment procedure consists of three stages, or tiers, as indicated in Figure 1.1. The first tier is based on historical investigations and soil investigations and assessment using generic trigger values for soil and ground water. Site-specific considerations are addressed in the second and third tiers. The model tool used in the Netherlands for calculating generic trigger values is called CSOIL (VROM, 2009).
There are two types of generic soil quality criteria (or trigger values); background value/target value and intervention value1 (Swartjes et al, 2012). Based on these values, the soil is classified as clean, slightly contaminated or seriously contaminated. Soil background values are estimated from sampling in top soil of undisturbed soil in agricultural areas and nature reserves over the Netherlands, and are thus not risk-based values. Intervention values are generally chosen as the lowest of human health and ecological risk limits, but there are exceptions. For example, for some substances policy decisions are taken that higher values should be used for socio-economic reasons.
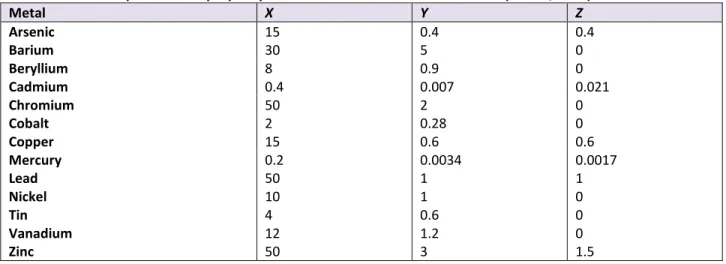
The Dutch SQC for metals depend on the soil content of clay and organic matter. The standard soil is defined having a clay content of 25 % and organic matter of 10 %. Converting the SQC for soils with deviating content of clay and/or organic matter, the following equation is used (VROM, 2009; Swartjes et
al, 2012):
( ) ( ) ( ) ( )
where X, Y and Z are empirical metal-dependent constants (Table 4.4). If the clay content (Clay) is less than 2 % a value of 2 % is used, and the organic content is set to 2% even if the amount of organic matter (OM) is below that value.
It should be noted that the relations between SQS for metals and soil properties were not intended to be a “bioavailability model”, as in the Flanders model. These relations were first published in a much simpler, but mathematical equivalent form in an official report of the Ministry of Environment to
1 The Dutch framework also consists of target values and intervention values for groundwater. This is discussed in