Montréal Septembre 2006
© 2006 Charles Bellemare, Sabine Kröger, Arthur van Soest. Tous droits réservés. All rights reserved.
Reproduction partielle permise avec citation du document source, incluant la notice ©.
Short sections may be quoted without explicit permission, if full credit, including © notice, is given to the source.
Série Scientifique
Scientific Series
2006s-16
Actions and Beliefs: Estimating
Distribution-Based Preferences Using
a Large Scale Experiment with
Probability Questions on Expectations
Charles Bellemare, Sabine Kröger,
Arthur van Soest
CIRANO
Le CIRANO est un organisme sans but lucratif constitué en vertu de la Loi des compagnies du Québec. Le financement de son infrastructure et de ses activités de recherche provient des cotisations de ses organisations-membres, d’une subvention d’infrastructure du Ministère du Développement économique et régional et de la Recherche, de même que des subventions et mandats obtenus par ses équipes de recherche.
CIRANO is a private non-profit organization incorporated under the Québec Companies Act. Its infrastructure and research activities are funded through fees paid by member organizations, an infrastructure grant from the Ministère du Développement économique et régional et de la Recherche, and grants and research mandates obtained by its research teams.
Les partenaires / The Partners Partenaire majeur
Ministère du Développement économique, de l’Innovation et de l’Exportation
Entreprises partenaires
Alcan inc.
Banque du Canada
Banque Laurentienne du Canada Banque Nationale du Canada Banque Royale du Canada
Bell Canada
BMO Groupe financier Bombardier
Bourse de Montréal
Caisse de dépôt et placement du Québec
Fédération des caisses Desjardins du Québec
Gaz Métro
Hydro-Québec Pratt & Whitney Canada Raymond Chabot Grant Thornton
Autres partenaires gouvernementaux
Industrie Canada
Ministère des Finances du Québec Ville de Montréal
Partenaires universitaires
École Polytechnique de Montréal
HEC Montréal McGill University Université Concordia Université de Montréal Université de Sherbrooke Université du Québec
Université du Québec à Montréal
Université Laval
Le CIRANO collabore avec de nombreux centres et chaires de recherche universitaires dont on peut consulter la liste sur son site web.
Les cahiers de la série scientifique (CS) visent à rendre accessibles des résultats de recherche effectuée au CIRANO afin de susciter échanges et commentaires. Ces cahiers sont écrits dans le style des publications scientifiques. Les idées et les opinions émises sont sous l’unique responsabilité des auteurs et ne représentent pas nécessairement les positions du CIRANO ou de ses partenaires.
Actions and Beliefs:
Estimating Distribution-Based Preferences Using
a Large Scale Experiment with Probability
Questions on Expectations
*
Charles Bellemare
†, Sabine Kröger
‡, Arthur van Soest
§Résumé / Abstract
Afin de déceler un modèle structurel de prise de décision dans l'incertitude, nous combinons les données recueillies par i) les choix des deux types de joueurs dans le jeu de l'ultimatum (ceux qui proposent et ceux qui répondent), ii) leurs attentes obtenues sous la forme de questions à probabilité subjective, et iii) les choix des dictateurs (premiers joueurs) dans le jeu du dictateur. Nous utilisons un large échantillon représentatif des sujets dans la population néerlandaise. Nos résultats indiquent une hétérogénéité considérable dans la population sur les préférences en matière d'équité. La diversité de ces préférences a un impact important sur les décisions des dictateurs dans le jeu du dictateur, et sur les répondeurs dans le jeu de l'ultimatum, mais un impact plutôt moindre sur les décisions des joueurs qui proposent dans le jeu de l'ultimatum. Cette dernière observation est due aux attentes subjectives de ces joueurs face aux décisions des répondeurs. Le modèle qui utilise des données subjectives sur les attentes des joueurs prévoit mieux les choix des sujets et réduit plus le bruit qu'un modèle qui suppose que les joueurs ont des attentes rationnelles.
Mots clés : attentes subjectives, aversion à l'injustice, jeu de l'ultimatum
We combine the choice data of proposers and responders in the ultimatum game, their expectations elicited in the form of subjective probability questions, and the choice data of proposers (“dictators”) in a dictator game to estimate a structural model of decision making under uncertainty. We use a large and representative sample of subjects drawn from the Dutch population. Our results indicate that there is considerable heterogeneity in preferences for equity in the population. Changes in preferences have an important impact on decisions of dictators in the dictator game and responders in the ultimatum game, but a smaller impact on decisions of proposers in the ultimatum game, a result due to proposer’s subjective expectations about responders’ decisions. The model which uses subjective data on expectations has better predictive power and lower noise level than a model which assumes that players have rational expectations.
Keywords: inequity aversion, subjective expectations, ultimatum game Codes JEL : C93, D63, D84
*
We thank Vera Toepoel, Marcel Das and his team at CentERdata for support throughout the experiment. The first author thanks the Canada Chair of Research in the Economics of Social Policies and Human Resources for support.
†
1 Introduction
Individual decision making under uncertainty plays an important role in economic theory and practice. Economic models of choice under uncertainty typically assume that agents have a probability distribution over the uncertain outcomes and combine this with their preferences in order to choose the optimal alternative. Experiments of proposal and response such as the ultimatum game have been used to understand the preference structures of the decision making agents. In such games, the proposers’ payoffs not only depend on their own actions, but also on the uncertain reactions of responders to the proposers’ choices, so that the proposers’ decisions will in general depend on their expectations about the behavior of responders.
This paper shows, with the specific example of the ultimatum game, how the em-pirical content of experiments of proposal and response can be improved in several ways. First, as shown by Manski (2002), many experimental studies have to rely on assumptions on agents’ expectations about other players’ actions or other uncertainty (such as rational expectations) in order to identify preferences, since observed choice data is generally not rich enough to uncover both expectations (’beliefs’) and prefer-ences. An exception is Nyarko and Schotter (2002), who collect data on actions and beliefs in a laboratory setting for repeated two player games with simultaneous de-cision making. They find that players are more likely to best-respond to their stated beliefs than to beliefs inferred by the analyst from past decisions. Following Nyarko and Schotter (2002) and Manski (2004), we address the identification problem in Man-ski (2002) by collecting data on the proposers’ subjective probability distributions over the actions taken by responders, in addition to the usual experimental data. Thus we ask the proposers direct questions on what they think are the probabilities that their responder will make certain decisions.
Second, following the recent trend set by, for instance, Harrisson, Lau and Williams
(2002),1 we use a large representative sample of the Dutch population rather than a
convenience sample of, for example, students, as used in much of the experimental literature. The individuals in the sample were randomly assigned to a specific role, and are thus all drawn from the same population distribution of preferences and beliefs. This makes the analysis useful for making inference on a broad population.
Our non-homogeneous sample raises the issue of heterogeneity in preferences and beliefs. A third important feature of our work is that we develop a rich econometric model incorporating (”observed”) heterogeneity explained by background character-istics such as age and education level as well as (”unobserved”) heterogeneity that cannot be captured by such characteristics.
A fourth distinctive feature of the model is that it is structural in the sense that it ex-plicitly disentangles preferences and beliefs about the reactions of responders. Unlike other investigations which have incorporated subjective expectations data in an em-pirical choice model, our model also allows for correlation between preferences and beliefs of proposers. Thus, for example, we allow for the possibility that proposers with optimistic beliefs about the actions of responders also have systematically dif-ferent preferences, leading to a spurious correlation between beliefs and actions and inducing an endogeneity bias in the estimates of the preference parameters. We avoid this bias and are able to make causal inferences on the effect of beliefs on choices of proposers in the game.
Our application concerns preferences and beliefs for inequity aversion, an issue that has received a lot of attention in the recent experimental literature. We use the model for linear asymmetric inequity aversion introduced by Fehr and Schmidt (1999), distinguishing inequity aversion resulting from having a higher from that of having a lower payoff than the other player. This model can explain the common finding in ultimatum game experiments that many proposers make equitable offers, in contrast with the traditional sub game equilibrium prediction that offers should not exceed the smallest positive amount that can be offered. The latter ”traditional” prediction rests on the two assumptions that proposers maximize their own expected monetary
payoffs and expect responders not to reject any positive offer (for example, because proposers think responders also maximize their own monetary payoffs). Thus both preferences leading to deviations from expected pay-off maximization, and the belief that not everyone accepts any positive offer could explain why experimental results are out of line with the traditional prediction. Our framework and the data on beliefs are particularly suited to disentangle these two explanations.
Our sample is randomly split up in four groups: proposers and responders in the ultimatum game, and proposers (“dictators”) and passive responders (receivers) in the dictator game. The proposers in the ultimatum game are not only asked how much they want to offer to the other player, but are also asked about their subjective prob-abilities that responders will accept or reject any possible offer. Actions of responders in the ultimatum game are elicited using the strategy method, requiring responders to indicate their intended action for all possible offers that can be made to them. Our model is estimated combining all this information.
Our results can be summarized as follows. First, we find substantial deviations between the average subjective acceptance probabilities reported by the proposers and the actual acceptance rates in the responder data.
Second, we find that the model which incorporates proposers’ subjective proba-bility distributions over all possible actions of responders provides a better fit to the observed choice distribution than a model which assumes that proposers have ratio-nal expectations. This mirrors Nyarko and Shotter (2002) finding that choice models using subjective probability distributions provide a better fit to the actions in two by two normal form games.
Third, we find substantial unobserved heterogeneity in the subjective probabilities as well as in preferences for inequity aversion, with a strong positive correlation be-tween optimism and inequity aversion.
Fourth, we find that aversion for inequity to own and other’s disadvantage declines as subject’s level of education increases, and aversion for inequity towards other’s dis-advantage increases with age. Combining these effects, we find that of all the
sub-groups of the population our model can distinguish on the basis of observable charac-teristics, subjects with high levels of education, below 30 years of age, and not partic-ipating in the labor market, have the most egoistic preferences in the sense that their predicted behavior in the experiment comes the closest to what is predicted by the tra-ditional paradigm of maximizing own pay-off. This suggests that inequity aversion is much larger in the Dutch population as a whole than extrapolations based on student samples would suggest.
The rest of this paper is organized as follows. Section 2 presents our experimental design. Section 3 presents our approach to identify the economic parameters of inter-est. Section 4 presents some descriptive statistics of our sample, and summary statistics of the choice decisions in the experiment. Section 5 discusses the estimation results of the structural model, and presents simulations to assess the fit and the implications of the model for observed behavior. Section 6 concludes.
2 Experiment
Our subjects were recruited by CentERdata, the survey research institute affiliated to Tilburg University in the Netherlands. The main activity of CentERdata is to manage and carry out panel surveys through an Internet panel: the CentERpanel (hereafter CP), consisting of approximately 2000 Dutch households. Every Friday, CP’s house-hold members receive a questionnaire which they are asked to fill in at any time be-tween that Friday and the Tuesday of the following week. This is done at home, either on their computer or using a television set connected to a set–up box linking the house-hold to the CentERdata server. In order to keep the sample representative of the Dutch population, households without a computer or a television set are given the necessary
equipment.2
2For a description of the recruitment, sampling methods, and past usages of the CentERpanel see: www.centerdata.nl. Children below 16 years of age as well as immigrants are excluded from the panel, the latter group for the reason that low language proficiency in Dutch makes it difficult to answer the
There are many reasons why the CP is an attractive medium to conduct experi-ments. First, it gives access to a representative sample of a population, which is one of the key features of our study. Second, because participants answer questions on a computer, we are able to replicate the environment of a laboratory experiment, which simplifies comparisons of our results with those of the existing literature. Third, the experiment is double blind as participants were told that they will be anonymously matched and that their identities are not revealed to the experimenters. Finally, as CentERdata reimburses the weekly telephone costs for answering the questionnaire by crediting CentERpoints (100 CentERpoint = 1 Euro) to the respondents’ bank ac-counts four times a year, our participants are already familiar with payment in ficti-tious currency. This allows us to use CentERpoints as the experimental currency unit and reimburse our participants in a convenient way.
We randomly assigned the participants of the CentERpanel to the “ultimatum game”
or the “dictator game.” In both games, two persons, a proposer and a responder,3can
share an amount of 1000 CentERpoints (10 Euros).4 In the ultimatum game the
pro-poser suggests an allocation to the responder. We discretized the choice set of the
proposer to eight possible allocations: A∈ {(1000, 0),(850, 150), (700, 300),(550, 450),
(450, 550), ... ,(0, 1000)}where the first and second amount denote the payoffs for the
proposer and the responder, respectively. Responders made their choices using the strategy method, asking them for each of the eight allocations that could be offered whether they would accept or reject. The response which corresponded to the actual decision of the proposer matched to this responder determined the payoff of both
par-questions on a weekly basis.
3For ease of reading we keep the terms “proposer” and “responder” for the different roles. In the experiment we avoided suggestive labels and referred to the persons themselves and the “matched panel member.” Computer screens of the original experiment (in Dutch) and a translated version are available upon request.
4Carpenter, Burks, and Verhoogen (2005) find that in laboratory ultimatum and dictator games, there are no significant differences in the actions of the players when the stakes are raised from 10 U.S. dollars (approximately 8.5 Euros) to 100 U.S. dollars.
ticipants.
After all participants had made their decisions, proposers and responders were ran-domly matched and payoffs were computed based on the decisions of the pair. The
fi-nal payoffs were computed as follows: if the proposer had offered the allocation(X, Y)
and the responder had stated he or she would accept this allocation, responder and proposer received the amount according to this allocation, i.e., the responder received
X and the proposer received Y CentERpoints. If the offer was rejected, the proposer
and the responder both received nothing.
In the dictator game the responder had no active role. Both players received the payoffs determined by the proposer (which is why this game is referred to as “dictator game”).
The strategy method was chosen to overcome the difficulty of having CP members interact in real time. This method has the additional advantage of providing more information, as the responses to all eight possible allocations are elicited, including
allocations that are never or hardly ever chosen by the actual proposers.5
The beliefs of proposers in the ultimatum game were elicited with a series of subjec-tive probability questions. Eliciting subjecsubjec-tive probabilities is cognisubjec-tively demanding. To simplify the respondents’ task, probabilities were obtained by asking subjects how many out of 100 persons would accept/reject each offer, or how many out of 100
per-sons would offer a given allocation.6 In order to be able to account for framing effects
resulting from the phrasing of the question, approximately half of the participants were asked to state their subjective acceptance probabilities for each possible offer, while the other half were asked to state their rejection probabilities. Also, in order to circumvent the possibility that belief elicitation influences behavior, these questions were asked after players had made their decisions. Subjects were not rewarded based on the
accu-5McLeish and Oxoby (2004) find that decisions in the ultimatum game collected with the strategy method are not statistically different from decisions collected in a hot environment.
6This follows Hoffrage, Lindsey, Hertwig, and Gigerenzer (2000) who find that people are better at working with natural frequencies than with percent probabilities.
racy of their expectations.7 This concluded the experimental part of the session.
The experiment was conducted in March 2004. Individuals contacted had to read an opening screen informing them that they were selected to participate in an experiment conducted by a team of university researchers. A detailed description of the game and an explanation of the payoff structure followed. Each person was informed that conditional on their participation, they would be randomly assigned to one of the roles and would be randomly matched to another panel member playing the opposite role. The role was revealed once a panel member had agreed to participate. We contacted 1410 panel members of whom 130 declined to participate and 17 did not react. Of the 1263 panel members who completed the experiment, 389 (268) were proposers and 355
(251) were responders in the ultimatum (dictator) game.8 As announced before the
experiment, each participant received information on the outcome of the game and their final payoff two weeks after the experiment, and this amount was later credited to their CentER bank account.
3 An Empirical Model of Preferences and Beliefs
In this section we will introduce an econometric model to explain the behavior of pro-posers and responders in the ultimatum game and propro-posers in the dictator game, as well as the acceptance or rejection probabilities reported by the proposers in the
ul-7There are theoretical grounds suggesting that beliefs elicited by paying subjects for the accuracy of their beliefs using the quadratic scoring rule (Selten, 1967) should be lead to more precise disclosure of individual expectations than not paying or paying a flat fee, but the empirical evidence seems not to support this. Ortmann, Fitzgerald, and Boeing (2000) find that unpaid participants in their experiment had surprisingly accurate estimates of the average actions; both Friedman and Massaro (1998) and Son-nemans and Offerman (2001) find insignificant differences between using the quadratic scoring rule or paying subjects a flat fee.
8Note that the number of responders exceeds the number of proposers. In order to balance the unequal numbers of players in both roles, 8 proposers were randomly assigned twice to a responder. As all other participants, those 8 proposers received payments resulting from only one (the first) matching.
timatum game. The model is structural in the sense that preferences and beliefs are explicitly separated. We allow for heterogeneity of both preferences and beliefs across the population. Preferences and beliefs can vary with observed characteristics such as
age, education level, labor force status, and gender (a vector xiof observed individual
characteristics) and with unobserved characteristics.
Preferences with Inequity Aversion
We incorporate inequity aversion in preferences following Fehr and Schmidt (1999), allowing for different disutilities of having more and having less than the opponent.
In the case of no uncertainty, the utility to player i from pay-offs ysel f to him- or herself
and yother to the other player is given by:
ui(ysel f, yother) =ysel f −αimax{yother−ysel f, 0} −βimax{ysel f −yother, 0} (1)
For respondents who only care about their own pay-off, αi and βi would be equal to
0. If respondents are inequity averse, αiand βi will be positive. If βiis smaller than αi,
then, keeping the own pay-off constant, the per (“CentER”) point disutility of having less than the other player is larger than the per point disutility of having more than the other player.
To allow for heterogeneous preferences across the population, we will allow the
parameters αiand βito vary across respondents i, using the following specification:
αi =exi0α+uiα; βi =ex0iβ+u β
i (2)
Here uαi and uiβ reflect unobserved heterogeneity. We will assume that (uαi, uβi) is
in-dependent of error terms and background variables xi and follows a bivariate normal
distribution with mean zero and arbitrary covariance matrix. We expect a positive
cor-relation between uαi and uβi since people with a general aversion to inequity will have
large values for both.
For proposers in the dictator game, equations (1) and (2) are sufficient to describe their optimal choice, since they face no uncertainty. Moreover, in the dictator game
the sum of the two pay-offs is given and is always the same, and it can be normalized
to 1 (1,000 CentER points or 10 Euro, in our experiment), implying that yother equals
1−ysel f. As discussed in the previous section, each proposer was asked to choose
from a set of eight amounts(j =1, ... , 8), involving pay-offs yprop(1), ... , yprop(8).
Per-fectly optimizing behavior in the dictator game would therefore imply that proposer i chooses the option j that maximizes
vDij =yprop(j) −αimax{1−2yprop(j), 0} −βimax{2yprop(j) −1, 0} (3)
To allow for the fact that some proposers in the dictator game will make
sub-optimal choices, we add idiosyncratic error terms λDeij to the true utilities vijD, and
assume that respondent i chooses the option j that maximizes vDij +λDeij rather than
vijD. We assume that the errors eij are independent of each other and of other variables
in the model (such as the unobserved heterogeneity terms and the observed
charac-teristics xi), and follow a Generalized Extreme Value type I (GEV(I)) distribution. This
gives rise to the familiar multinomial logit probabilities:
P(Proposer i chooses j|vi1D, ... , vDi8) = e
vDij/λD
∑8k=1evDik/λD
(4)
The parameter λD indicates the importance of sub-optimal behavior of the proposers
in the dictator game. If they behave optimally, λD is zero. If their behavior were
equiv-alent to random choice, with no role for the utility values, then λD would be infinitely
large.
Proposers in the ultimatum game are faced with uncertainty, since they do not know whether their offer will be accepted or rejected. We will assume expected utility
maximization, based upon proposer i’s specific subjective probability Qi(j) that offer
j will be accepted. Since the utility is zero if the offer is rejected, the expected utility
of offer j is given by vU
ij = Qi(j)vDij. Allowing for sub-optimal behavior in the same
way as before, with noise-to-signal ratio parameter λU, this gives the following choice
P(Proposer i chooses j|vUi1, ... , vUi8) = e vU
ij/λU
∑8k=1evUik/λU
(5) For responders in the ultimatum game, the uncertainty is resolved, making their choice problem deterministic. We will assume that the distribution of preferences among responders is the same as among proposers. This assumption is very plausible, since participants were randomly assigned to the role of proposer or the role of
respon-der. Under these assumptions, responder i who gets an offer yresp(j) = 1−yprop(j)
with(j =1, ... , 8)has to trade off the utility of rejecting and the utility of accepting the
offer. According to (3), these utility values are vR
ij =0 and
vijA =yresp(j) −αimax{1−2yresp(j), 0} −βimax{2yresp(j) −1, 0}. (6)
A perfect pay-off maximizing responder would thus choose to accept the offer if and
only if vijA > vRij(= 0). To allow for suboptimal behavior, we again add GEV(I) errors
that are independent of everything else in the model, multiplied by a noise-to-signal
ratio parameter λR, and assume the responder maximizes over the contaminated
val-ues rather than the exact valval-ues, giving the binary logit probability:
P(Responder i accepts offer j|vAij) = 1
1+e−vijA/λR
(7)
Beliefs
In the experiment we ask for each proposer’s beliefs, so one approach is to take the reported acceptance or rejection probabilities in the data and plug them into equation (5). Assuming that the reported beliefs are exactly the probabilities that the proposers use in making their decisions and assuming that error terms and unobserved
hetero-geneity components (uαi, uβi) are independent of these beliefs would then imply that
the Qi(j)are observed exogenous variables, and the preference distribution can be
There are, however, two reasons why this approach is unlikely to be valid. First, there appears to be a framing effect of asking either rejection or acceptance probabili-ties: the distribution of the raw data on reported acceptance probabilities differs sub-stantially from the distribution of acceptance probabilities implied by the raw data on reported rejection probabilities (see next section), showing that answers to these ques-tions suffer from framing bias. This framing bias cannot have affected the answers to the choice questions (since the questions on the beliefs that have the ”frames” in their wordings come after the questions on the choices), so that the probabilities en-tering the utility comparison must first be purged of the framing bias in the reported probabilities.
Second, the acceptance probabilities may partly be driven by unobserved
hetero-geneity that is correlated with the unobserved heterohetero-geneity terms uα
i and u
β
i in the
preference parameters. The people with high inequity aversion may, for example, tend to be more optimistic and have higher subjective probabilities that their offers will be accepted. Early experiments in cognitive psychology, surveyed in Rapoport and Wallsten (1972), already provided evidence that subjective probabilities are not inde-pendent of utilities over outcomes. If this is indeed the case, it leads to correlation
between reported acceptance probabilities and the unobserved heterogeneity terms uα
i
and uβi in the choice equations, implying that reported acceptance probabilities are not
exogenous in the choice model and that estimates of preferences assuming exogeneity of choice probabilities will be biased.
Both issues can be dealt with by modelling preferences and acceptance and rejection probabilities jointly. We will allow these probabilities to vary with the same
individ-ual characteristics xi that relate to preferences. In the raw data, we saw substantial
bunching of the reported probabilities at 0 and 1. We will account for this by mod-elling censoring at zero and at one, as in a two-limit tobit model. First, we model the
true probabilities Qi(j) used in expected utility maximization, not affected by framing
or other reporting errors:
Q∗i(j) = xi0δ+γj+uiP
Qi(j) = 0 if Q∗i(j) <0
= Q∗i(j) if 0<Q∗i(j) <1 = 1 if Q∗i(j) >1
example, we expect them to increase with j as long as amounts remain below the equal split, since proposers will probably realize that acceptance probabilities will rise if the
amount offered to the other player increases towards an equal split. Whether γj also
increases with j beyond the equal split or not is less clear; here acceptance probabilities (and thus also the beliefs about them) can increase or decrease depending on the extent
of inequity aversion. The unobserved heterogeneity term uPi reflects the proposer’s
optimism or pessimism. We will assume that the three unobserved heterogeneity terms
(uαi, uβi, uPi)are jointly normal with mean zero and with arbitrary covariance matrix to
be estimated, independent of error terms and of the regressors xi.
Reported probabilities Pi(j)can deviate from the true probabilities because of
fram-ing bias or because of an idiosyncratic reportfram-ing error eijP. The latter is assumed to be
i.i.d. normal and independent of everything else. The framing bias at offer j is
mod-elled in a symmetric way, using a parameter φj. Define a ”framing” variable Fi which
is equal to 1 if the belief questions to proposer i are framed in terms of accepting and
equal to -1 if they are framed in terms of rejection. The model for the ”reported”9
acceptance probabilities Pi(j)is as follows:
Pi∗(j) = x0iδ+γj+φjFi+uiP+eijP Pi(j) = 0 if Pi∗(j) < 0
= Pi∗(j) if 0<Pi∗(j) < 1 = 1 if Pi∗(j) > 1
The raw data (see next section) suggest that the framing parameters φjare negative,
9The reported acceptance probability is defined as one minus the reported rejection probability if the questions are framed in terms of rejection probabilities.
implying that reported acceptance probabilities are too small if the questions ask for probabilities of accepting, and reported probabilities of rejecting are too small if the questions ask for probabilities of rejecting. Imposing symmetry on the framing effects
is necessary to identify the framing parameters and the parameters γjin the true
prob-abilities from the reported beliefs alone (i.e., without relying on the data on choices and assumptions on preferences).
4 Descriptive statistics: sample, choices, and reported
be-liefs
Table 1 gives the description of the explanatory variables we will use in the empirical analysis. The demographic structure of our sample is characterized by a median age of 48. The youngest and oldest participants were 18 and 89 years old. We group our participants in six age categories, each comprising 10 years of age. With the border
categories, i.e., participants younger than 25 years (“Age<25”) and more than 64 years
of age (“Age>64”), comprising 3% and 15.5% of all participants, respectively. Most
of our participants are between 35 and 44 years (23% in “Age 35-44”) or between 45 an 54 years (25% in “Age 45-54”) old. Education levels are also arranged in six categories. The variable “Educ1” is a dummy for the lowest level, i.e., primary education (5% of the sample), and “Educ6” is a dummy for the highest level of education, i.e., university degree (11% of the sample). For more than half of the participants, the highest degree is from a vocational training school, at a low, intermediate, or high level. (26%, 20% and 24%, respectively). About 59% of our subjects are active in the labor force (“Market work”), 12% are homemakers (“House work”), 16% are retired and 13% do not work (“Other”), i.e., are unemployed or students.
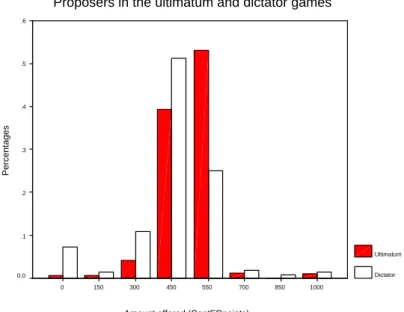
Figure 1 presents the choice frequencies of proposers in both the ultimatum game and the dictator game. These distributions exhibit two well-known features (see, e.g., Camerer, 2003): First, proposers send positive amounts, with the mode around the
equal split, and with very few amounts much above that. Second, the distribution of amounts offered to the other player in the ultimatum game stochastically dominates that in the dictator game.
— Figure 1 about here
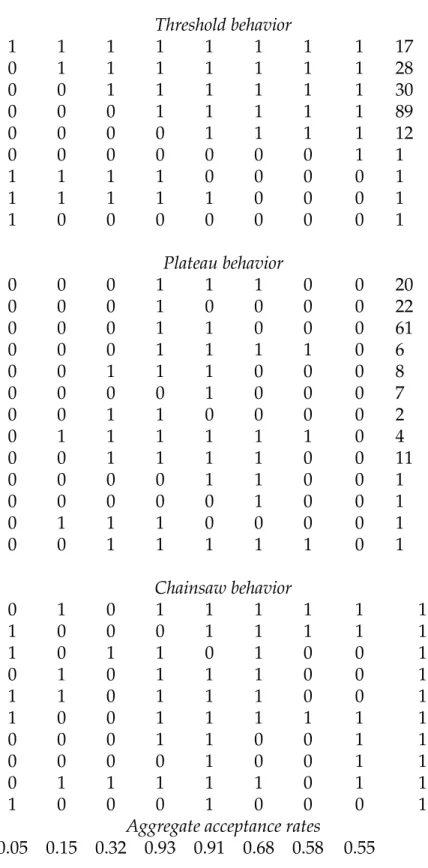
—-Table 2 presents the choices of responders in the ultimatum game. Each line of the table presents a choice sequence obtained using the strategy method, and the final col-umn presents the sequence frequencies. Choice sequences are grouped into three cat-egories. The biggest group (53.7% of all cases) is comprised of threshold players who accept any proposal above a certain amount. Their threshold level is informative of the degree of inequity aversion for cases where they receive less than the other player. The second biggest group (43.3%) are plateau players, defined as individuals who accept offers in a range which excludes both the minimum and maximum amounts that can be offered. The width of the plateau is informative of the degree of inequity aversion to
both own and other’s disadvantage (i.e., of αi and βi), as individuals reject offers
giv-ing them either extremely advantageous or disadvantageous positions relative to the proposer. Similar levels of plateau behavior in the ultimatum game have been reported in the laboratory (see e.g., Hennig-Schmidt, Li, and Yang, 2004).
— Table 2 about here —
Finally, the third group plays what we call chain-saw behavior, without any
system-atic pattern. This group is small (3.0%) and will be left out of our empirical analysis.10
The presence of a sizeable population of plateau types has an immediate conse-quence for the aggregate acceptance rates, presented at the bottom of Table 2. We find that the acceptance rates increase to above 90% for proposals around the equal split, be-fore progressively declining to just above 55% when proposers offer the whole amount to the responder.
10We also estimated the model including these respondents and found results that were very similar to those we present.
Figure 2 presents the densities of subjective acceptance probabilities of proposers in the ultimatum game for offers of 0 CP, 450 CP, and 1000 CP. We see that the mode of the density is concentrated near zero in the case of offers of 0 CP, implying that most proposers believe that offers of 0 will not be accepted by the responder. Still, there is also a non-negligible number of proposers expecting that an offer of 0 will certainly be accepted.
— Figure 2 about here —
The density for offers of 450 CP is quite different - it is centered around 50%. In this case, there is substantial variability in the reported beliefs, with subjective acceptance probabilities varying all over the unit interval.
For offers of 1000 CP, we find almost the mirror image of the distribution for of-fers of 0 CP. Almost half of the proposers think an offer of 1,000 CP will certainly be accepted, and about 25% think the offer will certainly be rejected.
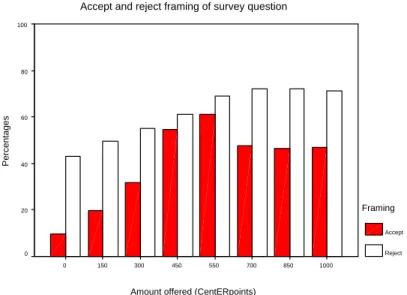
In Figure 2, proposers in the ultimatum game getting the beliefs questions with the accept frame and the reject frame are merged. Figure 3 presents the means of the subjective acceptance probabilities for each amount that could be offered, separately for those who got the accept and the reject frames. There is a significant effect of the question frame, with the accept frame giving lower acceptance probabilities than the reject frame. This effect is smallest for amounts sent of 450 and 550 CentER points. Violation of the additivity axiom of probability, by which the reported likelihood of an event and its complement sum to less than one, seems to be well recognized in the psychology literature on probability judgment; see Lindley, Tversky, and Brown (1979) for a discussion of this phenomenon and related findings.
— Figure 3 about here —
Interestingly, many proposers in the ultimatum game appear to anticipate the pres-ence of plateau types in the responders population. We see that the acceptance rates expected by proposers level off and even decline with offers in excess of an equal split.
This result is all the more remarkable since proposers have not had a chance to learn the expected pattern of response, either by having played the game in repetition or by having been responders themselves.
5 Econometric results
We estimated the model presented in section 3 by maximum simulated likelihood.
In-tegration over the joint distribution of(uαi, uiβ, uPi )was performed by simulation, using
100 draws for each observation based on Halton sequences (see Train, 2003). In or-der to evaluate the impact of incorporating subjective probability distributions in the model, we estimated a second model assuming that proposers in the ultimatum game had rational expectations about the responders’ acceptance rates. In that model, beliefs of all proposers are the same, and set equal to observed aggregate acceptance rates of responders, taken from the bottom row of Table 2. This model is estimated without the equation for beliefs and thus also without correlation between beliefs and
unob-served heterogeneity in preferences.11 A third model takes the reported “raw”
sub-jective probabilities as exogenous variables reflecting the true probabilities underlying the proposers’ decisions.
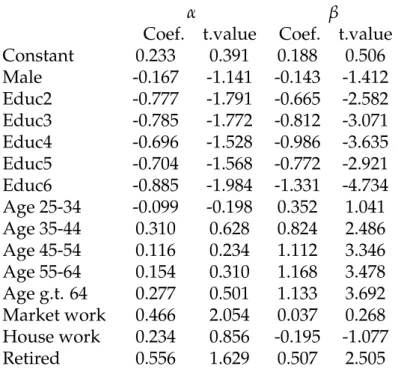
Table 3 presents the estimated parameters for the first two models, distinguishing
the effects of some background characteristics on the inequity aversion parameters αi
and βi, and, in the first model, on the subjective beliefs of proposers in the ultimatum
game. Table 4 presents the preference parameters for the third model. Overall, para-meter estimates of the inequity aversion equations of the three models are similar. This could be expected since the choice data for senders in the dictator game and respon-ders in the ultimatum game are used in exactly the same way, only the choices of the proposers in the ultimatum game are interpreted differently. Signs in the three models correspond in all but a few cases and so do significance levels. As we will show below,
11The fact that the acceptance probabilities are estimated was ignored, so that the standard errors in this model are probably slightly underestimated.
the model which uses subjective expectations provides a better fit to the data than the rational expectations model and than the model with reported probabilities taken as exogenous, better reproducing the distribution of choices made by proposers in the ultimatum game.
— Table 3 about here — — Table 2 about here
—-For now, because of the similarity in preference parameters, we will focus our dis-cussion on the determinants of inequity aversion using the model with subjective ex-pectations. A Wald test of the null hypothesis that parameters of the α equation are
equal to those of the β equation gives a test statistic of 62.21 (χ215, p-value = 0.000),
indicating a significant difference between correlates of aversion to own and others disadvantage. We find that gender does not affect either type of inequity aversion. In-dividuals with lowest levels of education have a higher level of inequity aversion, both when inequity is to their advantage (the joint test that all education coefficients are zero gives p-value = 0.0054) or to their disadvantage (joint test with p-value = 0.0748). While age does not have a significant effect on the disutility from own disadvantage, the disu-tility from other’s disadvantage significantly increases with age. Individuals working for pay have significantly higher aversion than non-workers to inequity which is to their own disadvantage.
From (2), it is straightforward to break down the total variance in predicted log
disutility from inequity into systematic parts x0α and x0β explained by observed
char-acteristics, and unobserved parts uαi and uiβ. We find that 9.9% of the total variation in
log(α) and 17.6% of the total variation in log(β) can be attributed to variation in the
systematic part.
The last two columns of Table 3 present estimates of the beliefs equation. We see that observable characteristics have statistically insignificant effects on beliefs. A Wald test of the null hypothesis that none of the observable characteristics plays a role gives
a value of 22.94 (χ214) with a p-value = 0.0613, so that the null hypothesis is not rejected at the 5% level. This result is consistent with the fact that subjects with different ob-servable characteristics had the same information set when we elicited their beliefs. They were randomly matched to another member of the panel, so that the proposer’s characteristics are independent of the responder’s characteristics. It is therefore per-fectly rational that the proposer’s own characteristics do not affect the beliefs on the responder’s actions.
As expected from Figure 3, we find that corrections for framing effects are jointly
significant. A Wald test (χ2 = 169.2, p-value for 8 df = 0.000) strongly rejects the null
that there are no framing effects (i.e., φ1=φ2 =... =φ8 =0).
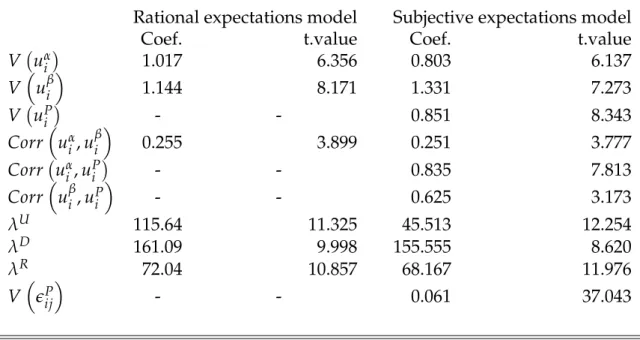
Table 5 presents parameter estimates of the covariance structure of the parts of at-titudes towards inequity aversion and subjective acceptance probabilities that are not explained by observed characteristics. We see that unobserved attitudes play a
sig-nificant role, as reflected by the positive and precisely estimated variances of uα
i, u β i
and uiP. The share of total unexplained variation in beliefs of proposers in the
ulti-matum game explained by individual attitudes is 93.3%.12 As conjectured, uα
i and u
β i
are significantly positively correlated, indicating that individuals with a stronger nega-tive predisposition towards inequity to their disadvantage also tend to have a stronger negative predisposition towards inequity to their advantage. Interestingly, we find
that the correlations of uP
i with uαi and u
β
i are both significant and positive, implying
that proposers in the ultimatum game who are optimistic about the acceptance rates of responders also tend to have significantly higher levels of inequity aversion, on
aver-age. Finally, the three scale parameters λU, λD and λR, whose magnitudes are directly
related to the CP units used in the experiment, are found to be precisely estimated in both models. All scale parameter estimates are larger in the rational expectations model than in the subjective beliefs model, indicating that incorporating subjective probabilities in the model reduces the estimated level of noise in the decision
mak-12Because uP
i and eijPare independent, the share of total unexplained variation in reported subjective
ing process. This particularly holds for λU, the parameter determining the noise in the decisions of proposers in the ultimatum game. The main difference between the two models is that these decisions depend on subjective beliefs in the complete model, whereas they depend on (objective) aggregate acceptance rates of responders in the rational expectations model. Apparently, at least part of what is ascribed to beliefs in the complete model is ascribed to noise in the model imposing rational and identical beliefs for all subjects. Furthermore, the covariance structure and scale parameters in the model using “raw” subjective probabilities as exogenous variables (bottom of Table 4) are similar to those of the model with corrects for endogeneity and framing bias in the reported subjective probabilities. In particular, there is still an important reduction
in λU relative to the model estimated assuming rational expectations.
— Table 5 about here —
Distributions of α and β and model specification
The left hand columns of Table 6 presents quantiles of the predicted distributions of
αiand βi in the population based on parameter estimates of the complete model. The
bottom of the table reports the estimated correlation coefficient between αi and βi in
the population. We find that the correlation between aversion for inequality to own and aversion towards inequality to other’s disadvantage is positive.
— Table 6 about here
The quantiles give three important insights. First, the estimated proportion of pure
selfish types is less than 10% of the population (α and β close to zero).13 Second, the
cumulative distribution of β rapidly dominates the cumulative distribution of α, indi-cating a relatively stronger disutility from having more than others than from having
13Our functional form assumptions on α and β rule out negative values. We also estimated a model where α and β are linear functions of observable and unobservable characteristics. Results were very similar to those presented here.
less than others. Third, there is considerable heterogeneity in predicted preferences for inequity aversion, with both α and β taking values in excess of 4.
Several papers provide point estimates of α and β, most of them based on experi-mental data collected in the lab with homogeneous samples (see, e.g., Goeree and Holt, 2000). To our knowledge, there exist no estimates of distributions of α and β in either student or broader populations. In their original study of inequity aversion, Fehr and Schmidt (1999) proposed distributions of α and β which were calibrated on experimen-tal evidence based on observed offer and acceptance behavior from ultimatum exper-iments, mostly relying exclusively on student participants. Their calibrated multino-mial distributions were as follows, with the first number denoting the value of α or β, and the number in parentheses denoting the calibrated proportion for that value in the
population: α ∈ {0(0.3), 0.5(0.3), 1(0.3), 4(0.1)}and β ∈ {0(0.3), 0.25(0.3), 0.6(0.4)}.14
When comparing the medians of these distributions with the medians of α and β in Figure 6, we find that the Dutch population tends to have inequity aversion parame-ters exceeding those of Fehr and Schmidt (1999). This is particularly the case for the distribution of β, where our estimated median is 1.227, as opposed to 0.25 for the Fehr and Schmidt (1999) calibration. Moreover, more than 60% of our population is pre-dicted to have an aversion for inequity to other’s disadvantage with a β greater than 1. In contrast, Fehr and Schmidt (1999) rule out the possibility that β is larger than 1 as implausible, since values of β which are greater than 1 suggest that subjects who have more than their opponent would, keeping the opponent’s pay off constant, be better off giving away the surplus. Our responders data, characterized by an important share of plateau behavior, imply that, at least for a substantial part of the Dutch population, this is not as implausible as it seemed, with many people rejecting the offer and thus sacrificing their own pay-off to get more equity.
A natural question is whether the differences between our distributions of α and
β and those of Fehr and Schmidt (1999) can be explained by a specific cultural trait 14Similar distributions were found by Huck, M ¨uller, and Norman (2001) in a sequential two player market experiment.
of the Dutch population, or a composition effect, reflecting the greater heterogeneity of our participants compared to those of Fehr and Schmidt (1999). Restricting our-selves to only individuals below 25 years of age, with a university degree, who are not homemakers or working for pay, we get a median predicted α of 0.416 and a median predicted β of 0.256, well in line with the Fehr and Schmidt predictions. Hence, if there is a cultural effect, it does not show up in the subgroup of the population which mirrors the subjects typically used in lab experiments. These results suggest that the compo-sition of a sample can have an important impact on the estimated levels of inequity aversion.
In order to check our model specification in an informal way, we estimated the vectors of inequity aversion parameters using only the accept/reject decisions of re-sponders in the ultimatum game. This is based on equations (2), (6), and (7) only, and does not use the information on actions and beliefs of dictators and proposers in the ul-timatum game. Using the new preference parameter estimates, we predicted again the
population distributions of α and β.15 Quantiles of these distributions are presented
along those of the complete model in the right hand columns of Table 6. We find that both the quantiles and the correlation between the α and β distributions accord well with those obtained when data on proposer decisions and beliefs are added to those of the responders.
Marginal effects
In order to quantify the relationship between the predicted heterogeneity in choice distributions and observable characteristics, we used the parameter estimates of the model with subjective expectations to compute expected choice distributions in the dictator and ultimatum games for a benchmark individual. Given the predominance of laboratory studies with subject pools recruited from the student body population, our benchmark subject is a female below 25 years of age and with a university degree
15Parameter estimates and significance levels were very close to those of the complete model and are available upon request.
(Educ6 = 1) who is currently neither working for pay, nor homemaker or retired (labor force status “Other”). We then computed corresponding distributions by altering the characteristics of the benchmark one at a time. Comparing the new predicted choice distributions with those of the benchmark individual gives a series of marginal effects for all the observable characteristics in the model.
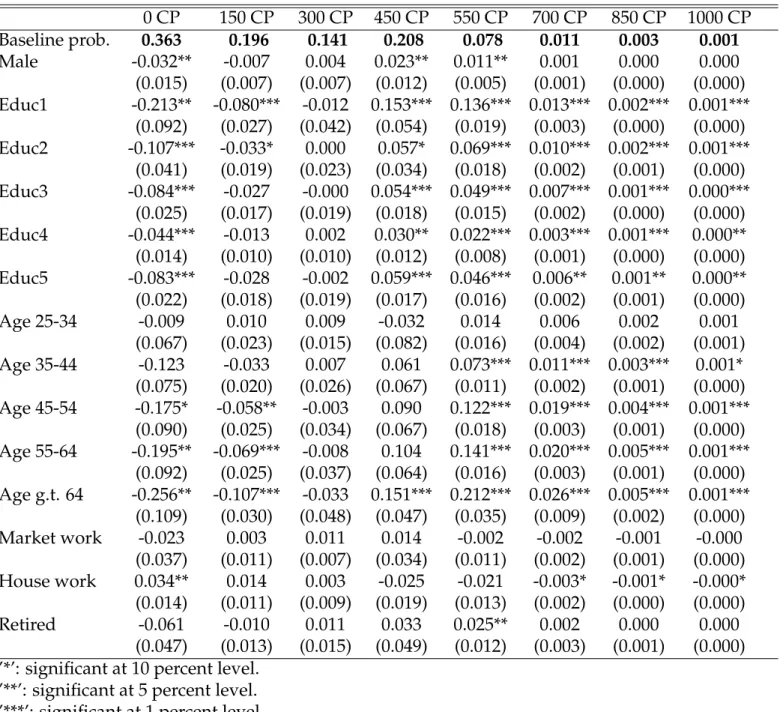
Table 7 presents the results for the proposers in the dictator game (“dictators”). The mode of the baseline choice distribution of the benchmark dictator is to offer 0 CP, with a probability of 36.3%. Offers of 150 CP, 300 CP, and 450 CP are made with probabilities of 19.6%, 14.1%, and 20.8%, respectively. The probability of making offers above 450 CP is less than 10%. The other rows in the table present the deviations from the baseline probability resulting from altering one characteristic.
— Table 7 about here —
The strongest and most significant effects relate to changes in age and education level. We find that dictators with the lowest education level have a significantly higher probability of making offers in the equal split range, with the probability of making offers of 450 CP and 550 CP 15.3 and 13.6 percentage points higher than for the highest level of education, respectively. Most of this increase in probability is taken from offers of 0 CP, whose probability falls by 21.3 percentage points. The magnitude of the effects tends to dampen as the level of education increases and comes closer to the bench-mark level (high education). These education effects are consistent with the parameter estimates, showing that inequity aversion to other’s disadvantage is stronger for low education than for high education individuals (see Table 3).
Similar differences are found across age groups.16 Individuals between 44 and 54
years of age have a 12.2 percentage points higher probability of offering 550 CP, and a 17.5 percentage points lower probability of offering 0 CP than the younger bench-mark person. The age effect is stronger as age differs more from the benchbench-mark level. Individuals above 64 years of age have 21.1 percentage points higher probability of
offering 550 CP, and 25.6 percentage points lower probability of offering 0 CP. Again, these results reflect our finding that older subjects are more averse to inequity to other’s disadvantage.
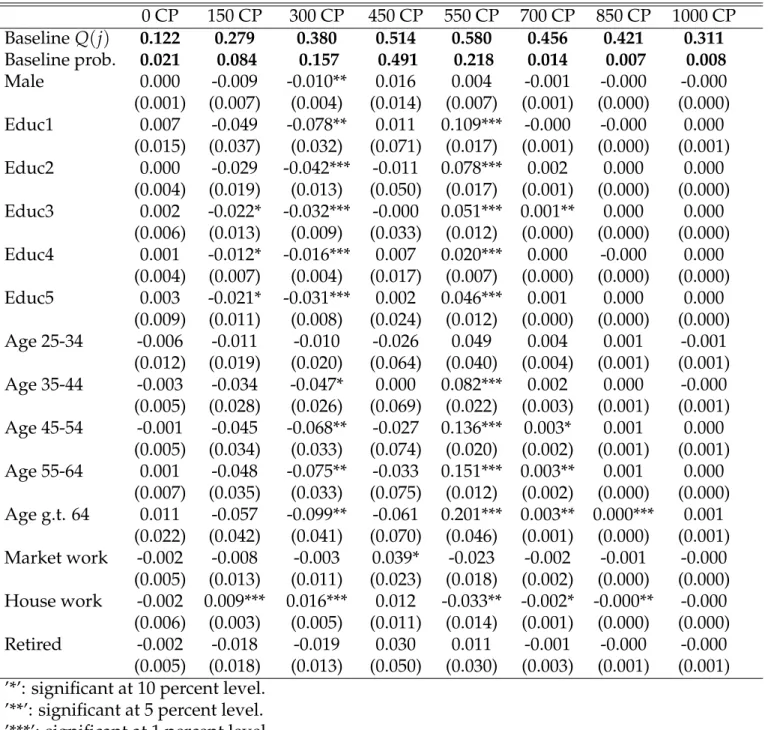
When computing marginal effects in the ultimatum game, account must be taken of the fact that variations in observable characteristics can affect the choice distribution through variations in preferences and variations in subjective beliefs. In order to make a direct comparison possible with the marginal effects in the dictator game (where all acceptance probabilities are equal to one), we present the marginal effects of shifts in preferences only, keeping the subjective beliefs fixed to those of the benchmark indi-vidual. The marginal effects reflecting differences in both subjective beliefs and pref-erences were found to be very similar, in accordance with the insignificant impact of
observable characteristics on subjective beliefs reported in Table 3.17
Table 8 presents the results. To understand the difference with the dictator game,
the first line reports the predicted subjective acceptance probabilities Qi(j) for the
benchmark individual for all offers j. The benchmark individual’s subjective proba-bility that an offers of 0 CP will be accepted is 12.2%. This probaproba-bility increase up to 58.0% for offers of 550 CP, and then decreases for higher offers. The low subjective ac-ceptance probabilities for the low offers makes these alternatives unattractive, even to an expected payoff maximizer. Hence, despite having preferences which are relatively egoistic compared to those of other subgroups of the population, the benchmark pro-poser now has a predicted choice distribution exhibiting a high level of equity, with offers of 450 CP occurring with a probability of 49.1%. On the other hand, the bench-mark probability of making offers of 0 CP falls from 36.3% in the dictator game to 2.1% in the ultimatum game.
— Table 8 about here —
Overall, the marginal effects resemble those observed in the dictator game: older and less educated individuals more often make payoff equalizing offers of either 450 or
550 CP. However, the magnitudes of the marginal effects are smaller in the ultimatum game than in the dictator game, and characterized by different patterns of substitution. While the probability mass going to 450 and 550 CP is mostly taken from offers of 0 CP in the dictator game, it is taken from offers of 300 CP in the ultimatum game, as the benchmark probability of making offers of 0 CP is practically zero.
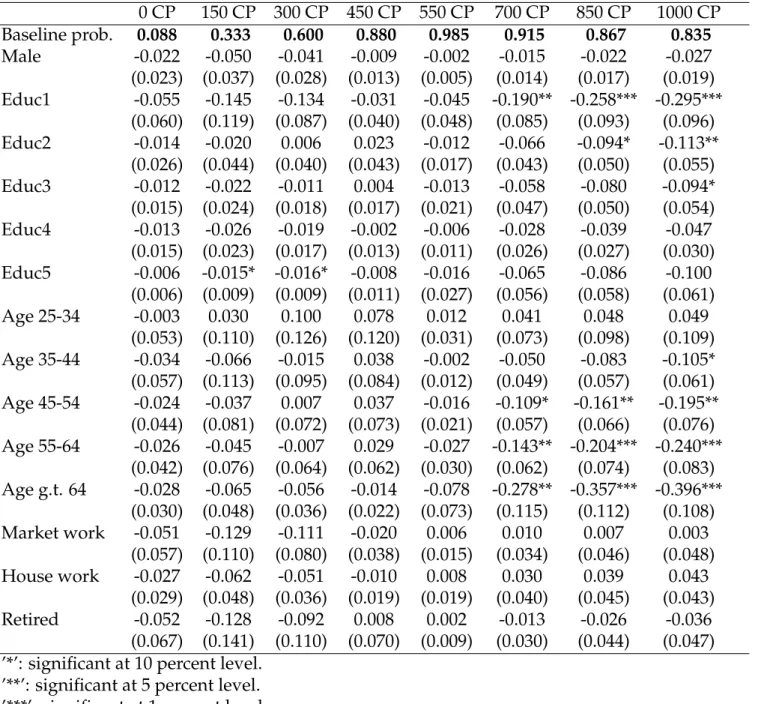
Table 9 presents the estimated marginal effects for responders in the ultimatum game, for each of the eight decisions of responders. Our benchmark has probabili-ties of above 80 percent of accepting offers of 450 CP and above, showing that for the benchmark responders, threshold behavior is more prevalent than plateau behavior. In line with higher aversion to inequity to other’s disadvantage, individuals with low levels of education, and those of 45 years and older have a lower probability than the benchmark of accepting offers that put them in a more advantageous position. For example, low educated individuals have a 29.5%-points lower probability of accepting all of the 1000 CP, and those older than 64 years of age have a 39.6%-points lower prob-ability of accepting that same offer. These differences generate plateau behavior of the low educated and the elderly.
— Table 9 about here —
Simulations
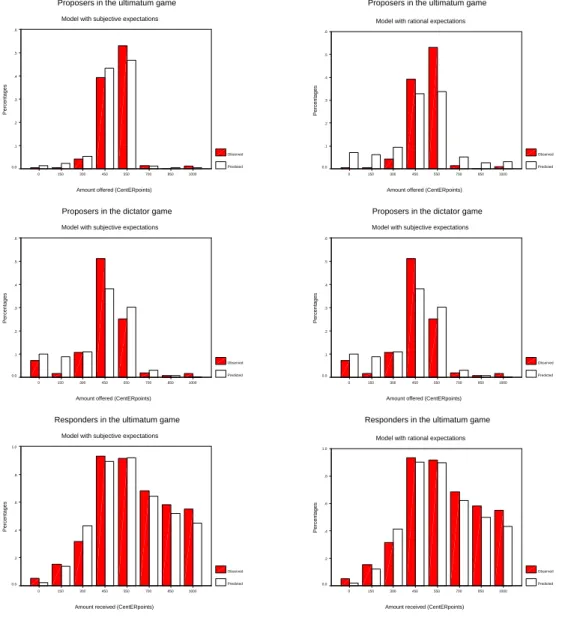
In this section, we perform simulations to assess the goodness of fit of each model, en-abling us to compare the predictive power of the model which uses data on subjective probabilities with the model estimated under the assumption that proposers in the ul-timatum game have rational expectations. Figure 4 presents the observed (dark bars) and predicted (light bars) choice distributions for the three groups of players in our ex-periment. The left column presents the observed and predicted distributions based on the model using subjective probabilities of proposers in the ultimatum game while the right column presents the corresponding predictions for the model with rational ex-pectations. All predicted distributions were computed by averaging predicted choice
probabilities over all players in the relevant roles. — Figure 4 about here —
We find that the model which incorporates the subjective data successfully predicts the important probability mass of proposals around the equal split, with some over-prediction in the ultimatum game of proposals in the range between 0 and 300 CP. The fit is particularly good for the acceptance rates of responders, where the model captures the decline in acceptance rates for proposals over 550 CP. The rational expectations model provides a worse fit of the choice distribution of proposers in the ultimatum game. In particular, it predicts a more dispersed choice distribution, with more mass on low and high offers. As a result, it overpredicts the number of offers between 0 and 300 CP, underpredicts offers of 450 CP, underpredicts more offers of 550 CP, and clearly overpredicts offers in excess of 550 CP. Both models provide a similar fit to the choice distributions of proposers in the dictator game and to the acceptance probabilities of responders in the ultimatum game.
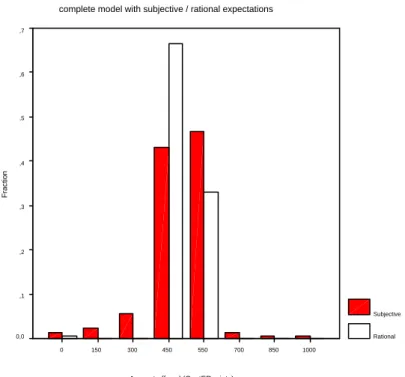
Figure 5 presents two predicted offer distributions computed using the estimates of the preference parameters of the model with subjective expectations data. The dark bars present the predicted offer distribution of this model. The light bars represent the predicted distribution after replacing the subjective acceptance rates of all proposers by ”rational expectations,” i.e., by the observed acceptance frequencies of responders in the data, taken from the bottom of Table 2. The predicted offer distribution un-der rational expectations is more concentrated around 450 CP and 550 CP, reflecting the fact that observed acceptance rates of offers of 450 CP and 550 CP are above 90%, while observed acceptance rates of offers below and above those amounts are sub-stantially lower than the average subjective acceptance probabilities. The differences between the two distributions are substantial, emphasizing that deviations between subjective probabilities and rational expectations based probabilities have important consequences for decision making.
Finally, we present the simulated choice distributions according to the complete model with subjective expectations for four subgroups of the population: men below 25 years of age with a university degree and not working (“students”, group 1), men below 25 years of age with a primary degree and not working (group 2), men above 64 years of age with a university degree and not working (group 3), and men above 64 years of age with a primary degree and not working (group 4). Results for proposers in the ultimatum game, proposers in the dictator game, and responders in the ultimatum game are presented in Figures 6, 7, and 8, respectively. In all figures, passing from the left to the right reduces education, while passing from the top to the bottom increases age. For proposers in the ultimatum and dictator games, we see that the predicted distribution in the subgroup which proxies the student population is concentrated to-wards offers between 0 CP and 450 CP. In both games, individuals who are either older or less educated have a much greater tendency of making offers of 450 CP or 550 CP, and a lower tendency of making offers below 450 CP. The difference increases when education as well as age are different from that of the student group (lower right hand side graph), with the likelihood of offers between 0 CP and 300 CP practically vanish-ing. The shifts in the dictator game are larger than in the ultimatum game, in line with the differences between the marginal effects in Tables 8 and 7.
In Figure 8 with the acceptance probabilities of responders in the ultimatum game, all four subgroups have low probabilities of accepting offers of 0 CP and 150 CP, and probabilities of accepting offers of 450 CP and 550 CP which exceed 80%. Consistent with increasing aversion from inequity to the other player’s disadvantage, the four graphs differ in terms of the acceptance probabilities of offers above 550 CP. While these remain above 80% in the student subgroup, they are much smaller for the less educated (group 2) and the older subgroups (group 3), with the probability of accept-ing all of the proposers endowment (1000 CP) fallaccept-ing close to 40%. Again, the decrease in the acceptance probabilities of high offers is stronger when combining the increase of age with the decrease of the education level, leading to group 4’s quite high aversion for other’s disadvantage and low acceptance rates for high offers.
— Figures 6, 7, and 8 about here —
6 Conclusion
The ultimatum game and the dictator game are well-known tools in experimental eco-nomics for eliciting preferences for inequity aversion. The current paper improves on the empirical content of existing studies in several ways. First, a large representative sample of the (Dutch) population is used rather than the convenience sample of stu-dents used in most other studies. The size of the sample and its heterogeneity in terms of education level, age, gender, and other characteristics allow for an analysis of prefer-ence heterogeneity. Second, we randomly assign respondents to either the ultimatum or the dictator game, and to the role of proposer or responder, and use the random nature of this assignment to better identify the distribution of preferences (or ”types”) in the population. Third, we use direct questions on respondents’ subjective probabili-ties that offers will be accepted or rejected to model respondents’ beliefs and to test the assumption of rational expectations.
These features of the data are combined to formulate a structural micro-econometric model of preferences and beliefs, allowing for heterogeneity through observed and unobserved variables, and allowing for an arbitrary correlation structure of the unob-served heterogeneity components. The model is estimated combining all the available data and the findings are compared with a model that imposes that, for all amounts that can be proposed, each agent’s beliefs are equal to the observed aggregate accep-tance rates of responders (“rational expectations”).
The main findings are as follows. First, the model is found to fit well the observed choices in our experiment. The model which uses subjective expectations fits the data better than a model which maintains that proposers in the ultimatum game have ra-tional expectations, suggesting that collecting subjective expectations data may prove to be helpful in predicting behavior in many more experiments of proposal and re-sponse similar to the ones presented in this paper. The beliefs of proposers nevertheless
showed a surprising amount of foresight in our heterogeneous population as they cor-rectly forecasted the decline in acceptance rates for offers in excess of an equal split of the surplus. While the expected magnitude of the acceptance rates of these proposers differed substantially from the observed rates, they nevertheless correctly anticipated the presence of equity aversion in the responder population.
Second, there is substantial heterogeneity in preferences as well as beliefs. Inequity aversion rises with age and falls with education level, something that generates impor-tant variation in the choice distribution of dictators and responders in the ultimatum game. In particular, young, highly educated, and unemployed subjects make up the subgroup of the population whose decisions in the dictator games and responders in the ultimatum game are the most egoistic. Hence, extending the subject pool from students only to a more representative population not only increases the dispersion in predicted levels of inequity aversion, but also generates a distribution with much greater levels of inequity aversion. Indeed, the predicted distribution of aversion to own and other’s disadvantage in our population is more dispersed than that which is usually derived from laboratory experiments (e.g. Fehr and Schmidt, 1999; Huck, M ¨uller, and Normann, 2001). All this suggests that the choice of the subject pool may play an important role when making inferences about the distribution of preferences in the population.
Third, we found that variations in preferences have a much greater impact on the choice distribution in the dictator game than on the choice distribution in the ultima-tum game. This is because in the latter, acceptance probabilities of low and high offers are much lower than acceptance probabilities of payoff equalizing offers, making the latter choices more attractive for a broader range of preferences.
Fourth, unobserved heterogeneity plays an important role for preferences as well as beliefs. The correlations between the heterogeneity terms indicate that the people who are more averse towards inequity at the cost of themselves are typically also more averse to inequity at the cost of the other player, and also tend to be relatively optimistic about the chances that responders will accept a given proposal.
The fact that there is substantial (unobserved) heterogeneity of beliefs across the population already provides evidence that not everyone can have rational expecta-tions, since every proposer is matched to a completely anonymous and random re-sponder. Moreover, we find that even the median proposer does not have rational ex-pectations, and underestimates the probability that amounts sent exceeding the equal split will be accepted by the responder. The deviations from rational expectations lead to a substantial dispersion in the proposed amounts.
Future research can address various limitations. One is extending the number of “types” of players with different preferences. We already allow for a continuum of types with two inequity aversion parameters varying from zero to infinity, but exten-sions could, for example, allow for maxmin preferences (e.g., Charness and Rabin, 2002), which will typically require additional experimental data. Another important extension is to consider the effect of intentions (see e.g., Blount, 1995) which could be analyzed by comparing the current data with similar data where the proposer is re-placed by a computer generating the amount offered, taking away the argument that different offers are informative of the intentions of proposers.
Mean Description Male 0.550 1 if man, 0 if woman Age < 25 0.032 1 if below 25 years of age, 0 otherwise Age 25-34 0.174 1 if between 25 and 34 years of age, 0 otherwise Age 35-44 0.229 1 if between 35 and 44 years of age, 0 otherwise Age 45-54 0.252 1 if between 45 and 54 years of age, 0 otherwise Age 55-64 0.158 1 if between 55 and 64 years of age, 0 otherwise Age g.t. 64 0.155 1 if above 64 years of age, 0 otherwise Educ1 0.052 1 if primary education, 0 otherwise Educ2 0.261 1 if vocational training low level, 0 otherwise Educ3 0.202 1 if vocational training intermediate level, 0 otherwise Educ4 0.143 1 if general secondary education, 0 otherwise Educ5 0.235 1 if highest vocational training, 0 otherwise Educ6 0.108 1 if university education, 0 otherwise Market work 0.586 1 if working for pay ,0 otherwise House work 0.125 1 if homemaker ,0 otherwise Retir ed 0.157 1 if retir ed fr om labor for ce, 0 otherwise Other 0.132 1 if other labor for ce status (e.g., student, unemployed), 0 otherwise Note: sample of all 1263 participants in the experiment Table 1: Definitions and sample means of the explanatory variables
0 150 300 450 550 700 850 1000 N Threshold behavior 1 1 1 1 1 1 1 1 17 0 1 1 1 1 1 1 1 28 0 0 1 1 1 1 1 1 30 0 0 0 1 1 1 1 1 89 0 0 0 0 1 1 1 1 12 0 0 0 0 0 0 0 1 1 1 1 1 1 0 0 0 0 1 1 1 1 1 1 0 0 0 1 1 0 0 0 0 0 0 0 1 Plateau behavior 0 0 0 1 1 1 0 0 20 0 0 0 1 0 0 0 0 22 0 0 0 1 1 0 0 0 61 0 0 0 1 1 1 1 0 6 0 0 1 1 1 0 0 0 8 0 0 0 0 1 0 0 0 7 0 0 1 1 0 0 0 0 2 0 1 1 1 1 1 1 0 4 0 0 1 1 1 1 0 0 11 0 0 0 0 1 1 0 0 1 0 0 0 0 0 1 0 0 1 0 1 1 1 0 0 0 0 1 0 0 1 1 1 1 1 0 1 Chainsaw behavior 0 1 0 1 1 1 1 1 1 1 0 0 0 1 1 1 1 1 1 0 1 1 0 1 0 0 1 0 1 0 1 1 1 0 0 1 1 1 0 1 1 1 0 0 1 1 0 0 1 1 1 1 1 1 0 0 0 1 1 0 0 1 1 0 0 0 0 1 0 0 1 1 0 1 1 1 1 1 0 1 1 1 0 0 0 1 0 0 0 1
Aggregate acceptance rates
0.05 0.15 0.32 0.93 0.91 0.68 0.58 0.55
Notes: Sample of 355 responders in the ultimatum game. Columns: amounts that can be offered (strategy method). 1: accept offer; 0: reject offer; N: number of observations.