Behaviour of tire shred – sand mixtures
Jorge G. Zornberg, Alexandre R. Cabral, and Chardphoom ViratjandrAbstract
Tire shreds and tire shred-soil mixtures can be used as alternative backfill material in many geotechnical applications. The reuse of tire shreds may not only address growing environmental and economic concerns, but it may also help solving geotechnical problems associated with low soil shear strength. In this study, an experimental testing program was undertaken using a large-scale triaxial apparatus with the goal of evaluating the optimum dosage and aspect ratio of tire shreds within granular fills. The effects on shear strength of varying confining pressure and sand matrix relative density were also evaluated. The tire shred content and tire shred aspect ratio were found to influence the stress-strain and volumetric strain behaviour of the mixture. The axial strain at failure was found to increase with increasing tire shred content. Except for specimens of pure tire shreds and with comparatively high tire shred content, the test results showed a dilatant behaviour and a well-defined peak shear strength. The optimum tire shred content (i.e., the one leading to the maximum shear strength) was approximately 35%. For a given tire shred content, increasing tire shred aspect ratio led to increasing overall shear strength, at least for the range of tire shred aspect ratios considered in this study. The shear strength improvement induced by tire shred inclusions was found to be sensitive to the applied confining pressure, with larger shear strength gains obtained under comparatively low confinement.
Introduction
Waste tire stockpiles have reached alarming volumes in many industrialized countries, creating acute need for identifying engineering alternatives for the beneficial reuse of discarded tires. Albeit classified as waste material, tire shreds have indeed unique properties for many geotechnical and geoenvironmental applications. For example, properties of waste tires such as durability, strength, resiliency, and high frictional resistance are of significant value for the design of highway embankments. The mixture of tire shreds with soil for embankment construction may not only provide alternative means of reusing tires to address economic and environmental concerns, but it may also help solving geotechnical problems associated with low soil shear strength. If waste tires are reused as a construction material rather than disposed or burnt (probably the leading method of reuse), their unique properties can once again be beneficial in a sustainable materials stream. Waste tires could be effectively used as substitute to virgin construction materials (e.g., geosynthetics) made from non-renewable resources.
The use of pure tire shreds and whole tires (i.e., without mixing with soil) has been evaluated as a potential material for highway construction (Garga and O’Shaughnessy 2000; O’Shaughnessy and Garga 2000a, 2000b; Bosscher et al. 1997; Hoppe 1994). Additional examples of reuse of waste tires include their use as lightweight embankment fills over soft or unstable ground (Humphrey et al. 1998), pavement frost barriers (Doré et al. 1995), retaining wall backfills (Wu et al. 1994), non-structural sound-barrier fills, and edge drains. However, the use of pure tire shreds in civil engineering applications experienced a significant setback in the 1990s, when at least three tire fills in the US reportedly developed self-heating (exothermic) reactions (Humphrey 1996; Gacke et al. 1997). Even though the behaviour of pure tire shreds is also characterized in this investigation, concerns have also been raised regarding their use for
permanent infrastructure because of their high compressibility, which may compromise the serviceability of geotechnical structures.
The application proposed herein is not the use of pure tire shreds, but the use tire shred-soil composites as backfill material for highway embankments. To the best knowledge of the authors, no exothermic reactions have been reported for backfills of tire shred-soil composites. In addition, the use of tire shred-soil composites would potentially address technical problems associated with low shear strength of backfill material in highway projects. Indeed, tire shreds within the soil mass may induce reinforcement mechanisms that make them a particularly suitable material for geotechnical infrastructure.
The objective of this study is to characterize the mechanical behaviour of tire shred-soil composites. Particular emphasis is placed on the evaluation of the optimum dosage and geometry (quantified by the aspect ratio) of tire shreds within the fill. In addition, the influence of confining pressure and sand matrix unit weight on the mechanical behaviour is evaluated. The experimental program involved shear strength testing of composite specimens prepared with tire shred contents ranging from 100% (i.e., pure tire shreds) to 0% (i.e., pure soil). Due to the comparatively large size of tire shreds, the testing program was conducted using large-scale triaxial specimens in order to minimize potential boundary effects. While past investigations have demonstrated the feasibility of using tire shreds to improve the mechanical properties of fills, this study seeks optimizing the quantity and shape of tire shreds to be used for enhanced embankment performance.
Background
The use of inclusions (or reinforcements) to improve the mechanical properties of earthen structures dates to ancient times. However, it is only within the last three decades that analytical
and experimental studies have led to current soil reinforcement techniques (e.g., Zornberg et al. 1998, Elias et al. 2001, Bathurst et al. 2001). Traditional soil reinforcing techniques involve use of continuous geosynthetic inclusions (e.g., geogrids, geotextiles) oriented in a preferred direction to enhance the stability of the soil mass. Instead, the focus of this study is on randomly distributed inclusions, the effect of which is expected to lead to improved mechanical behaviour of the composite material. Specifically, this study seeks to establish the basis for a ‘green reinforced soil design’ that promotes the use of reinforcement inclusions made from tire shreds instead of non-renewable polymeric materials.
Significant advances have been made regarding the use of pure tire shreds or whole tires as fill material in transportation infrastructures (e.g., Humphrey and Manion 1992; Hoppe 1994; Wu et al. 1994; Bosscher et al. 1997; GeoSyntec Consultants 1997a, 1997b; Garga and O’Shaughnessy 2000; O’Shaughnessy and Garga 2000a, 2000b). Pure tire shreds used as backfill material possess high hydraulic conductivity, high thermal insulation, and are easy to place and compact. However, concerns have been raised regarding the use of pure tire shred fills for permanent infrastructure. A potential disadvantage is the high compressibility of tire shreds when compared to that of soils, which may compromise the serviceability of the geotechnical structures (Humphrey 1996; Hoppe 1994). An additional concern regarding pure tire shreds used as fill material is their potential for exothermic reactions, which has led to spontaneous ignition in several structures (e.g., Humphrey 1996; Gacke et al. 1997). Use of whole tires (Garga and O’Shaughnessy 2000) and design guidelines that minimize internal heating of tire shreds (Whetten et al. 1997) have been proposed to address this concern. However, the use of tire shred-sand mixtures is yet an additional relevant alternative that would avoid exothermic reactions. The behaviour of micro-reinforcement and, in particular, fibre-reinforced soil provides insight into the behaviour of randomly distributed tire shred inclusions within a soil matrix. Gray
and Ohashi (1983) performed direct shear tests on sand reinforced with both natural and synthetic fibres. Their results showed that fibre reinforcement increase the peak shear strength and limit the post-peak shear strength loss. Gray and Al-Refeai (1986) performed triaxial compression tests on dry sand reinforced using randomly distributed discrete fibres and oriented continuous fabric layers. They found that the peak shear strength increases with increasing fibre content. Zornberg (2002) proposed a discrete methodology for the design of fibre-reinforced soil slopes that treats separately the contributions of soil and fibres. The proposed framework accurately predicted the shear strength of fibre reinforcement for a variety of soil types, fibre aspect ratios, and fibre contents.
Studies involving the use of tire shred-soil mixtures include Ahmed (1993), who characterized the shear strength of mixtures using large-scale triaxial specimens. The results showed that mixtures with less than 38% (by weight) of tire shreds have good compaction characteristics, low unit weight, adequate compressibility, high shear strength, and good drainage characteristics. Benson and Khire (1994) evaluated the shear strength of mixtures of sand and HDPE strips with different length to width ratios (aspect ratios) using large-scale direct shear tests. They concluded that HDPE strips increased the peak shear strength and the residual shear strength of the composite material. Edil and Bosscher (1994) characterized tire shred-soil mixtures with varying tire shred contents using large-scale direct shear tests. They concluded that tire shred inclusions improve the shear strength of tire shred-sand mixtures, especially for low and intermediate confining pressures. Lee et al. (1999) performed triaxial tests using pure tire shreds and tire shred-sand mixtures to investigate the effect of varying confining pressures. Tire shreds without steel belts were used in the testing program. Pure tire shred specimens showed an approximately linear stress-strain response for a wide range of confining pressures while tire shred-sand specimens showed a response intermediate between those of pure sand and pure tire
shreds. Foose et al. (1996) performed large-scale direct shear tests on tire shred-sand mixtures. They showed that shear strength was significantly affected by the normal stress, tire shred content, and sand matrix unit weight.
Although past studies have shown evidence of the beneficial effect of tire shred inclusions when mixed with soil, quantification of such improvement, assessment of the effect of soil density, and optimization of tire shred content deserves further study. In addition, despite attempts to sieve the tire shreds prior to testing, the effects of tire shred size and aspect ratio have not been quantified. Accordingly, current understanding on the behaviour of tire shred-soil mixtures is based mostly on testing programs conducted using tire shreds of uncontrolled sizes and shapes. This study provides a systematic evaluation of the effect of tire shred content, tire shred aspect ratio, and sand density on the shear strength of mixtures.
Materials and methods
DefinitionsA gravimetric definition of tire shred content (χ) is used in this investigation, as this is the one typically used in construction specifications. Accordingly, the tire shred content is defined as: [1] s ts ts W W W = + χ
where Wts is the weight of tire shreds and Ws is the dry weight of the soil. Also, the aspect ratio η of individual tire shreds is defined as:
[2] ts ts w l = η
Materials
The laboratory program performed as part of this investigation was conducted to evaluate the influence of tire shred content (χ), aspect ratio (η), and sand matrix relative density (Dr) on
the shear strength of sand-tire shred mixtures. Triaxial specimens were prepared using dry Monterey No. 30 sand and tire shreds without steel belts. Specimens of pure sand (χ = 0%), pure tire shreds (χ = 100%), and mixtures of these two materials (χ = 5, 10, 15, 30, 38 and 60%) were tested as part of this investigation. The specimens were compacted in order to achieve target sand matrix unit weight values that correspond to relative densities of 55% and 75% in pure sand specimens.
Monterey No. 30 sand is a clean, uniformly graded sand that classifies as SP according to the Unified Soil Classification System (Zornberg et al. 1998). The sand particles are rounded to subrounded, consisting predominantly of quartz with smaller amounts of feldspars and other minerals. The average particle size of the sand is 0.4 mm, the coefficient of uniformity is 1.3, the coefficient of curvature is about 1.1, and the specific gravity is 2.66. The maximum and minimum void ratios of the sand are 0.83 and 0.53, respectively. The properties of Monterey No. 30 sand particles are essentially constant over a wide range of stresses, and were reported to undergo negligible breakage when tested under moderate stress levels. The unit weight values for the Monterey No. 30 sand that correspond to the target relative densities of 55 and 75% are 15.64 and 16.21 kN/m3, respectively.
The tire shreds were cut into controlled rectangular sizes to achieve widths (dimension in the smaller direction) of 12.7 and 25.4 mm. The width of tire shreds is used in this study to quantify the size of the inclusions for a given aspect ratio. The aspect ratios of the tire shreds used in the
testing program were 1, 2, 4 and 8 (Fig. 1). The waste tires were provided by Front Range Tire Inc., a shredding facility located in Sedalia, Colorado. Use of tire shreds without steel belts was considered in the testing program in order to: 1) avoid punching the membranes of triaxial specimens during testing; and 2) facilitate cutting the shreds into controlled sizes and aspect ratios. Although the tensile strength of tire shreds without steel belts is different than that of tire shreds with steel belts, both types of tire shreds are expected to have the same soil-shred interface shear strength (if they are made of the same rubber). As will be discussed later, failure during triaxial testing occurred by pullout of the tire shreds rather than by tensile breakage (at least for the confining pressures used in the present study). Consequently, the effect of steel belts on the shear strength behaviour of the mixture is expected to be negligible.
Because of variability in the wearing of disposed whole tires, the thickness of tire shreds used in this study is not uniform. The thickness of tire shreds, measured following procedures described by Zornberg and Viratjandr (2001), ranges from 2.16 to 3.23 mm. The effect of tire shred thickness on the shear strength of the mixture is expected to be negligible since failure of tire shred-sand specimens is by pullout (not affected significantly by tire shred thickness) rather than by tensile breakage of the tire shreds.
The specific gravity of the tire shreds was determined in accordance with ASTM Standard Test Method for Specific Gravity and Absorption of Coarse Aggregate (ASTM 1993), except that specimens were air dried rather than oven dried in the beginning of the test. The specific gravity obtained for tire shreds is 1.15, which compares well to results reported by Bosscher et al. (1997) for tire shreds without steel belts. Water absorption obtained after soaking during 5 days is 2.11%, which is within the typical range of 2 to 4.3% reported by Humphrey (1997). The bulk dry unit weight of pure tire shred specimens prepared under 7 kPa of vacuum is approximately 6.30 kN/m3, which is considered representative of the bulk unit weight under
unconfined conditions. Reported unit weight values under unconfined conditions range from 5.97 to 6.76 kN/m3 (Edil and Bosscher 1994), which is in good agreement with results obtained in this study. The void ratio of unconfined specimens is approximately 0.79 and decreases with increasing confining pressure. For the three confining pressures used during the triaxial testing program (σ3 = 48.3, 103.5, and 207 kPa), the unit weight values of pure tire shreds were 7.26,
8.56, and 9.00 kN/m3, respectively.
Equipment
A large-scale triaxial cell was used in this investigation in order to test specimens with tire shreds of up to 102 mm (4’’). Triaxial specimens were prepared with a diameter of 153 mm (6”) and a height of 305 mm (12”) and tested in a Wykeham Farrance triaxial load frame. The potential boundary effects are a limitation for tests conducted using large size tire shreds. An automatic data acquisition system was used to collect load and displacement information at a typical frequency of one reading per second. Axial strains were measured using linear variable differential transformers (LVDTs) with a displacement range of 125 mm. Axial load was monitored using a load cell with a capacity of 44.5 kN. A pressure transducer was used to measure cell pressures applied during testing. In order to measure volume changes of the dry specimens during testing, a differential pressure transducer with a differential pressure range of 3.5 kPa was connected to the cell pressure line. Changes in water level in a burette were detected by the differential pressure transducer and then correlated to volume changes in the specimens. The system was calibrated to account for volume corrections such as the volume of the loading rod (Zornberg and Viratjandr 2001). Because of the comparatively large size of the specimens,
the pressure transducer and differential pressure transducer were installed at approximately mid-height of the specimens.
Specimen preparation
Pure tire shred specimens were compacted by tamping using a steel rod, while pure sand specimens were compacted by vibrating on a vibrating table until reaching the desired sand matrix unit weight. Specifically, the target sand matrix unit weight was achieved by quantifying the weight of sand to be placed within a volume equal to the specimen volume minus the volume of tire shreds. The target sand matrix unit weight values used in this study (i.e., 15.64 and 16.21 kN/m3) are described herein using the relative density to which these unit weight values correspond in pure sand specimens (i.e., Dr = 55 and 75% respectively). Tire shred-sand
specimens were prepared using two different procedures depending on the tire shred content of the mixture. No evidence of segregation was observed for comparatively low tire shred contents. Consequently, tire shred-sand specimens with comparatively low tire shred content (up to 30%) were prepared by mixing the sand and tire shreds before placing them into a mould and subsequently using the same vibratory methods used to prepare pure sand specimens. Compaction was completed in four 75-mm layers. On the other hand, tire shred-sand specimens with tire shred contents over 30% were prepared by placing the tire shreds randomly and compacting them following the same procedure used to prepare pure tire shred specimens. Sand was subsequently pluviated while using the same vibrating procedures used to prepare pure sand specimens. Compaction was also completed in four 75-mm layers. The specimen preparation procedure used in this study was implemented to facilitate a random distribution of the tire shreds within the specimen and to avoid sand segregation. The systematic procedure facilitates
comparison of the shear strength results from different test series. However, it should be noted that interpretation of the test results assumes homogeneity of the specimens. Exhumation of tire shred-sand samples also confirmed the homogeneous distribution of tire shreds within the specimen. The procedure for specimen preparation is similar to that reported by Foose et al. (1996), who also used pluviation techniques for specimen preparation. Zornberg and Viratjandr (2001) provide additional details on the specimen preparation procedures.
Scope of the testing program
A total of 15 series of consolidated drained (CD) triaxial compression tests were performed as part of this investigation. The tests were conducted in general accordance with ASTM D 4767 (ASTM 1995). The need for membrane correction was evaluated because axial strain levels as high as 15% were reached in some tests. The Young’s modulus of the Latex membrane used in the experimental testing program was determined to be 984 kPa. For an axial strain of 15%, the membrane correction estimated using the procedure indicated in ASTM D 4767 is approximately 3 kPa. According to the standard, the deviatoric stress should be corrected for the effect of the membrane if the error in deviatoric stress exceeds 5%. Since the calculated correction is below 5% of the deviatoric stress at failure, the membrane correction was not used in the interpretation of test results.
The stress condition used in this study to define failure was also established in accordance with ASTM D 4767 (ASTM 1995). Accordingly, failure was taken to correspond to the maximum deviatoric stress attained or the deviatoric stress at 15% axial strain, whichever was obtained first during the performance of a test. It should be noted that the shear strength defined
for specimens that do not show a well-defined peak deviatoric stress is sensitive to the strain level used to define failure.
Each series included three tests conducted under the confining pressures (σ3) of 48.3, 103.5 and 207 kPa. The individual specimens in each series were prepared with the same sand matrix relative density (Dr), tire shred content (χ), tire shred size, and tire shred aspect ratio (η). The
triaxial tests were performed using a strain rate of approximately 0.5 %/minute. Table 1 presents a summary of the main characteristics of the test series conducted in this investigation (sand matrix relative density, tire shred content, tire shred size, and aspect ratio). The testing program implemented as part of this study allowed evaluation of the effect on shear strength of the following parameters:
1) Tire shred content: seven different tire shred content values were adopted (χ = 0, 5, 10, 15, 20, 30, 38.3, and 60%);
2) tire shred aspect ratio: four different values were selected (η = 1, 2, 4, and 8); and
3) sand matrix relative density: the same sand placed at two different densities was used (Dr =
55 and 75%).
Data compiled as part of this investigation led to characterization of the deviatoric stress-strain, volumetric stress-strain, and shear strength behaviour of specimens prepared using pure tire shreds, Monterey No. 30 sand, and tire shred-sand mixtures. Special focus is placed on the evaluation of the shear strength envelopes. For each test series, two sets of shear strength parameters were estimated in this investigation:
1) Conventional Mohr-Coulomb shear strength parameters (cohesion intercept, c, and friction angle, φ); and
2) a single shear strength parameter, the equivalent friction angle (φeq), which was obtained by
fitting experimental shear strength data with a straight line through the origin (i.e., forcing c = 0).
The use of equivalent friction angles allows a straightforward comparison of the effect on shear strength of variables such as tire shred content, tire shred aspect ratio, and sand matrix relative density. A detailed discussion regarding the effect on shear strength parameters of the aforementioned variables is provided in the following section. A summary of the conventional Mohr-Coulomb shear strength parameters and of the equivalent friction angles is provided in Table 1. Since the testing program was conducted using dry specimens, the shear strength parameters reported in this investigation correspond to effective shear strength parameters. Series 1 and 2 were conducted using pure sand specimens, Series 6 was conducted using pure tire shred specimens, and the remaining series shown in the table were conducted using tire shred-sand specimens. Correlation factors (R2) over 0.98 were obtained when determining the shear strength
envelopes through the origin. This indicates that envelopes defined by a single parameter are still appropriate for the purpose of comparison of the shear strength obtained using different tire shred-sand mixtures.
Results and discussions
Deviatoric stress-strain and volumetric strain behaviour
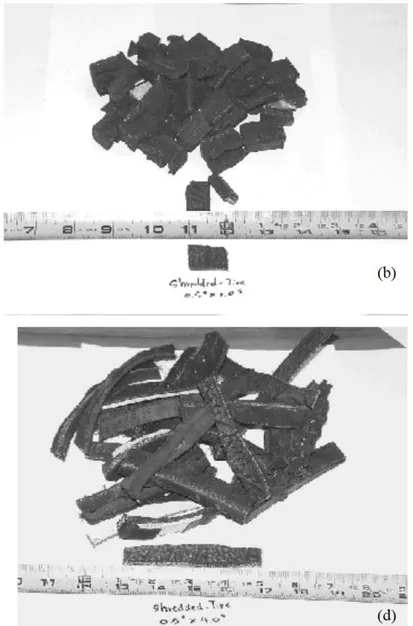
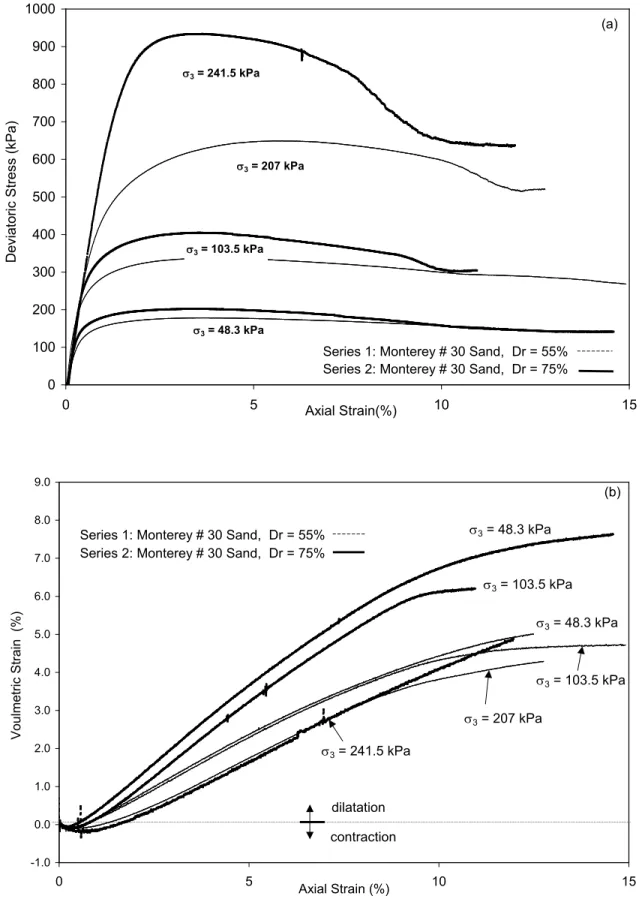
The deviatoric stress-strain and volumetric strain behaviour of pure sand, pure tire shred, and sand-tire shred mixtures are presented in Figs. 2-7. Fig. 2 presents the stress-strain and volumetric strain behaviour of pure sand specimens prepared at two different relative densities (Dr = 55 and 75%). Fig. 3 shows the stress-strain and volumetric change behaviour of pure tire
shred specimens. The stress-strain and volumetric strain behaviour of tire shred-sand specimens are presented by grouping series having similar characteristics. In this way, Fig. 4 presents results of representative tests conducted using specimens prepared with tire shred contents below 30%. Specifically, Fig. 4a and 4b present the results of Series 3 (Dr = 55%), which are also
representative of the behaviour of Series 13 and 14, whereas the results in Fig. 4c and 4d present the results of Series 10 (Dr = 75%), which are also representative of the behaviour of Series 15
and 7. Fig. 5 shows the results of tests conducted on specimens prepared with the same tire shred content (χ = 30%) and sand matrix relative density (Dr = 55%), but with varying aspect ratio
(Series 4, 9, and 11). The behaviour of Series 8 is not shown in this figure for clarity. Fig. 6 shows the results of tests conducted on specimens prepared with a tire shred content above 30% and a sand matrix relative density Dr = 55% (Series 5 and 12). Finally, Fig. 7 shows the
stress-strain and volumetric stress-strain behaviour of specimens prepared with the same tire shred content (χ = 30%) and the same tire shred aspect ratio (η = 4), but with varying sand matrix relative densities (Series 4 and 7).
The deviatoric stress-strain and volumetric strain behaviour observed on pure Monterey No. 30 sand specimens shows a dilatant behaviour when compacted to relative densities ranging from 55% to 75% (Fig. 2). Accordingly, Monterey No. 30 sand at these relative density values
behaves as medium to dense sand. On the other hand, the stress-strain and volumetric strain behaviour observed on pure tire shred specimens shows an approximately linear deviatoric stress-strain behaviour for the confining pressures used in this investigation (Fig. 3). The volumetric strain behaviour is fully contractive and also approximately linear for the different confining pressures. Such linear behaviour of tire shred specimens is consistent with results obtained in previous investigations (Lee et al. 1999). Regarding the deviatoric stress-strain behaviour of tire shred-sand mixtures, the experimental results show that, with the exception of specimens prepared with relatively a high tire shred content (e.g., Series 5 with χ = 60%, shown in Fig. 6), tire shred-sand specimens show a dilatant behaviour and a reasonably well-defined peak shear strength. As mentioned, and following ASTM D 4767, the shear strength was defined as the shear stress at 15% axial strain when a peak shear strength value could not be clearly identified. Visual observation of tire shreds retrieved after testing showed no evidence of damage or tears. Accordingly, the tensile forces induced during testing within the tire shreds mobilized the pullout resistance of tire shred-sand interfaces, but did not reach the tensile strength of individual tire shreds.
Inspection of the stress-strain responses shown in Figs. 2-7 indicates that the influence of sand matrix relative density is highly dependent on the tire shred content in the mixture. For example, the shear strength of specimens prepared with pure sand (i.e. with a with χ of 0%) at a relative density of 55% (Series 1 in Fig. 2) is expectedly lower than the shear strength of specimens prepared with pure sand at a relative density of 75% (Series 2 in Fig. 2). As the tire shred content increases but remains below 30%, the shear strength is still influenced by the sand matrix relative density, but not as significantly as in the case of pure sands. This can be inferred, for example, from the responses of Series 3 (Dr = 55%) and Series 10 (Dr = 75%) shown in Fig.
(up to 10%) is considerably higher than the axial strain at peak strength in pure sand specimens. Also, the post-peak shear strength loss in the tests shown in Fig. 4 is smaller than the post-peak shear strength loss in pure sand specimens. Finally, the peak shear strength obtained with specimens prepared at a tire shred content of 30% is approximately the same for relative density values of 55% (Series 4 in Fig. 7) and 75% (Series 7 in Fig. 7), all other variables maintained constant. Indeed, the entire stress-strain responses of Series 4 and 7 are very similar. The axial strain at peak shear strength is even higher (up to 15%) in series with a tire shred content of 30% than in series with lower tire shred content values.
Specimens with high tire shred contents could not be prepared at a sand matrix relative density of 75% using either vibratory or pluviation methods. Consequently, the effect of sand matrix relative density on the behaviour of specimens with high tire shred contents cannot be compared directly. Nonetheless, the behaviour of specimens prepared with comparatively high tire shred content (e.g., Series 5 with χ = 60%, shown in Fig. 6), show a significantly different response than those prepared with lower tire shred contents. Specifically, different than the dilatant behaviour shown by specimens with lower tire shred content, the volumetric behaviour of specimens in Series 5 is fully contractive and the peak shear strength could not be reached for axial strains of up to 15%. A comparison between the responses of Series 12 (Dr = 55%, χ =
38%, η = 4 in Fig. 6), in which the peak shear strength is not well-defined, and Series 4 (Dr =
55%, χ = 30%, η = 4 in Fig. 7), in which the peak shear strength can still be defined, seems to indicate that the behaviour of tire shred-sand specimens change from sand-like to tire shred-like at a tire shred content of approximately 35%. Analysis of shear strength parameters discussed in the next section supports this observation.
The effect of tire shred aspect ratio on the stress-strain response of tire shred-sand mixtures can be analyzed by comparing the behaviour of Series 9, 8, 4, and 11, which were performed
using the same sand matrix relative density (Dr = 55%) and the same tire shred content (χ =
30%), but varying aspect ratios (η = 1, 2, 4, and 8, respectively). Figure 5 shows some of these responses (not all responses are shown in Fig. 5 for clarity). While boundary effects might affect the results conducted with high tire shred aspect ratios, comparison of the deviatoric stress-strain curves shows that aspect ratio has a negligible effect on the stress-strain response up to axial strain values of approximately 5%. However, the aspect ratio affects the stress-strain response and shear strength magnitude at comparatively high axial strains. The effect of aspect ratio is more significant beyond a certain aspect ratio value (e.g., in the range of η = 4 to η = 8). Although the effect of aspect ratio on the volumetric strain behaviour is negligible under comparatively high confining pressures (e.g., at σ3 = 207 kPa in Fig. 5b), increasing aspect ratios
lead to a less pronounced behaviour under comparatively low confining pressures.
Shear strength behaviour
Figure 8 presents the Mohr-Coulomb shear strength envelopes obtained for pure sand specimens (at relative density values Dr = 55 and 75%) and pure tire shred specimens. As
expected, the peak shear strength of sand increases with increasing relative density and the cohesion intercept is negligible. Indeed, as shown in Fig. 9, an approximately linear correlation can be established between the sand equivalent friction angle and relative density.
The shear strength envelope of pure tire shreds is well characterized by a linear envelope for the range of confining pressures considered in this study (Table 1). The shear strength parameters obtained for pure tire shreds (φ = 21.4° and c = 22.8 kPa) are in good agreement with results reported by previous investigators. Humphrey et al. (1993) reported friction angles for pure tire shred specimens ranging from 19° to 25° and cohesion intercepts ranging from between
4.3 to 11.5 kPa, while Foose et al. (1996) reported friction angles for pure tire shred specimens of approximately 30° and cohesion intercepts of about 3 kPa. Although the cohesion intercept obtained for pure tire shreds is not negligible, a very good correlation factor was obtained when the shear strength envelope was forced through the origin in order to define the equivalent friction angle, φeq. Consequently, the φeq of 26.5° (Table 1) will be used to describe the shear
strength of pure tire shreds in some comparisons made in this investigation.
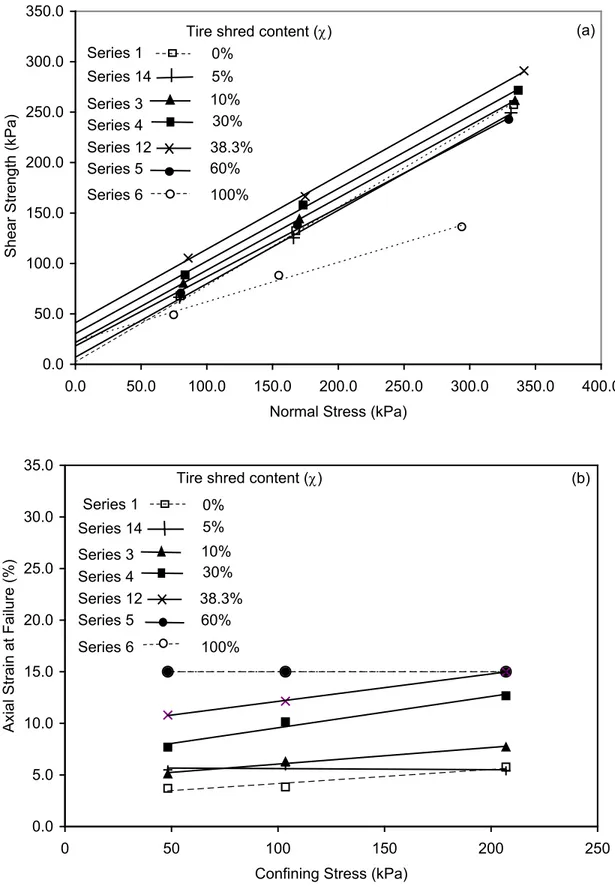
The effect of the tire shred content (χ) on the shear strength of tire shred-mixtures is illustrated in Fig. 10a, which shows the shear strength envelopes of six series with the same aspect ratio (η = 4) and same sand matrix relative density (Dr = 55%), but varying tire shred
contents (χ = 5, 10, 30, 38.3, 60, and 100%). The shear strength envelopes for pure sand (using Dr = 55%) and for pure tire shreds (using η = 4) are also included in Fig. 10a as a reference. The
results indicate that shear strength increases with increasing tire shred content, reaches a maximum for a tire shred content in the vicinity of 35%, and then decreases for tire shred contents beyond this value. Among the series shown in Fig. 10a, Series 12 with χ = 38.3% shows the highest shear strength for the entire range of normal stresses.
These results suggest that soil reinforcement mechanisms take place within the tire shred-soil composite, i.e. tensile forces develop within the tire shreds leading to increased overall shear strength of the mixture. However, shear among individual tire shreds begins to govern the shear strength of the mixture at high tire shred contents, leading to lower overall shear strength values. These strength results indicate that the use of tire shreds within soils should not only be considered as an alternative for beneficial reuse of large quantities of tires, but also as an approach to enhance the mechanical properties of backfill materials.
failure obtained for pure sand (using Dr = 55%) and for pure tire shreds (using η = 4) are also
included in Fig. 10b as a reference. The results show an increasing axial strain at failure with increasing tire shred content and with increasing confining stress. Since no clear peak was obtained for Series 5 and 6 (χ = 60% and 100%, respectively), the axial strain at failure shown in Fig. 10b does not correspond to the axial strain at peak (i.e. failure was defined as the shear stress at 15% axial strain). The axial strains at failure for tire shred-sand specimens are higher than those obtained for pure sand specimens at the same relative.
The strains at failure obtained in tire shred-reinforced specimens are higher than those typically obtained for compacted soils used in earth structures. Consequently, a comparison of the shear stress mobilized at the same axial strain level (e.g. 5%) may provide additional information relevant to the design of earth structures. Figure 11 shows the effect of tire shred content on the shear stress mobilized at an axial strain of 5% (τ5%) for the six series with the same aspect ratio (η = 4) and same sand matrix relative density (Dr = 55%). The mobilized shear
stress values are presented as a function of the normal stress acting along the corresponding potential failure plane to facilitate comparison with the shear strength envelopes presented in Fig. 10a. For comparatively low normal stress values (e.g. below 100 kPa), the effect of tire shred content on τ5% (Fig. 11) shows a similar trend to that observed for the shear strength (Fig. 10a). That is, the mobilized shear stress increases with increasing tire shred content, reaches a maximum for a tire shred content in the vicinity of 35%, and then decreases for tire shred contents beyond this value. Among the series shown in Fig. 11, Series 12 with χ = 38.3% shows the highest mobilized shear stress for comparatively low normal stresses. For higher normal stresses (e.g. 200 kPa), the mobilized shear stress is approximately the same for the different tire shred contents. Consequently, the improvement on shear strength induced by the presence of tires should not be extrapolated as an overall improvement in the material stiffness (i.e. as a
higher mobilized shear stress for strain levels below those corresponding to failure), at least for high normal stresses. This emphasizes the need of conducting deformability analyses, which account for stress-strain parameters, in addition to limit equilibrium analyses, which only account for the shear strength parameters of tire shred-sand mixtures.
The influence of the sand matrix relative density on the shear strength of tire shred-sand mixtures can be evaluated by analysing the results shown in Fig. 12. Comparison of the shear strength envelopes obtained for Series 4 and 7, both with the same tire shred content (χ = 30%) and aspect ratio (η = 4), indicates that an increase in the sand density (from Dr = 55% to 75%)
does not lead to significant increases in the shear strength of tire shred-sand mixtures, at least for tire shred contents in the vicinity of 30%. The shear strength envelope for Series 10 (χ = 20%, η = 4) also aligns well with the results for Series 4 and 7. These results suggest that, for practical purposes, it may not be effective to compact tire shred-soil mixtures to high densities.
Figure 13a shows the effect of aspect ratio on the shear strength envelope of tire shred-sand mixtures by comparing the results obtained for Series 9, 8, 4, and 11, which were performed using the same relative density (Dr = 55%) and the same tire shred content (χ = 30%), but
varying aspect ratios (η = 1, 2, 4, and 8). The results show that increasing aspect ratio leads to increasing shear strength in tire shred-sand mixtures. The shear strength envelopes are approximately parallel, indicating that the increase is mainly related to the cohesive intercept. Figure 13b shows the effect of increasing tire shred aspect ratio on the equivalent friction angle of tire shred-sand mixtures. The most significant shear strength increase occurs when the aspect ratio increases from 4 to 8, which is consistent with the previous discussion regarding the deviatoric stress-strain and volumetric strain behaviour shown in Fig. 5. This trend is consistent with the reported increase in fibre-reinforced shear strength with increasing fibre aspect ratio (Zornberg 2002).
The observed increase in shear strength of tire shred-sand mixtures with increasing tire shred aspect ratio suggests the presence of reinforcement mechanisms. That is, an increasing aspect ratio leads to increasing pullout resistance of individual tire shreds, which in turn leads to increasing tensile forces within the tire shreds, ultimately resulting in higher shear strength of the mixture. Although not observed for the range of aspect ratios used in this experimental study, the shear strength increase with increasing aspect ratio is expected to reach a ceiling for large aspect ratios because of mixing difficulties. Given the important effect of the aspect ratio on the shear strength of tire shred-sand mixtures, it may be economically attractive for companies involved in recycling of waste tires to tailor their shredding operations to produce tire shreds of comparatively large aspect ratios.
The schematic representation shown in Fig. 14 illustrates the composite shear strength (friction angle) of tire shred-sand mixtures for increasing tire shred contents (from 0% to 100%) and constant values of sand matrix relative density and tire shred aspect ratio. According to this representation, the composite shear strength involves the contribution of two mechanisms: (i) internal shear mechanisms developed among individual tire shreds and sand grains, and (ii) reinforcement mechanisms due to the tensile forces induced within the tire shreds. Consistent with shear strength results obtained for pure sand and pure tire shreds, the shear strength of pure sand (χ = 0%) is higher than that of pure tire shreds (χ = 100%). For intermediate tire shred contents, the expected contribution by internal shear mechanisms is the weighted average anticipated based on the pure soil and pure tire shred shear strength (baseline shear strength in Fig. 14). As schematically illustrated in the figure, the contribution of reinforcement mechanisms is expected to lead to composite shear strength values above the baseline shear strength line.
Figure 15 shows the composite shear strength for each individual confining pressure used in the testing program (i.e., σ3 = 48.3, 103.5, and 207.0 kPa), as a function of the tire shred content.
The tests shown in the figure were conducted using specimens prepared with a relative density Dr = 55% and an aspect ratio η = 4. The experimental results show a composite shear strength
for tire shred-sand mixtures that is consistent with the schematic representation shown in Fig. 14 (i.e., for a given tire shred content, the composite shear strength is above the weighted average shear strength value). These results indicate that soil reinforcement mechanisms take place within the tire shred-soil mixture. Although there is some scatter in the trend, composite shear strength curves were defined using second order polynomials with good correlation (R2 > 0.9). The contribution of reinforcement mechanisms to the composite shear strength (i.e., the difference between the composite shear strength and the baseline shear strength) is more significant at low confining pressures. The results obtained at high confining pressures also show the contribution of reinforcement mechanisms, but the composite shear strength is below the shear strength of pure sand for most tire shred contents. A more significant contribution of tire shreds at low confining pressures was also reported by Edil and Bosscher (1994).
Figure 16 consolidates the information provided in Fig. 15 for each confining pressure by presenting the equivalent friction angle as a function of tire shred content for tests performed with a relative density Dr = 55% and an aspect ratio η = 4. The composite shear strength in Fig.
15 shows a maximum shear strength in the vicinity of χ = 35% (optimum tire shred content), which is in agreement with the results presented in Fig. 10a and with data reported by Ahmed and Lovell (1993). Not only is the composite shear strength above the baseline shear strength but it is also above the shear strength of pure sand for tire shred contents up to approximately 55%. For tire shred content values beyond this value, the composite shear strength decreases towards the shear strength of pure tire shreds.
Figure 17 shows the composite shear strength for each individual confining pressure (i.e., σ3
density Dr = 75% and an aspect ratio η = 4. The experimental results in this figure also show a
composite shear strength that is consistent with the schematic representation shown in Fig. 14, except for the tests performed at a high confining pressure. Indeed, the results obtained for Dr =
75% show that the contribution of reinforcement mechanisms to the composite shear strength is particularly significant under low confining pressures, as is the case for the tests where Dr = 55% (Fig. 15).
Figure 18 consolidates the information provided in Fig. 17 for each confining pressure by presenting the equivalent friction angle as a function of tire shred content for tests performed with a relative density Dr = 75% and an aspect ratio η = 4. Although shear strength gains are
observed in relation to the baseline shear strength, suggesting the contribution of reinforcement mechanisms, the tests results yield a φeq that is below the friction angle of pure sand (see also
Table 1). Check it again, please.
Overall, the experimental results obtained in this study indicate that earth structures under comparatively low confining pressures (e.g., low embankments or retaining walls, cover systems in waste containment facilities) can benefit significantly from the addition of tire shreds. For the materials and tests conditions considered in Fig. 16, the optimum tire shred content (i.e., the tire shred content leading to the highest composite shear strength) is on the order of 35%. This represents a significant volume of tire shreds that could be beneficially reused in engineered fills.
Conclusions
An experimental testing program involving pure tire shred, pure sand, and tire shred-sand specimens was undertaken to evaluate the optimum tire shred content and aspect ratio to be used
in tire shred-sand mixtures. Evaluation of the experimental results obtained in this study led to the following conclusions:
1. The triaxial test results of pure tire shred specimens show an approximately linear deviatoric stress-strain behaviour and a fully contractive volumetric strain behaviour. This response is significantly different than that of pure Monterey No. 30 sand specimens, which show a well-defined peak shear strength and a dilatant behaviour for the relative densities used in this study.
2. The influence of tire shred content on the stress-strain and volumetric strain behaviour of tire shred-sand specimens is significant. Specifically, while a dilatant behaviour is observed in specimens with tire shred contents below approximately 35%, a fully contractive behaviour is obtained in specimens with higher tire shred contents. Also, the peak shear strength is not reached for axial strains as high as 15% in specimens with high tire shred content. The behaviour of tire shred-sand mixtures changes from sand-like to tire shred-like at a tire shred content of approximately 35%.
3. The influence of sand matrix relative density on the stress-strain and volumetric strain behaviour of tire shred-sand mixtures is highly dependent on the tire shred content. While the stress-strain behaviour of pure sand specimens is highly affected by the sand matrix relative density, the behaviour of tire shred-sand specimens becomes less dependent of the sand matrix relative density.
4. The influence of tire shred aspect ratio on the stress-strain and volumetric strain behaviour of tire shred-sand specimens is negligible for axial strains below approximately 5%. However, the aspect ratio affects the stress-strain response at comparatively high axial strains. Although the aspect ratio has a negligible effect on the volumetric strain behaviour under
comparatively high confining pressures, increasing aspect ratios lead to less dilatant behaviour under comparatively low confining pressures.
5. The shear strength envelope of pure tire shreds was found to be linear and presented a non-negligible cohesion intercept. An equivalent friction angle of 26.5° for pure tire shreds was defined by forcing a zero cohesion intercept. The friction angle obtained for pure Monterey No. 30 sand was higher than the equivalent friction angle for pure tire shreds, at least for the sand matrix relative densities considered in this study.
6. The shear strength of tire shred-sand mixtures is affected by the tire shred content. The shear strength increases with increasing tire shred content, reaches a maximum for a tire shred content value in the vicinity of 35%, and then decreases for tire shred contents beyond this value.
7. An increased sand matrix relative density does not improve significantly the shear strength of tire shred-sand mixtures for a wide range of tire shred contents. Consequently, for practical purposes, it may not be effective to compact tire shred-soil mixtures to high densities.
8. The shear strength of tire shred-sand mixtures increases with increasing tire shred aspect ratio. This increase in shear strength was particularly significant when the aspect ratio was increased from 4 to 8. Consequently, tire shredding operations should be tailored to produce tire shreds with large aspect ratios.
9. The contribution of reinforcement mechanisms to the composite shear strength of mixtures is more significant at low confining pressures. Although a contribution of reinforcement mechanisms is also observed at higher confining pressures, the composite shear strength is often below that obtained for pure sand. Accordingly, structures under comparatively low confining pressures can particularly benefit from the addition of tire shreds.
Acknowledgements
Funding for this research was provided by the National Science Foundation under grant CMS - 0086927, the Colorado Advanced Materials Institute (CAMI), and Front Range Tire Recycle, Inc. This financial support is gratefully acknowledged. Additional support provided by the Université de Sherbrooke and the Natural Sciences and Engineering Research Council of Canada (NSERC - Individual Grant), which allowed the participation of the Canadian author, is also greatly appreciated.
References
Ahmed, I. 1993. Laboratory study on properties of rubber-soils. Ph.D. thesis, School of Civil Engineering, Purdue University, W. Lafayette.
Ahmed, I. and Lovell, C.W. 1993. Use of rubber tires in highway construction. In: Proceedings of Utilisation of Waste Materials in Civil Eng. Construction. Inyang and Bergeson (eds.), ASCE, New York, pp. 166-181.
ASTM (1993). Standard test method for specific gravity and absorption of coarse aggregate, C 127-88, West Conshohocken, PA: ASTM International.
ASTM (1995). Standard test method for unconsolidated undrained triaxial compression test for cohesive soils, D4767-95. West Conshohocken, PA: ASTM International.
Bathurst, R.J., Walters, D.L, Hatami, K., and Allen, T.M. 2001. Full-scale performance testing and numerical modelling of reinforced soil retaining walls. In Proceedings of the International Symposium on Earth Reinforcement, IS Kyushu 2001, Vol. 2, pp. 3-30.
Benson, C.H., and Khire, M.V. 1994. Reinforcing sand with strips of reclaimed high-density polyethylene. Journal of Geotechnical Engineering, ASCE, 120 (5): 838-855.
Bosscher, P. J., Edil, T. B., and Kuraoka, S. 1997. Design of highway embankments using tire chips. Journal of Geotechnical and Geoenvironmental Engineering, ASCE, 123 (4): 295-304. Doré, G., Konrad, J.M., Roy M., and Rioux N. 1995. Use of alternative materials in pavement
frost protection: Material characteristics and performance modeling. Transportation Research Record 1481, Transportation Research Board, Washington, D.C., pp.63-74.
Edil, T.B. and Bosscher, P.J. 1994. Engineering properties of tire chips and soil mixtures. ASTM Geotechnical Testing Journal, 17 (4): 453-464.
Elias, V., Christopher, B.R., Berg, R.R. 2001. Mechanically stabilized earth walls and reinforced soil slopes. Publication Number FHWA NH-00-043, March 2001, NHI-FHWA.
Foose, G. J., Benson, C. H., and Bosscher, P. J. 1996. Sand reinforced with shredded waste tires, Journal of Geotechnical Engineering, ASCE, 122 (9): 760-767.
Gacke, S., Lee, M. and Boyd, N. 1997. Field performance and mitigation of shredded tire embankment. Transportation Research Record 1577, Transportation Research Board, Washington, D.C., pp. 81-89.
Garga, V. K. and O’Shaughnessy, V. 2000. Tire-reinforced earthfill. Part 1: Construction of a test fill, performance, and retaining wall design. Canadian Geotechnical Journal, 37 (1): 75-96.
GeoSyntec Consultants 1997a. Technical considerations for waste tire monofills. Report to the California Integrated Waste Management Board. Project No. WL0048-11.
GeoSyntec Consultants 1997b. Use of tire shreds in landfills. Report to the California Integrated Waste Management Board.
Gray, D.H. and Al-Refeai, T. 1986. Behavior of fabric versus fiber-reinforced sand. Journal of Geotechnical Engineering, ASCE, 112 (8): 804-820.
Gray, D.H. and Ohashi, H. 1983. Mechanics of fiber-reinforcement in sand. ASCE J. Geotechnical Engineering 109 (3): 335-353.
Hoppe, E. J. 1994. Field study of shredded-tire embankment. Report No. FHWA/VA-94-IR1, Virginia Department of Transportation, Richmond, VA. (Also, Transportation Research Record 1619).
Humphrey, D.N., Whetten, N., Weaver, J., Recker, K. and Cosgrove, T.A. 1998. Tire shreds as lightweight fill for embankments and retaining walls. Proceedings Conf. on Recycled Materials in Geotechnical Applications. Edited by: Vipulanandan and Elton, ASCE, pp. 51-65.
Humphrey, D.N., Sandford, T., Cribbs, M. and Manion, W. 1993. Shear strength and compressibility of tire chips for use as retaining wall backfill. Transportation Research Record 1422, Transportation Research Board, Washington, D.C., pp. 29-35.
Humphrey, D.N. 1996. Investigation of exothermic reaction in tire shred fill located on SR 100 in Ilwaco, Washington. Prepared for the Federal Highway Administration, Washington, D.C., 60 p.
Humphrey, D.N., and Manion, W. P. 1992. Properties of tire chips for lightweigh fill. grouting, soil improvement and geosynthetics, ASCE 2: 1344-1355.
Humphrey, D.N. 1997. Civil engineering applications of tire shreds: A short course. Organized by GeoSyntec Consultant, Inc. June 1997.
Lee, J.H., Salgado, R., Bernal, A., and Lovell, C.W. 1999. Shredded tires and rubber sand as lightweight backfill. Journal of Geotechnical and Geoenvironmental Engineering, ASCE, 125 (2): 132-141.
Leflaive, E. 1985. Soils reinforced with continuous yarns: the Texol. In: Proceedings Eleventh International Conf. on Soil Mech. and Found. Engineering 3, San Francisco, pp: 1787-1790. Maher, M. H., and Gray, D. H. 1990. Static response of sand reinforced with randomly
distributed fibers. Journal of Geotechnical Engineering, ASCE, 116 (11): 1661-1677.
Maher, M. H., and Wood, R. D. 1990. Dynamic response of sand reinforced with randomly distributed fibers. Journal of Geotechnical Engineering, ASCE, 116 (7): 1116-1131.
McGown, A., Andrawes, K.Z., Hytiris, N. and Mercer, F.B. 1985. Soil strengthening using ramdomly distributed mesh elements. In: Proceedings 11th International Conf. Soil Mech. and Found. Eng., Vol. 5, San Francisco, California, 1735-1738.
Morel, J.C. and Gourc, J.P. 1997. Mechanical behavior of sand reinforced with mesh elements. Geosynthetics International, 4 (5): 481-508.
O’Shaughnessy, V. and Garga, V.K. 2000a. Tire reinforced earthfill. Part 2: Pull-out behaviour and reinforced slope design. Canadian Geotechnical Journal, 37: 97-116.
O’Shaughnessy and Garga. 2000b. Tire reinforced earthfill. Part 3: Environmental assessment. Canadian Geotechnical Journal, 37: 117-131.
Whetten, N., Weaver, J., Humphrey, D., and Sandford, T. 1997. Rubber meets the road in Maine, Civil Engineering, 67 (9): 60-63.
Wu, J. T. H., Helwany, M. B., and Barrett, R. K. 1994. Use of shredded tire as backfill for a new GRS retaining wall system. Proceeding of the 5th International Conference on Geotextiles, Geomembranes and Related Products, Singapore, 269-272.
Zornberg, J.G. 2002. Discrete framework for limit equilibrium analysis of fibre-reinforced soil. Géotechnique, 52 (8): 593-604.
Zornberg, J.G. and Viratjandr, C. 2001. Shear strength of tire shred-sand mixtures. Geotechnical Research Report. University of Colorado at Boulder. August 2001.
Zornberg, J.G., Sitar, N., and Mitchell, J.K. 1998. Limit equilibrium as a basis for design of geosynthetic reinforced slopes. Journal of Geotechnical and Geoenvironmental Engineering, ASCE, 124 (8): 684-698.
Table 1. Scope of Testing Program and Summary of Shear Strength Parameters
Series No. Sand Relative Density, D
r (%)
Tire shred content, χ
(% by weight) Size (mm) Tire Shred Aspect Ratio, η Mohr-Coulomb Envelope φeq 1 55 0 N/A N/A φ = 36.8° 37.9 ° c = 7.8 kPa 2 75 0 N/A N/A φ = 41.0° 41.4 ° c = 3.8 kPa 3 55 10 12.7 (0.5") 4 φ = 35.7 ° 38.9 ° c = 21.7 kPa 4 55 30 12.7 (0.5") 4 φ = 35.7 ° 40.2 ° c = 30.4 kPa 5 55 60 12.7 (0.5") 4 φ = 34.4 ° 37.3 ° c = 18.2 kPa 6 N/A 100 12.7 (0.5") 4 φ = 21.4 ° 26.5 ° c = 22.8 kPa 7 75 30 12.7 (0.5") 4 φ = 36.4 ° 40.8 ° c = 30.7 kPa 8 55 30 12.7 (0.5") 2 φ = 35.6 ° 38.9° c = 22.3 kPa 9 55 30 25.4 (1.0") 1 φ = 35.1 ° 38.7° c = 23.7 kPa 10 75 20 12.7 (0.5") 4 φ = 37.2 ° 40.3 ° c = 22.0 kPa 11 55 30 12.7 (0.5") 8 φ = 36.11 ° 44.5 ° c = 60.0 kPa 12 55 38.3 12.7 (0.5") 4 φ = 36.1 ° 42.0 ° c = 41.2 kPa 13 55 10 2.54 (1.0") 1 φ = 36.5 ° 39.4 ° c = 19.8 kPa 14 55 5 12.7 (0.5") 4 φ = 36.1 ° 37.1 ° c = 7.0 kPa 15 65 15 12.7 (0.5") 4 φ = 34.8 ° 38.2° c = 21.7 kPa
Fig. 2. Results of tests on Monterey No. 30 Sand (Series 1 and 2): (a) deviatoric stress-strain; and (b) volumetric strain behaviour
0 100 200 300 400 500 600 700 800 900 1000 0 5 Axial Strain(%) 10 15 D ev iat ori c St res s (k Pa) σ3 = 207 kPa σ3 = 103.5 kPa σ3 = 48.3 kPa σ3 = 241.5 kPa (a)
Series 1: Monterey # 30 Sand, Dr = 55% Series 2: Monterey # 30 Sand, Dr = 75%
-1.0 0.0 1.0 2.0 3.0 4.0 5.0 6.0 7.0 8.0 9.0 0 5 Axial Strain (%) 10 15 Voul m etr ic S trai n ( % ) σ3 = 48.3 kPa σ3 = 207 kPa σ3 = 241.5 kPa
Series 2: Monterey # 30 Sand, Dr = 75%
(b)
contraction dilatation
σ3 = 103.5 kPa Series 1: Monterey # 30 Sand, Dr = 55%
σ3 = 103.5 kPa σ3 = 48.3 kPa
Fig. 3. Results of tests on pure tire shreds (Series 6): (a) deviatoric stress-strain; and (b) volumetric strain behaviour
0 100 200 300 0 5 10 15 Axial Strain (%) De vi ator ic S tres s ( kP a) σ3 = 207.0 kPa (a) σ3 = 103.5 kPa σ3 = 48.3 kPa -7.0 -6.0 -5.0 -4.0 -3.0 -2.0 -1.0 0.0 1.0 0 5 10 15 Axial Strain (%) Voul metr ic S trai n ( % ) σ3 = 207.0 kPa dilatation contraction (b) σ3 = 103.5 kPa σ3 = 48.3 kPa
Fig. 4. Results of tests on tire shred-sand mixtures with χ < 30%: (a) deviatoric stress-strain behaviour for Dr = 55%; (b) volumetric
strain behaviour for Dr = 55%; (c) deviatoric stress-strain behaviour for Dr > 55%; and (d) vol. strain behaviour for Dr > 55%
0 100 200 300 400 500 600 700 800 0 5 10 15 Axial Strain (%) Dev iator ic S tres s ( kP a) (a) σ3 = 48.3 kPa σ3 = 103.5 kPa σ3 = 207.0 kPa Series 3 (Dr = 55%)
(also representative of Series 13 and 14)
-1.0 0.0 1.0 2.0 3.0 4.0 5.0 0 5 Axial Strain (%) 10 15 Voul m et ric S trai n (% ) (b) σ3 = 48.3 kPa dilatation contraction Series 3 (Dr = 55%)
(also representative of Series 13 and 14)
σ3 = 207.0 kPa σ3 = 103.5 kPa 0 100 200 300 400 500 600 700 800 900 0 5 10 15 Axial Strain (%) Dev iator ic S tres s ( kP a) (c) Series 10 (Dr = 75%)
(also representative of Series 15 and 7)
σ3 = 48.3 kPa σ3 = 103.5 kPa σ3 = 207.0 kPa -1.0 0.0 1.0 2.0 3.0 4.0 5.0 0 5 Axial Strain (%) 10 15 V oul m etr ic S trai n ( % ) dilatation contraction (d) σ3 = 207.0 kPa Series 10 (Dr = 75%)
(also representative of Series 15 and 7)
σ3 = 103.5 kPa σ3 = 48.3 kPa
Fig. 5. Results of tests on sand-tire shred mixtures with χ = 30% and Dr = 55%: (a)
deviatoric stress-strain; and (b) volumetric strain behaviour
-1.0 0.0 1.0 2.0 3.0 4.0 5.0 0 5 10 15 20 Axial Strain (%) Vo ulm et ric St rain (%) dilatation contraction (b) Series 4 (η = 4)
(also representative of Series 8 (η = 2) and 9 (η = 1)) Series 11 (η = 8)
σ3 = 48.3 kPa
σ3 = 103.5 kPa
σ3 = 207.0 kPa Note: Series 9 not shown for clarity
0 100 200 300 400 500 600 700 800 900 0 5 10 15 Axial Strain(%) De vi ato ric S tre ss ( kP a) (a) Series 4 (η = 4)
(also representative of Series 8 (η = 2))
Series 11 (η = 8)
σ3 = 48.3 kPa
σ3 = 103.5 kPa
σ3 = 207.0 kPa Series 9 (η = 1)
Fig. 6. Results of tests on sand-tire shred mixtures with Dr = 55% and χ > 30%: (a) deviatoric
stress-strain; and (b) volumetric strain behaviour
0 100 200 300 400 500 600 700 800 900 0 5 10 15 20 Axial Strain(%) De vi ato ric S tre ss ( kP a) (a) σ3 = 48.3 kPa σ3 = 103.5 kPa σ3 = 207.0 kPa Series 5 (χ = 60%) Series 12 (χ = 38%) -5.0 -4.0 -3.0 -2.0 -1.0 0.0 1.0 2.0 3.0 4.0 5.0 0 5 10 15 20 Axial Strain (%) Vo ulm et ric St rain (%) (b) dilatation contraction σ3 = 48.3 kPa σ3 = 103.5 kPa σ3 = 207.0 kPa σ3 = 207.0 kPa σ3 = 103.5 kPa σ3 = 48.3 kPa Series 5 (χ = 60%) Series 12 (χ = 38%)
Fig. 7. Results of tests on sand-tire shred mixtures with χ = 30% and η = 4: (a) deviatoric stress-strain; and (b) volumetric strain behaviour
0 100 200 300 400 500 600 700 800 900 0 5 10 15 Axial Strain(%) De vi ato ric S tre ss ( kP a) Series 4 (Dr = 55%) Series 7 (Dr = 75%) (a) σ3 = 48.3 kPa σ3 = 103.5 kPa σ3 = 207.0 kPa -1.0 0.0 1.0 2.0 3.0 4.0 5.0 0 5 10 15 Axial Strain (%) Vo ulm et ric St rain (%) dilatation contraction (b) Series 4 (Dr = 55%) Series 7 (Dr = 75%) σ3 = 48.3 kPa σ3 = 103.5 kPa σ3 = 207.0 kPa
Fig. 8. Shear strength envelopes for pure Monterey No. 30 sand and pure tire shred 0 50 100 150 200 250 300 350 400 0 50 100 150 200 250 300 350 400 450
Normal Stress (kPa)
She ar S tre ng th (k Pa)
Series 2: pure sand Dr = 75%
Series 1: pure sand Dr = 55%
Fig. 9. Relationship between friction angle and relative density for pure Monterey No. 30 sand 30 32 34 36 38 40 42 44 35 40 45 50 55 60 65 70 75 80 Dr (%) Equ iv al ent fr ic tio n ang le , φ eq (d eg re es )
Fig. 10. Shear strength envelopes for series with varying tire shred contents (Dr = 55%; η = 4):
(a) shear strength envelopes; and (b) axial strain at failure
0.0 50.0 100.0 150.0 200.0 250.0 300.0 350.0 0.0 50.0 100.0 150.0 200.0 250.0 300.0 350.0 400.0
Normal Stress (kPa)
Shear S trength ( kP a) 10%
Tire shred content (χ) 5% 30% Series 4 60% Series 5 38.3% Series 12 Series 3 Series 14 100% Series 6 (a) Series 1 0% 0.0 5.0 10.0 15.0 20.0 25.0 30.0 35.0 0 50 100 150 200 250
Confining Stress (kPa)
Ax ial S trai n at F ai lur e ( % ) 10%
Tire shred content (χ) 5% 30% Series 4 60% Series 5 38.3% Series 12 Series 3 Series 14 100% Series 6 (b) Series 1 0%
Fig. 11. Shear stress mobilized at 5% axial strain for specimens with varying relative density (η = 4) 0 20 40 60 80 100 120 140 160 180 200 0 50 100 150 200 250
Normal Stress (kPa)
Shear S tres s at 5% S trai n,
τ
5% (kPa ) 10%Tire shred content (χ) 5% 30% Series 4 60% Series 5 38.3% Series 12 Series 3 Series 14 100% Series 6
Fig. 12. Shear strength envelopes for specimens with varying relative density(η = 4) 0 50 100 150 200 250 300 0 50 100 150 200 250 300 350 400
Normal Stress (kPa)
She ar S tre ng th (k Pa) Series 4 Series 7 Series 10 75% Dr (%) 55% 75%
Tire shred content (χ) 30%
30% 20%
Fig. 13. Influence of aspect ratio on shear strength (Dr = 55% and χ = 30%): (a) shear
strength envelopes; and (b) relationship between η and φeq
0 50 100 150 200 250 300 350 0 50 100 150 200 250 300 350 400
Normal Stress (kPa)
She ar S tre ng th (k Pa) Series 4 Series 8 Series 9 Series 11 Aspect ratio 4 2 1 8 (a) 3rd order polynomial 38 39 40 41 42 43 44 45 0 1 2 3 4 5 6 7 8 9 10
Aspect Ratio, η (dimensionless)
Equ iv al ent F ric tio n Ang le , φ eq (d eg re es ) (b) Series 11 Series 4 Series 8 Series 9
Fig. 14. Schematic representation of the influence of tire shred content on the shear strength of tire shred-sand mixtures at a given soil relative density
Sh ea r S tre ng th
Baseline shear strength
Tire Shred Content, (%)χ
Composite shear strength
Contribution of reinforcement mechanisms to the composite shear strength
Shear strength of pure sand
Shear strength of pure tire shred
Contribution of internal to the composite shear strength shear mechanisms 0% 100%
Fig. 15. Influence of tire shred content on shear strength for varying confining pressures (η = 4; Dr =55%): (a)
σ
3 = 48.3 kPa; (b)σ
3 = 103.5 kPa; and (c)σ
3 = 207.0 kPa0.0 20.0 40.0 60.0 80.0 100.0 120.0 0.0 10.0 20.0 30.0 40.0 50.0 60.0 70.0 80.0 90.0 100.0 Tire Shred Content, χ (%)
Shear S trengt h at F ai lur e, τ ff (k Pa ) Series 14 Series 3 Series 4 Series 12 Series 5 (a) σ3 = 48.3 kPa 60.0 80.0 100.0 120.0 140.0 160.0 180.0 0.0 10.0 20.0 30.0 40.0 50.0 60.0 70.0 80.0 90.0 100.0 Tire Shred Content, χ (%)
Shear S trengt h at F ai lur e, τ ff (k Pa ) Series 14 Series 3 Series 4 Series 12 σ3 = 103.5 kPa (b) Series 5 100.0 150.0 200.0 250.0 300.0 0.0 10.0 20.0 30.0 40.0 50.0 60.0 70.0 80.0 90.0 100.0 Tire Shred Content, χ (%)
Shear S trengt h at F ai lur e, τff (k Pa ) Series 14 Series 3 Series 4 Series 12 Series 5 σ3 = 207.0 kPa (c)
Fig. 16. Influence of tire shred content on equivalent friction angle (η = 4; Dr = 55%) 20.0 25.0 30.0 35.0 40.0 45.0 50.0 55.0 0.0 10.0 20.0 30.0 40.0 50.0 60.0 70.0 80.0 90.0 100.0 Tire Shred Content, χ (%)
Equ iv al ent F ric tio n Ang le , φeq (d eg re es ) Test 14 Series 3 Series 4 Series 12 Series 5
Fig. 17. Influence of tire shred content on shear strength for varying confining pressures (η = 4; Dr =75%): (a)
σ
3 = 48.3 kPa; (b)σ
3 = 103.5 kPa; and (c)σ
3 = 207.0 kPa0.0 20.0 40.0 60.0 80.0 100.0 120.0 0.0 20.0 40.0 60.0 80.0 100.0
Tire Shred Content, χ (%)
Shear S trengt h at F ai lur e, τff (k Pa ) (a) Series 10 Series 7 σ3 = 48.3 kPa 60.0 80.0 100.0 120.0 140.0 160.0 180.0 0.0 20.0 40.0 60.0 80.0 100.0
Tire Shred Content, χ (%)
Shear S trengt h at F ai lur e,τ ff (k Pa ) (b) Series 10 Series 7 σ3 = 103.5 kPa 100.0 150.0 200.0 250.0 300.0 350.0 400.0 0.0 20.0 40.0 60.0 80.0 100.0
Tire Shred Content, χ (%)
Shear S trengt h at F ai lur e,τ ff (k Pa ) (c) Series 10 Series 7 σ3 = 207.0 kPa
Fig. 18. Influence of tire shred content on equivalent friction angle (η = 4; Dr = 75%) 20.0 25.0 30.0 35.0 40.0 45.0 50.0 55.0 0.0 10.0 20.0 30.0 40.0 50.0 60.0 70.0 80.0 90.0 100.0 Tire Shred Content, χ (%)
Equ iv al ent F ric tio n Ang le , φ eq (d eg re es ) Series 10 Series 7