Particle size distribution of limestone fillers: granulometry and specific
surface area investigations
F. Michel and L. Courard
University of LIEGE
ArGEnCo Department – GeMMe Building Materials Civil Engineering Institute
Chemin des Chevreuils, 1 (B52) B – 4000 LIEGE
BELGIUM
Tel: 32.4.366.91.98 – Fax: 32.4.366.95.20 Corresponding author: Luc.Courard@ulg.ac.be
Abstract
Mineral fillers can be defined as “inert materials included in a mix design for some useful purpose”. They can be added to compounds in order to complete a large variety of final properties without increasing costs or to improve specific characteristics like hardness, brittleness, impact strength, compressive strength, softening point, fire resistance, surface texture, electrical conductivity, …etc. In Belgium, locally available limestone fillers are specifically very well-adapted for the optimisation of particle packing and flow behaviour of cementitious pastes in concrete mixes.
Limestone fillers may be easily characterized in terms of chemical and mineralogical properties. These properties are fundamental for the study of the behaviour of concrete mixes in fresh state and for understanding interactions existing at the level of the Interfacial Transition Zone between aggregates and cement paste.
These properties are however insufficiently discriminant and particle size, as well as shape distribution, seem to have a potential influence on physical phenomena which happen during the setting process.
The aim of this paper is to compare five major techniques used to quantify the size and the shape of limestone fillers particles: laser diffraction scattering, wet sieving and image analysis for particle size measurement and BET adsorption and Blaine permeability methods for specific surface area.
Keywords: Limestone fillers, particle size distribution, specific surface area, image analysis, BET adsorption, Blaine.
1. Introduction
Limestone fillers are largely used in the concrete industry, especially for Self Compacting Concrete mix design (Ghezal et al. 2002; Ho et al. 2002). Besides heterogeneous nucleation effect leading to a chemical activation of the cement hydration, it is now generally accepted that the main effect of the limestone powder is of physical nature (Tsivilis et al. 1999). In addition to cement, limestone particles modify the grain size distribution. The final effect depends on the fineness and the amount of powder. In the favourable case where an improvement in blended particles size distribution is observed, i.e. a continuous sieving curve, limestone particles fill the voids between clinker particles and improve the packing density of the granular skeleton; this consequently densifies the microstructure of the hardened cement paste (Sprung et Siebel 1991). The correlative effects are lower water retention and, subsequently, lower water demand for specific workability. This suggests that particle size distribution has a considerable influence on the water demand of paste. Moreover, the shape of fine particles was reported as having a significant effect on water demand (Wills 1967; Ferraris et al. 2001).
Relationship between physical characteristics of particles and water requirement is not so evident and clearly demonstrated (Courard et al. 2011). The reason is partially due to the test needed for characterizing these physical parameters (Diederich et al. 2013). The purpose of this article is to review different techniques for analysing size and shape of micrometric particles such as limestone fillers. Particle size measurement has been studied by means of laser light scattering, wet sieving (45, 63 and 125µm) and static image analysis. This last technique enables also to characterize the shape of particles. BET adsorption and Blaine permeability methods were also used to determine specific surface area of fillers.
2. Materials and methodology
2.1 Powders
Six limestone fillers, labelled F1 to F6 [8], have been collected in Belgium (Wallonia region). They differ from each other by production process (Table 1).
Table 1. Origin and production process of limestone fillers.
Limestone fillers Production process Industrial Sector
F1
Dry
Crushing Lime
F2
F3 Drying / crushing Aggregates
F4
Wet
Sawing Ornamental stones
F5
Washing Aggregates
F6
Residual fillers coming from lime kiln feed (F1, F2) and sawing of ornamental stones (F4) present a very high CaCO3 content whereas large amounts of impurities are observed in the case of fillers produced in limestone quarries (15% of quartz for F3 and 23% of dolomite for F6) (Table 2). Moreover, Al2O3 and alkalis (Na2O and K2O) contents indicate a contamination by clay for fillers coming from aggregate production industry (Courard et al. 2011). This is confirmed by Methylene Blue Adsorption results (Meerseman et al. 2006; Michel et al. 2007).
Limestone filler reference F1 F2 F3 F4 F5 F6
Mineralogical analysis by DRX (main phases)[7]
Calcite CaCO3 [%] 99.5 99.5 82.0 94.5 86.0 75.0
Quartz SiO2 [%] 0.0 0.0 15.5 1.8 6.5 2.0
Dolomite Ca(Mg,Fe)(CO3)2 [%] 0.5 0.5 2.5 3.7 7.5 23.0
Chemical analysis (minor components)
Al2O3 [%] 0.15 0.07 2.38 0.63 4.45 1.38
Na2O [%] 0.07 0.03 0.33 0.27 0.10 0.06
K2O [%] 0.03 0.02 0.61 0.11 1.02 0.28
Fe2O3 [%] 0.15 0.04 0.90 0.33 1.71 0.82
Methylene Blue Adsorption [g/kg filler] 0.7 0.7 4.0 1.3 5.0 3.3
2.2. Laser diffraction (LD)
Laser diffraction is based on a complex theory of interaction between monochromatic light and individual particles. This involves the detection of the angular distribution of light scattered by a set of monodispersed spherical particles to provide a “sphere”-equivalent size diameter distribution using a reverse optical scattering-based model calculation (Fig.1).
Fig. 1. Principles of Laser Diffraction
Two models are commonly used to build Particle Size Distribution (PSD-V) weighted by apparent volume (volume of equivalent sphere of diameter d). The Mie theory-based model predicts scattering of light by homogeneous sphere of arbitrary size; it is probably the most rigorous model available (Mie 1908). It requires, as input, the refractive index (both real n and imaginary k) of both the particle and the medium. In another hand, Fraunhofer approximation considers particles as opaque disks and, consequently, does not require any knowledge of the material’s optical properties. This assumption is fairly acceptable when the particle scattering the incident light is significantly larger than the incident wavelength, with a refractive index significantly different from the surrounding medium. The bounding conditions for which the Fraunhofer diffraction theory adequately describes the scattering phenomena were given by Van der Huls (Van der Huls 1957). Cyr (Cyr 1991) calculated these boundaries conditions in the case of typical building materials and found particle critical diameters ranged from 8 to 18 µm depending on optical properties of materials and dispersant used.
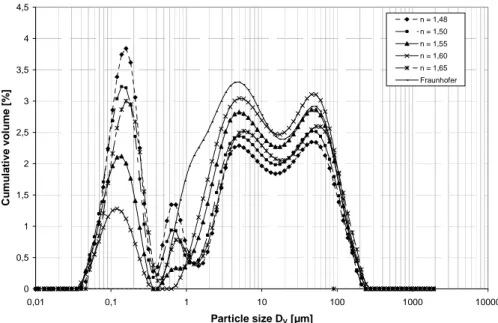
Limestone fillers are mainly composed of fine divided particles (< 20µm). Mie theory (Mie 1938) is therefore more adequate to deconvolve the diffraction pattern. However, although the samples studied are not fully pure, CaCO3 mineral is strongly birefringent (refractive indices ranging from 1.48 to 1.66) and makes very difficult the selection of representative refractive index average. Fig.2 and Table 3 illustrate how the change of refractive index value can lead to different particle size distributions mainly in the range of submicron particles (for k = 0.1). It can be observed how Fraunhofer approximation disregards the very weak scattering for thin particles, taking into consideration the constancy of the extinction efficiency, whatever the particle’s size: it fails to report any quantity of particles below 0.45 µm (Fig.2). For the purpose of this research, Fraunhofer and Mie theories were both considered in order to compare the PSD. In the case of Mie, a refractive index of 1.57 was selected according to specification of
the manufacturer. For each sample, six potential values of absorption indices (0 – 0.01 – 0.05 – 0.1 – 0.15 – 0.20) were computed. The one which gave the best match between real and calculated angular distribution of light – it means the lowest weighted residual - was then selected.
Wet dispersion measurements were performed using a Mastersizer 2000 instrument coupled to a Hydro 2000S wet dispersion unit (Malvern, UK). Through a series of experiments, the optimum operating conditions for dispersion were selected (Michel 2006). Limestone particles were dispersed in a sodium pyrophosphate solution. Afterwards, the samples were transferred to dispersion unit that contains deionized water and subjected to 90 seconds of ultrasonic waves. The concentration of solid in the dispersion unit is selected in order to allow scattering but limiting multiple scattering (15% of obscuration rate). Laser diffraction is repeated three times on each filler sample.
0 0,5 1 1,5 2 2,5 3 3,5 4 4,5 0,01 0,1 1 10 100 1000 10000 Particle size DV [µm] C u m u la ti v e v o lu m e [ % ] n = 1,48 n = 1,50 n = 1,55 n = 1,60 n = 1,65 Fraunhofer
Fig. 2. Influence of the value of the refractive index on the PSD of limestone filler F1 (for k=0.1).
Table 3. Volume weighted percentiles V X
D [µm] of the size distribution obtained from laser
diffraction of limestone filler for different refractive indices Refractive index Fraunhofer 1.48 1.5 1.55 1.6 1.65 V D5 0.1 0.1 0.1 0.1 1.5 0.9 V D10 0.1 0.1 0.1 0.2 2.1 1.3 V D50 4.3 5.3 7.7 9.6 12.6 8.5 V D90 60.0 6.2 68.2 71.2 75.2 68.5 V D95 85.7 94 93.8 97.0 100.8 100.8
2.2. Static Image Analysis (SIA)
Static image analysis has been performed by means of the Occhio 500 Nano image analyser. This instrument includes an integrated vacuum dispersion system and a high-quality optical component which allows assessing size and shape of a set of dispersed particles. Few milligrams of particles are dispersed onto a circular glass slide which is moved in front of a collimated violet LED backlighting. Pictures of individual particles are captured with a 1392*1040 pixels video camera fitted with a telecentric lens of 480nm resolution. The inscribed disk diameter (DIN) of each particle is calculated in real time to build size distribution curves weighted by apparent volume (PSD-V’) (Gregoire et al. 2007), making the assumption that particles have identical flatness ratios, whatever their size.
Particle image acquisition method proceeds by scanning the first 50000 particles, ensuring that particles are scanned at least once on the whole diameter of the glass slice: this is needed in order to avoid any deviation due to heterogeneous dispersion of the particles.Two scans have been conducted for a total of 100000 particles. The accuracy associated to the estimation of PSD-V, expressed as the two-sided 95% confidence interval, is computed by means of the
bootstrap method (Gregoire et al. 2007; Michel et al. 2007). In practice, 500 bootstrap samples of 10000 particles are used to build confidence interval.
2.3. Sieving
Sieving is a reference simple method for the classification of powders with regards only to their physical but real size. It can be performed either in a dry or a wet way, with manual or mechanical vibration, and for fixed duration or until a sufficiently low powder flow rate is observed through the sieves. It is however limited by physical dimensions of the sieve, i.e. usually 45µm.
2.4. Blaine Permeability
The Blaine fineness tester is used for the measurement of the specific surface area of particles on the base of air permeability method: the time t necessary for a volume of air to flow through a packed bed of particles is recorded. The European Standard EN 196-6 gives the evaluation of specific surface area (Carman 1956) with Kozeny-Carman equation (Eq.1):
2 / 1 2 / 1 2 / 3 , ) 1 , 0 ( ) 1 (
ε
η
ρ
ε
t K S S app koz S − = (1)where ε is the porosity of the packed bed of powder, η is the viscosity of air [Pa.s] and ρS the density of the solid [g.cm-3]. The constant Kapp [g1/2.cm3/2.s-1], which is a characteristic of the apparatus, is determined with a calibration cement powder linked up to a standard reference material. Assuming that the air is compressible (Michel 2006), the Kozeny-Carman equation can be used to give a more accurate relationship for the apparatus constant (Eq.2).
sample tube air cell L app L D kC D K =10−2 0,1
ρ
(2)where ρL is the density of the manometer fluid, Dcell and Dtube are the inner diameter of the cell and of the tube [cm], respectively,k is the Kozeny constant, Lsample is the height of the packed bed of powder [cm]. Cair is a term which takes into account air compressibility due to pressure drop between the opposite sides of the sample; it depends on atmospheric pressure and geometrical characteristics of the instrument (Niesel 1973). Kozeny constant is related to the shape of particles and the bed tortuosity. Eq.2 clearly points out that the apparatus constant depends on several parameters including hygrometric conditions but also the height of packed bed of particles: these should be selected in accordance with operational conditions, in order to avoid serious misinterpretation. That’s the reason why we propose to calculate Kozeny constant k linked up to a standard reference material and to measure Lsample and Cair for each new test.
2.6. B.E.T. Nitrogen Absorption
The determination of the specific surface by means of the B.E.T. theory is based on the physical adsorption of gases on the total surface of a porous material, which means outside as well as inside surfaces. The surface area is obtained from Eq.3 (Brunhauer 1938):
c v P P c v c P P v P m m 1 1 ) ( 0 0 + − = − (3)
where ν is the adsorbed volume of nitrogen at a given pressure P, P0 is the saturation pressure,
νm is the volume corresponding to a monolayer of N2 on the surface and c is related to the heat
of adsorption in the first and subsequent adsorbed layers. When equalling these quantities to the experimental slope and intercept of the straight line, one obtains two equations which may be solved for νm. From this value and knowing the cross sectional area σ of the adsorbed molecule, the specific surface area of the absorbent may be calculated directly with Eq.4.
V N v SSBET m . , =
σ
(4) 3. Results and discussion3.1. Granulometry analysis
The volume weighted percentilesD10V,
V
D50,
V
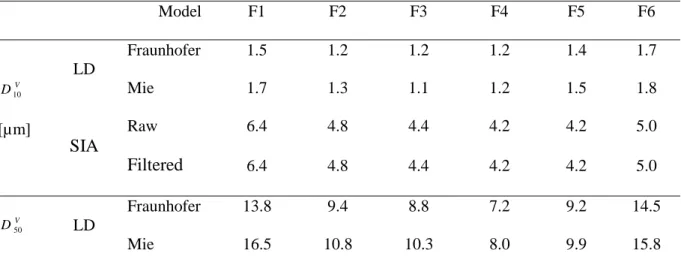
D90 of limestone fillers performed by laser diffraction (LD) and static image analysis (SIA) are reported on Table 1; DMAXV is corresponding to the biggest particle. In case of SIA, examination of dataset shows how a very few particles with superior extreme values greatly affect statistics.
For this reason, besides a first analysis based on raw data, a second analysis was conducted on numerical filtered dataset to better visualize the size distribution of the remaining particles. It consists in considering the 5 biggest particles of each samples as statistical outliers and, consequently, removing them from the dataset. Moreover, Fig. 3 shows how the confidence interval gets appreciably narrower after filtration. In the case of LD, both Fraunhofer and Mie theories seem to lead to reasonably similar size distributions.
Table 1. Volume weighted Xth percentiles of the diameter of limestone filler obtained from Mie and Fraunhofer models.
Model F1 F2 F3 F4 F5 F6 V D10 [µm] LD Fraunhofer 1.5 1.2 1.2 1.2 1.4 1.7 Mie 1.7 1.3 1.1 1.2 1.5 1.8 SIA Raw 6.4 4.8 4.4 4.2 4.2 5.0 Filtered 6.4 4.8 4.4 4.2 4.2 5.0 V D50 LD Fraunhofer 13.8 9.4 8.8 7.2 9.2 14.5 Mie 16.5 10.8 10.3 8.0 9.9 15.8
[µm] SIA Raw 20.6 11.0 11.8 9.5 10.5 13.0 Filtered 19.0 8.9 11.4 9.5 10.2 12.2 V D90 [µm] LD Fraunhofer 73.1 68.7 50.8 47.4 47.8 101.8 Mie 73.4 67.1 50.1 45.0 47.6 107.7 SIA Raw 62.5 34.5 33.8 24.0 32.4 43.6 Filtered 50.9 27.4 28.4 22.1 28.6 34.9 V MAX D [µm] SIA Raw 107.4 82.1 61.7 47.2 58.7 107.9 Filtered 71.8 47.5 46.8 35.6 44.7 51.7
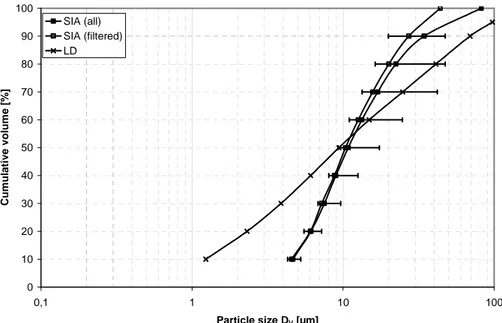
Fig. 3 illustrates the typical discrepancy existing between SIA and LD. It clearly shows that LD extends the size distribution towards both the lower and upper sizes. In the case of lower size, one could argue that SIA is unable to take into account particles smaller than 3 pixels in width (1.44 µm). However, the pendant question is to know if this argument may explain the whole discrepancy. In order to shift the size distributions towards lower values and try to correlate SIA with LD, enormous amounts (> 90% by number) of very fine material are needed (Brunhauer 1938). On the other hand, even if the whole dataset is used for static image analysis, results demonstrate that LD extends the size distribution towards the upper sizes. The presence of 63 – 125 µm particles observed in the case of LD analysis is confirmed by wet sieving (Table 5). We can then partially explain the absence of big particles by the probability of inclusion of a particle within the image frame: only particles fitting entirely within the image frame are indeed considered for measurement. That means that, the bigger the particle, the higher the probability to have contact with the frame: consequently, the “risk” to be excluded from the analysis really exists. However, this phenomenon is not so important for particles between 80 and 125 µm.
0 10 20 30 40 50 60 70 80 90 100 0,1 1 10 100 Particle size DV [µm] C u m u la ti v e v o lu m e [ % ] SIA (all) SIA (filtered) LD
Fig. 3. Cumulative size distributions obtained for limestone filler F1 from LD (Mie model) and SIA.
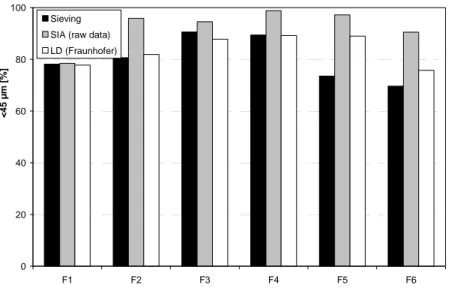
Table 5. Cumulative average particle weight (%) of limestone fillers for wet sieving. Passing sieve size F1 F2 F3 F4 F5 F6 45 µm 78.1 80.6 90.6 89.4 73.5 69.6 63 µm 85.9 87.1 95.6 92.3 81.2 76.8 125 µm 99.6 97.6 99.9 95.4 95.9 88.9
The comparison between 45 and 63 µm passing sieve particles, obtained by the three different methods, is illustrated in Fig. 4 and Fig. 5; considering that all the particles have the same density, volume VV is equal to weight WW. It can be observed that the 45µm and 63µm passing sieve obtained by LD and wet sieving techniques are similar, except in the case of sample F5.
0 20 40 60 80 100 F1 F2 F3 F4 F5 F6 < 4 5 µ m [ % ] Sieving SIA (raw data) LD (Fraunhofer)
Fig. 4. Comparison of 45 µm passing sieve particles obtained with LD, SIA and wet sieving techniques. 0 20 40 60 80 100 F1 F2 F3 F4 F5 F6 < 6 3 µ m [ % ] Sieving SIA (raw data) LD (Fraunhofer)
Fig. 5. Comparison of 63 µm passing sieve particles obtained with LD, SIA and wet sieving techniques.
3.2. Specific surface area
Three samples of each type of filler have been analysed and Table 6 presents the results of specific surface area (SSA) obtained from N2 adsorption isotherms and air permeability (Blaine). An estimation of SSA area is also calculated from the PSD (laser) measurement, in accordance with Eq.5.
] 2 , 3 [ . 6 , D S S PSD S = ρ (5)
∑
∑
= 2 3 . . ] 2 , 3 [ i i i i d n d n D (6)The volume to surface mean diameter D[3,2] of the sample is calculated from the size
distribution curve by means of Eq.6, in which ni corresponds to the number of particles of
diameter di. These equations assume that the particles are spherical and that they are not porous.
The average values of SSA from BET analysis are greater than for Blaine. For limestone fillers F3, F5 and F6, internal porosity contributes to global surface area, specifically for very fine clay particles, for which surface can be measured by fine-scale N2 adsorption (Michel and Courard 2006). Limestone filler F4 is the finest filler we tested with high organic material content (Courard et al. 2011).Blaine method is indeed insensitive to internal porosity and is not able to take it into account in the calculation. This last remark could also explain the good correlation between specific surfaces calculated by laser diffraction and Blaine methods.
Table 6. Comparison of specific surface area SSA [m2.g-1] using multipoint N2 adsorption isotherms, laser diffraction and air permeability.
Method F1 F2 F3 F4 F5 F6
SS.Blaine 0.48 0.53 0.65 0.77 0.61 0.45
SS.PSD (laser diffraction) 0.57 0.41 0.56 0.80 0.60 0.45
SS.BET 1.3 1.2 5.5 4.0 5.7 3.7
On the basis of the experimental program and the results, the following conclusions can be drawn for the limestone fillers that have been tested here:
limestone fillers are mainly composed of strongly birefringent calcite mineral with refractive indices ranging from 1.48 to.1.66. For laser diffraction and in the case of using Mie diffusion model, the value of refractive index influences the particle size distribution. Refractive index value of 1.57 was selected as reference value. Absorption index was selected in such a way that real and calculated angular distribution of light were better fitted;
although the use of Mie or Fraunhofer models can slightly influence the shape of the relative particle size distribution, it does not significantly affect the volume weighted percentiles of limestone filler samples;
a discrepancy was observed between SIA and LD size distributions towards both the lower and upper sizes. The fact that SIA is unable to take into account particles smaller than 3 pixels in width (1.44 µm) could explain the under estimation of fine elements; the interest of wet sieving technique is to confirm the presence of 63-125 µm particles in filler samples analyzed by laser diffraction technique. The under estimation of big particles by SIA is confirmed; they are excluded from analysis due to contact with frame. It could be partially corrected by taking into account the probability of total inclusion of a particle within the image frame;
the average values of SSA from BET are greater than from Blaine. In case of F3, F5 and F6, these results can be explained by the presence of fine clay minerals;
good correlation was found between specific surface area measured by Blaine permeability tester and calculated from laser diffraction data.
On the base of these conclusions, it appears that the specific surface area and granulometry of limestone fillers may be efficiently estimated from complementary techniques. This description is absolutely needed for understanding particles behaviour in contact with water, when used in cementitous materials: water demand is for example greatly dependent on these physical characteristics. Finally, the techniques can be easily extended to other fine particles like silica fume, fly ashes or metakaolin that are also used for concrete mix design.
5. References
Brunhauer S, Deming L, Teller E. Adsorption of gas in multimolecular layers. Journal of the American Society 1938; 60: 309-319.
Carman PC. Flow of Gases Through Porous Media. Academic Press Inc., 1956.
Courard L, Michel F, Piérard J. Influence of clay in limestone fillers for self-compacting cement based composites. Construction Building Materials 2011; 25: 1356–1361.
Cyr M. Contribution to the characterization of fine particles and their impact on the rheology of cementitous matrixes. PhD Thesis 1991. University of Sherbrooke, Canada: 125p. (in French).
Diederich P, Mouret M, Ponchont F. Simple tools for achieving self-compacting ability of concrete according to the nature of the limestone filler. Construction and Building Materials 2013; 48: 840-852.
Ferraris CF, Obla KH, Hill R. The influence of mineral admixture on the rheology of cement paste and concrete. Cem. Concr. Res. 2001; 31 (2): 245– 255.
Ghezal A, Khayat KH, Beaupré D. Development of Self-Consolidating Concrete with Low Binder Content and Mineral Additives. First North American Conference on the Design and Use of Self-Consolidating Concrete. Center for Advanced Cement-Based Materials (Ed. S. P. Shah), Chicago (U.S.A.), Nov. 12-13, 2002: 77-83.
Gregoire MP, Dislaire G, Pirard E. Accuracy of size distributions obtained from single particle static digital image analysis. Proc. Partec Conf. Nürenberg 2007, 4p.
Ho DWS., Sheinn AMM, Ng CC, Tam CT, Ho DWS. The use of quarry dust for SCC applications. Cem. Concr. Res. 2002; 32: 505–511.
Meerseman J, Descamps P, Lucion C, Piérard J, Pollet V. Characterization of limestone fillers from Wallonia. Ciments, Bétons, Plâtres, Chaux 2006; 882: 29-36 (in French).
Michel F. Physical characterization of limestone fillers. Master Thesis 2006. Faculté des Sciences Appliquées, Université de liège, Belgium: 125p (in French).
Michel F, Courard L Contribution of laser granulometry to physical characterization of limestone fillers. Septième édition des Journées scientifiques du Regroupement francophone pour la recherche et la formation sur le béton (RF)2B. Toulouse, France.19-20 juin 2006: 10p (in French).
Michel F, Piérard J, Courard L, Pollet V. Influence of physico-chemical characteristics of limestone fillers on fresh and hardened mortar performance, 5th International RILEM Symposium on Self-Compacting Concrete. Proceedings PRO 54 (2007): 205-10.
Michel F, Gregoire MP, Pirard E. Size distribution of powders in range of 1-100 µm: a comparison of static digital image analysis and laser diffraction. Proc. Partec Conf. Nürenberg 2007: 4p.
Mie G. Beiträge zur Optik trüber Medien, speziell kolloidaler Metallösungen, Annalen der Physiks 1908; 25 (3): 377-445.
Niesel K. Determination of the specific surface by measurement of permeability. Materials and Structures 1973; 6(33): 227-231
Sprung S, Siebel E. Assessement of the suitability of limestone for producing portland limestone cement (PKZ). Zement-Kalk-Gips 1991; 44 (1): 1-11.
Tsivilis S, Chiotakis E, Badogiannis E, Pahoulas G, Ilias A. A study on the parameters affecting the properties of Portland limestone cement. Cem. Concr. Res. 1999; 21: 107-16.
Van der Huls HC. Light Scattering by Small Particles. Wiley, 1957.
Wills MH. How aggregate particle shape influences concrete mixing water requirement and strength, J. Mater. 1967; 2 (4): 101–11.

![Table 3. Volume weighted percentiles D V X [µm] of the size distribution obtained from laser diffraction of limestone filler for different refractive indices](https://thumb-eu.123doks.com/thumbv2/123doknet/6943876.196371/8.892.94.792.192.487/weighted-percentiles-distribution-obtained-diffraction-limestone-different-refractive.webp)

![Table 6. Comparison of specific surface area SSA [m 2 .g -1 ] using multipoint N 2 adsorption isotherms, laser diffraction and air permeability](https://thumb-eu.123doks.com/thumbv2/123doknet/6943876.196371/15.892.123.763.876.1047/comparison-specific-surface-multipoint-adsorption-isotherms-diffraction-permeability.webp)
