HAL Id: hal-03028094
https://hal.archives-ouvertes.fr/hal-03028094
Submitted on 9 Dec 2020HAL is a multi-disciplinary open access
archive for the deposit and dissemination of sci-entific research documents, whether they are pub-lished or not. The documents may come from teaching and research institutions in France or abroad, or from public or private research centers.
L’archive ouverte pluridisciplinaire HAL, est destinée au dépôt et à la diffusion de documents scientifiques de niveau recherche, publiés ou non, émanant des établissements d’enseignement et de recherche français ou étrangers, des laboratoires publics ou privés.
Shuttle Effect Quantification for Redox Ionic Liquid
Electrolyte Correlated to the Coulombic Efficiency of
Supercapacitors
Charlotte Bodin, Bongu Chandra Sekhar, Mathieu Deschanels, Sylvain
Catrouillet, Steven Le Vot, Frédéric Favier, Olivier Fontaine
To cite this version:
Charlotte Bodin, Bongu Chandra Sekhar, Mathieu Deschanels, Sylvain Catrouillet, Steven Le Vot, et al.. Shuttle Effect Quantification for Redox Ionic Liquid Electrolyte Correlated to the Coulom-bic Efficiency of Supercapacitors. Batteries & Supercaps, Wiley, 2020, 3 (11), pp.1193-1200. �10.1002/batt.202000084�. �hal-03028094�
Shuttle effect quantification for redox ionic liquid electrolyte correlated to the coulombic efficiency of supercapacitors
Charlotte Bodin[a], [c], Chandra Sekhar Bongur[a], [c], Mathieu Deschanels[a], Sylvain Catrouillet[b], Steven Le
Vot[a], [c], Frédéric Favier[a], [c] and Olivier Fontaine*[a], [c]
[a] C. Bodin, Dr. C.Sekhar Bongur, M. Deschanel, Dr. S. Le Vot, Dr. F. Favier, Dr. O. Fontaine, Agrégats Interfaces et Matériaux pour l’Energie, Institut Charles Gerhardt, Université de Montpellier, Place Eugène Bataillon, 34095 MONTPELLIER Cedex, France
E-mail: olivier.fontaine@umontpellier.fr
[b] Dr. S. Catrouillet, Ingénierie et Architectures Macromoléculaires, Institut Charles Gerhardt, Université de Montpellier, Place Eugène Bataillon, 34095 MONTPELLIER Cedex, France
[c] C. Bodin, Dr. C. Bongur, Dr. S. Le Vot, Dr. F. Favier, Dr. O. Fontaine, Réseau sur le Stockage de l’Energie Electrochimique (RS2E), 80039 Amiens Cedex, France
The use of redox active electrolyte is a good opportunity to increase the energy density of supercapacitors, the main limitation of this technology. The addition of redox molecules allows the storage of charge in the electrode and in the electrolyte. The key to keep the increase of charge is to avoid the shuttle effect of the redox molecule. Indeed, once the molecule is oxidized or reduced, it diffuses across the cell to react at the surface of the opposite electrode and the stored charge is lost. Is this shuttle effect however damageable for the device? This study proposes to answer this question by quantifying the shuttle effect and correlating it to the decrease of Coulombic efficiency of supercapacitors.
Introduction
In their field, supercapacitors have a lower energy density than batteries (20 times lower) but a much greater maximum power (10 times).[1] However, the search for devices with both high energy density and high
maximum power remains an important challenge for all scientists in this field.
In the field of electrochemical double layer capacitor (EDLC), the state of the art offers an alternative based on redox molecules dissolved in the electrolyte to enhance the storage of electrical charges. As far as we know, the pioneering work is that of Frackowiak et al. devoted on the development of a redox active aqueous electrolyte with potassium iodide (KI) and vanadyl sulfate (VOSO4).[2] Device performance was great but the
high-cost ion selective membrane (Nafion) used to avoid the crossover of redox species somehow tempered the success of this proof of concept. More recently, Boettcher et al. investigated redox-based EDLC supercapacitor using viologen and halides couples in an aqueous electrolyte for the negative and the positive electrodes, respectively.[3] After testing various halides and viologens, reported performance was beyond the
state-of-the-art, including a low self-discharge despite the absence of any ion-selective membrane.
The redox active electrolyte approach, although very attractive, has two identified limitations: (1) the self-discharge is usually strong and (2) shuttle effects affect the performances.[4] Redox ionic liquids are good
opportunities to address these two issues.[5] Some of us were the first to develop redox ionic liquids while not
considering them for operation in devices. It is only from the work of Rochefort et al. that the first applications of redox ionic liquids are considered for batteries and supercapacitors.[6]
However, depending on the nature of the redox ionic liquid, the shuttle effect may still remain, especially if the molecule has no particular adsorption or confinement within the porosity of the electrode material. In such a case, the scientific question is: how many times does the redox shuttle have to go back and forth before highly impacting the coulombic efficiency? To answer this question, we propose the study of the shuttle effect of a redox ionic liquid, 4-methylimidazolium-2,2,6,6-tetramethylpiperidine 1-oxyl (TEMPOIm)
+ TFSI-. In this study, the number of shuttles of the redox molecule is correlated to the decrease of coulombic
efficiency of the device. To calculate the number of shuttles, the Fick’s law is used, which means that the redox molecule diffuseslinearly in a continuous medium. First, the diffusion of TEMPO moieties is studied to confirm the diffusional behaviour of the molecules. Then the diffusion is correlated with the properties of the electrolyte that depend on its viscosity and ionic conductivity.
Figure 1. Scheme of shuttle effect (a) formation of electrochemical double layer at electrodes surface (b)
electronic transfer from redox ionic liquid to positive electrode (c) formation of gradient diffusion of redox ionic liquid, reduced form to the positive electrode and oxidized form to the negative electrode (d) shuttle effect: the molecule previously oxidized is reduced at the negative electrode (e) galvanostatic measurement.
Results and Discussion
Diffusion coefficient of TEMPO moieties
(TEMPOIm)+ TFSI- is electrochemically characterized and compared to commercial TEMPO. Figure 2
exhibits the cyclic voltammetry (CV) profiles of these molecules solubilized in NEt4+ BF4- at 0.5 mol·l-1 in
acetonitrile (Figure 2a) and in BMIm+ TFSI- ionic liquid (Figure 2c). In both electrolytes, the TEMPO (black
line) is oxidized as TEMPO+ at the potential of 0.29 V vs Fc/Fc+, then reduced back as TEMPO at 0.22 V vs
Fc/Fc+ by a reversible single electron transfer step. Similarly, the (TEMPOIm)+ TFSI- (dashed line) is also
oxidized as (TEMPOIm)2+ TFSI- at 0.33 V vs Fc/Fc+ and reduced back as (TEMPOIm)+ TFSI- at 0.26 V vs
Fc/Fc+. The difference of redox potential between TEMPO and (TEMPOIm)+ TFSI- about 0.04V could be
explained by an impact of the imidazolium grafted on the TEMPO. The imidazolium is positively charge so the addition of a second positive charge by the oxidation of (TEMPOIm)+ needs a greater energy leading to a
higher potential. CV shapes are characteristics of the diffusional behavior of the redox molecules.[7] The
potential difference between current peaks of oxidation and reduction, ΔEEp, is 70 mV for all CVs, proving the
reversibility of these redox systems.[8] Figures 2b and 2d compare the values of current peak in oxidation
depending on the scan rate, for NEt4+ BF4- at 0.5 mol·l-1 in acetonitrile and BMIm+ TFSI- respectively, with
TEMPO (plain square) and (TEMPOIm)+ TFSI- (open square). Current values form linear lines between
2.5·10-2 V·s-1 and 1 V·s-1. The apparent diffusion coefficient, D
app, proportional to the line slope, is greater for
TEMPO compared to (TEMPOIm)+ TFSI- in both electrolytes. This discrepency can be assigned to molecule
size difference. TEMPO is a smaller molecule than (TEMPOIm)+ TFSI-, and , as such, diffuses faster than the
larger one.[9]
Figure 2. (a) and (c) Cyclic voltammetry at 0.1 V·s-1 of an electrolyte containing TEMPO (solid line) or
(TEMPOIm)+ TFSI- (dot line) at 2·10-3 mol·l-1 on a glassy carbon electrode (Ø 3 mm). (b) and (d) Oxidation
peak current as a function of the square root of the scan rate for TEMPO (plain square) and (TEMPOIm)+
TFSI- (open square). The electrolytes are (a) and (b) NEt
4+ BF4- at 0.5 mol·l-1 in ACN and (c) and (d) BMIm+
TFSI-. -0.4 -0.2 0.0 0.2 0.4 0.6 0.8 -4 -2 0 2 4 6 (c) BMIm+ TFSI -i ( µA ) E vs Fc/Fc+ (V) TEMPO (TEMPOIm)+ TFSI --0.2 0.0 0.2 0.4 0.6 0.8 -40 -20 0 20 40 NEt4+ BF4- 0.5 M ACN i ( µ A ) E vs Fc/Fc+ (V) TEMPO (TEMPOIm)+ TFSI -(a) 0.0 0.4 0.8 1.2 0 40 80 120 (b) NEt4 + BF 4 - 0.5 M ACN TEMPO (TEMPOIm)+ TFSI -Ip ox ( µ A ) 1/2 (V1/2 s-1/2) 0.0 0.4 0.8 1.2 0 5 10 15 (d) BMIm+ TFSI -TEMPO (TEMPOIm)+ TFSI -Ip ox ( µ A ) 1/2 (V1/2 s-1/2)
The size of the molecule is not the sole factor influencing the diffusion coefficient of redox molecules. Indeed, the physico-chemical properties of the electrolyte (conductivity, viscosity) are critical parameters for characterizing the diffusion properties of redox molecules.[10]
Influence of viscosity and molar conductivity on the apparent diffusion coefficient
To characterize the properties of bulk electrolytes, five concentrations of BMIm+ TFSI- were chosen from 1
mol·l-1 in acetonitrile to pure ionic liquid (which corresponds to 3.4 mol·l-1). The concentration of
(TEMPOIm)+ TFSI- was increased (compared to 2·10-3 mol·l-1 previously) to observe the Faradaic
contribution of the redox ionic liquid in the device. All solutions include (TEMPOIm)+ TFSI- at 0.1 mol·l-1.
To characterize these electrolytes, an ultramicroelectrode (UME) is used as working electrode.[11] This
electrode has a much smaller diameter than an usual macroelectrode (10 µm in our case against 3 mm). With UME, the EDLC contribution is drastically reduced and does not interfere with measured signal. Then, at the potential of the redox couple, an increase in current is visible up to a plateau due to the steady state (all species in the diffusion layer have reacted), Figure 3a. From this plateau, the limit current is extracted for each concentration of BMIm+ TFSI- and used to calculate the apparent diffusion coefficient of the
(TEMPOIm)+ using the Stokes-Einstein equation (Eq. 1).[12]
i
l=
4 . z . F . D
app.C . r
(Eq. 1)n corresponds to the number of electrons exchanged, F is the Faraday constant in C·mol-1, D
app is the
apparent diffusion coefficient in m2·s-1, C represents the concentration of redox ionic liquid in the electrolyte
in mol·m-3 and r is the radius of the ultramicroelectrode in m.
Figure 3. (a) CV with Pt UME (Ø 10 µm) at 0.1 V·s-1, a Pt wire as counter electrode and a silver wire as
reference. The electrolytes are composed of (TEMPOIm)+ TFSI- at 0.1 mol·l-1 with various concentrations of
BMIm+ TFSI- in acetonitrile. (b) Apparent diffusion coefficient (solid squares) and molar ionic conductivity
(open circle) depending on the BMIm+ TFSI- concentration. (c) Apparent diffusion coefficient and viscosity
of the solutions (white circle) depending on the BMIm+ TFSI- concentration. (d) Apparent diffusion
The Figure 3a shows the CV measured with a platinum UME at 0.1 V·s-1 for each electrolyte. The current is
zero for the applied potential from 0.2 V to 0.6 V vs Ag/Ag+ for tested solutions. This potential zone
corresponds to the formation of the electrochemical double layer. Then, in the whole electrolyte series, the current increases with a significant slope between 0.6 V and 0.8 V vs Ag/Ag+. This step corresponds to the
electronic transfer during the oxidation of (TEMPOIm)+. Above 0.8 V vs Ag/Ag+, the slope is decreasing and
the curve could be considered as a plateau. It corresponds to the mass transfer of redox molecules to the surface of the UME. Since the current is not quite constant, the regime is not fully stationary. Limit current of the plateau (measured at the potential of 1.3 V vs Ag/Ag+) increases when BMIm+ TFSI- concentration
decreases. Apparent diffusion coefficients, Dapp, were calculated from these limit current values using (Eq. 1).
As such, the apparent diffusion coefficient decreases while increasing BMIm+ TFSI- concentration, as shown
in Figure 3b.Figure 3b and Figure 3c depicts the diffusion coefficients as a function of the BMIm+ TFSI
-concentration. Figure 3b also shows that Dapp and the molar conductivity (open squares) which decreasethe
same way as the salt concentration increases. Figure 3c compares Dapp with the viscosity of the electrolyte.
The viscosity gradually increases from 0.7 and 4.6 mPa·s for diluted solutions with salt concentrations from 1 to 2.5 mol·l-1). The viscosity for pure BMIm+ TFSI- is 44 mPa·s. When the diffusion coefficient is
expressed as a function of the inverse of viscosity, Figure 3d, a straight line with a slope of 3.6 ·10-7 cm2·mPa
is obtained. The diffusion coefficient is therefore correlated with both viscosity and molar conductivity. Table 1 summarizes the physical characteristics of each BMIm+ TFSI- solutions depending on its
concentration. The solvation radius (rsol) is calculated from apparent diffusion coefficient values determined
at corresponding limit current values (UME), (Eq. 2), where kB is the Boltzmann constant and T (K) the
temperature.[12]
r
sol=
k
B∙ T
6 ∙ π ∙ η ∙ D
app(Eq. 2)
Overall, the value of the rsol decreases with the diffusion coefficient and the increase in viscosity. However,
the order of magnitude of the solvation radius is the same (about 4 nm).
In this section, the critical correlation between diffusion coefficient and viscosity is highlighted. The next section is about the charge storage with respect to the characteristics of prepared electrolytes. The objective is to determine if one of them is leading to better charge storage (in the sense of a larger quantity of charges). For this purpose, the parameter studied is the electrical charge Q normalized by the electrode mass.
Impact of the diffusion coefficient of (TEMPOIm)+ TFSI- on the electrical charge of a porous electrode
The electrical charge of the working electrode is measured in a three-electrode cell to limit the redox shuttle effect by applying a large distance between the working electrode and the counter electrode to measure the impact of the physical and chemical properties of the electrolyte on the electrical charge. The study of redox shuttles is reported in the next section using two-electrode cell with controlled thickness separating the electrodes. CVs are performed under inert atmosphere with a cell composed of self-supporting porous carbon electrodes. The counter electrode has a loading at least three times greater than that of the working electrode.
Table 1. Physical properties of electrolytes at different concentrations of BMIm+ TFSI- in acetonitrile
[BMIm+ TFSI-] [BMIm+ TFSI-] (%wt) D
app (cm2·s-1) η[a] (mPa·s) Λ [a] (S·m2·mol-1) rsol (nm)
1 mol.l-1 30 5.1·10-7 0.75 4.0·10-5 5.6 1.5 mol.l-1 45 3.0·10-7 1.2 2.6·10-5 5.9 2 mol.l-1 60 2.3·10-7 2.1 1.7·10-5 4.5 2.5 mol.l-1 75 1.1·10-7 4.6 8.3·10-6 4.1 3.4 mol.l-1 (pur) 100 1.6·10-8 44 1.2·10-6 3.1 [a] Measurement at 20 °C.
Figure 4. (a) CVs with porous carbon based electrodes and a silver wire as reference. The supporting
electrolyte is BMIm+ TFSI- at 1 mol·l-1 in acetonitrile (dashed line) and with the addition of 0.1 mol·l-1 of
(TEMPOIm)+ TFSI- (green line). (b) CVs with porous carbon based electrodes with various concentrations of
BMIm+ TFSI- in acetonitrile. The electrolytes contain (TEMPOIm)+ TFSI- at 0.1 mol·l-1. (c) Apparent
diffusion coefficient (solid squares) and electrical charge (open circle) depending on the BMIm+ TFSI
-concentration. (d) Viscosity (solid squares) and electrical charge (open circles) of the solutions depending on the BMIm+ TFSI- concentration.
Figure 4a details the CV measured in 1 mol·l-1 of BMIm+ TFSI- in acetonitrile (dotted black) electrolyte
before and after addition of 0.1 mol·l-1 of (TEMPOIm)+ TFSI- (light green). The Faradaic contribution (0.6 V
to 1.2 V vs Ag/Ag+) comes along with the capacitive contribution (0 V to 0.6 V vs Ag/Ag+). This
superposition is supported by considering the purely capacitive curve when no redox molecule is present in the solution (dashed black). An increase of 0.7 mA is observed thanks to the Faradaic contribution. CVs corresponding to (TEMPOIm)+ TFSI- at 0.1 mol·l-1 solutions with the various BMIm+ TFSI- concentrations
are shown in Figure 4b. The current is normalized by the mass of active material in the working electrode. At concentrations of 1 and 1.5 mol·l-1 of BMIm+ TFSI-, CVs are almost identical and the Faradaic contribution
is supposed to be the same. A slight shift in redox potential about 60 mV is observed for the electrolyte at 2 mol·l-1 (blue curve), Figure 4b. The fact that there is only one curve with a redox potential shift suggest a
shift of the reference Ag/Ag+ during the measure. On the other hand, when the concentration of BMIm+ TFSI
-was increased, the current peak and the peak-to-peak separation corresponding to the Faradaic contribution decreased. For pure ionic liquid, no current peak is visible (Figure 4a dashed curve).
The charge calculated from CV measurements in the three-electrode cell is plotted in Figure 4c as a function of BMIm+ TFSI- concentration and compared to the apparent diffusion coefficient. The observed charge and
the diffusion coefficient decrease while BMIm+ TSFI- concentration increases that corresponds to an increase
in electrolyte viscosity (Figure 4d).
The Faradaic contribution in the most viscous electrolyte (BMIm+ TFSI- containing (TEMPOIm)+ TFSI-) is
almost zero. However, it is in this electrolyte that the diffusion coefficient is the lowest, and therefore also the one for which the redox shuttle effect should be the lowest. The effect of the redox shuttle can be quantified by calculating the number of shuttles back and forth between the two opposite electrodes. The objective is to correlate the number of shuttle back and forth made by the redox active ion with the coulombic efficiency of the device. It should allow to estimate the charge loss by the device because of these shuttles.
Quantification of the number of shuttles of the (TEMPOIm)+ and its impact on coulombic efficiency
It has been shown that the redox molecule (TEMPOIm)+ has a diffusional behavior (Figure 2). When the
molecule is oxidized at, a concentration gradient of oxidized and reduced molecules is established from the electrode-electrolyte interface toward the electrolyte bulk. This concentration gradient is limited to a certain distance from the electrode assigned as the diffusion layer δ. The time needed for molecules to diffuse from
one electrode to the other one can be calculated. In this case, the diffuse layer corresponds to the distance between the electrodes i.e. the thickness of the separator. From the diffusion coefficient of the redox molecule and the thickness of the separator, the time, t1, to diffuse from one side of electrode to the other side
is calculated with the (Eq. 3):
δ=
√
π ∙ D
app∙ t
1 (Eq. 3)Knowing the time of diffusion from one electrode to the other, the number of shuttle back and forth made by the redox cation (TEMPOIm)+ can be calculated and correlated to the performance of the device. Among the
main performance indicators for a supercapacitor are Coulombic efficiency, power, energy, energy efficiency and lifetime. Coulombic efficiency is particularly affected by the redox shuttle effect, so it is on this parameter that we focused. The setup used is a Swagelok cell with two porous carbon electrodes and a separator in between of a defined thickness about 130 µm.
Figure 5. (a) The time of a single back and forth shuttle is calculated according to the diffusion coefficient
(log-log scale) for various separator thicknesses. The orange rectangle illustrates the value scales for laboratory systems of diffusion coefficients and separator sizes used.[13] (b) Electrolyte diffusion coefficient
as a function of BMIm+ TFSI- concentration diluted in acetonitrile with respect to the corresponding time for
a single shuttle (one back and forth) of the redox molecules, calculated for a separator thickness of 130 µm (experimental value).
The relationship between the diffusion time, t2 (t2 = 2 * t1), required for a back and forth shuttle of the redox
molecules and the apparent diffusion coefficient is depicted on Figure 5a as calculated from Eq. 2. It shows in log-log scale the time of a single back and forth shuttle depending on diffusion coefficient values and separator thicknesses. For example, for a diffusion coefficient of 10-8 cm2·s-1 and a separator of 130 µm, the
time for a back and forth shuttle of the molecule between the electrodes is 1.104 s (t
2 = 2*(130·10-4)2 / (π*10 -8)). As the relationship (Eq. 2) shows, the time for a back and forth shuttle is inversely proportional to the
diffusion coefficient. The thicker the separator, (i.e. the distance between the two electrodes), the longer the time required for a back and forth shuttle. In this figure, the orange rectangle corresponds to the usual thicknesses of separators used for supercapacitors: from 25 µm (Celgard) to 500 µm (Whatman glass fiber) and typical values of diffusion coefficient observed for a redox molecule (as an example for TEMPO) in ionic liquid media such as BMIm+ TFSI- or solvent such as ACN.[13-14] Figure 5b shows the time for a back
and forth shuttle through a 130 µm thick separator versus diffusion coefficients in the usually reported range. The greater the BMIm+ TFSI- concentration, the longer the diffusion time. For pure BMIm+ TFSI-, a
calculated duration of almost 7000 s is out of scope when using a supercapacitor device.
By performing galvanostatic measurements, it is possible to distinguish the Faradaic contribution from the purely capacitive contribution and to extract a characteristic time from it. This time corresponds to the total time of diffusion of the redox molecule tc. From this time and the time required for a single back and forth
shuttle of a redox molecule, t2, the number of back and forth shuttle of the molecule can be calculated.
Calculation details are given in the supplementary information section. This number of shuttles has been correlated to the Coulombic efficiency of the device.
Figure 6. Galvanostatic measurements for a device with two porous carbon electrodes. The electrolyte is
composed of 0.1 mol·l-1 (TEMPOIm)+ TFSI- with different concentrations of BMIm+ TFSI- in acetonitrile.
The current density applied is (a) 0.5 A·g-1 and (b) 0.05 A·g-1 (c) 0.02 A·g-1 (d) 0.01 A·g-1.
Correlation between the Coulombic efficiency of a supercapacitor and the number of back and forth shuttles of a redox shuttle
To determine the impact of the redox shuttle effect on the performance of a supercapacitor, galvanostatic measurements were conducted using a two-electrode Swagelok device. For this purpose, porous carbon electrodes coated on an aluminum current collector (see details in experimental part) and a 130 µm thick cellulose separator were used. Measurements in galvanostatic mode were performed for currents between 1.5 A·g-1 and 0.01 A·g-1.[15] Figure 6 shows the galvanostatic curves for current densities at 0.5 A·g-1, 0.05 A·g-1,
0.02 A·g-1 and 0.01 A·g-1.
Figure 6a (i = 0.5 A·g-1) shows that all electrolytes containing 0.1 mol·l-1 (TEMPOIm)+ TFSI- and BMIm+
TFSI- diluted in acetonitrile have a similar charge/discharge time. The electrolyte of pure BMIm+ TFSI- has a
shorter charge/discharge time than diluted electrolytes. The galvanostatic curves have a triangular shape, typical of a supercapacitor. For a lower current at 0.05 A·g-1 (Figure 6b) limited variations of
charge/discharge times are visible depending on the concentration. There is a difference of 130 s on charging time between the measurement for pure BMIm+ TFSI- and electrolytes at 2.5 and 2 mol·l-1. Again, a
difference of 200 s in charging time is observed between electrolytes at BMIm+ TFSI- 2.5 and 2 mol·l-1 and
those at 1.5 and 1 mol·l-1. When the applied current was further decreased, the differences in charging time
between the electrolytes increase, Figure 6c and 6d. As the current decreases, a change in slope appears on the galvanostatic curves as the voltage approaches 2.8 V. This is observable for the application of a current of 0.05 A·g-1, Figure 6b. The phenomenon is more pronounced with the decrease in applied current (0.02 A·g-1),
Figure 6c, until plateaus are obtained when the current decreases down to 0.01 A·g-1, Figure 6d. The cell
voltage required (2.8 V) is never reached for the BMIm+ TFSI- at 1 mol·l-1 (Figure 6d, light green curve). The
observation of different slopes in galvanostatic mode on a supercapacitor indicates Faradaic reactions occuring.
The total diffusion time, tc, considered for calculating the number of back and forth shuttles of the redox ion
is the charging time between 1.4 V and 2.8 V, Figure 7a. The voltage of 1.4 V corresponds to the change in slope on the galvanostatic curves, the Figure 7a is given as an example of it. The number of redox shuttles is determined and reported in Figure 7b for the BMIm+ TFSI- electrolyte diluted to 1 mol·l-1. In this electrolyte,
a single shuttle is observed for an applied current density of 0.2 A·g-1. The applied current is quite low for
operating a supercapacitor: the tests reported in the literature can go up to more than 10 A·g-1, however for
such high currents, Faradaic reactions do not have time to occur in the present case.[16] For a current density
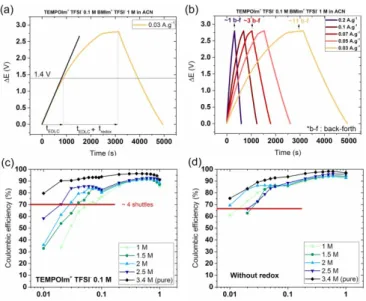
Figure 7. (a) and (b) Galvanostatic measurements for a device with two porous carbon electrodes. The
electrolyte is containing (TEMPOIm)+ TFSI- at 0.1 mol·l-1 in BMIm+ TFSI- at 1 mol·l-1 in acetonitrile with
current densities of (a) 0.03 A·g-1 and (b) 0.03, 0.05, 0.07, 0.1 and 0.2 A·g-1. (c) and (d) Coulombic efficiency
associated to the galvanostatic measurements (c) with and (d) without (TEMPOIm)+ TFSI- at 0.1 mol·l-1.
Coulombic efficiency is the ratio of discharge time to charging time. Less than 100% means that a part of the charges stored are not recovered during discharge. Coulombic efficiencies of the devices are shown as a function of the applied current in Figure 7 for electrolytes with different concentrations of BMIm+ TFSI- (7d :
“without redox”) and with the addition of 0.1 mol·l-1 of (TEMPOIm)+ TFSI- (7c). The loss of Coulombic
efficiency begins at greater currents in the presence of redox molecules, 70% at 0.06 A·g-1 for the 1 mol·l-1
BMIm+ TFSI- electrolyte, Figure 7d, than without redox molecule, 73% at 0.03 A·g-1 for the 1.5 mol·l-1
BMIm+ TFSI- electrolyte. The addition of (TEMPOIm)+ TFSI- speed-up the Coulombic efficiency fading.
For all applied currents corresponding to 4 shuttles, the Coulombic efficiency dropped down to 70 % ± 5 %. This means that a 30 % loss of Coulombic efficiency was observed after 4 shuttles of the redox molecules. This observation could be extended to any redox molecule with diffusional behavior (no adsorption at the electrode surface as an example).
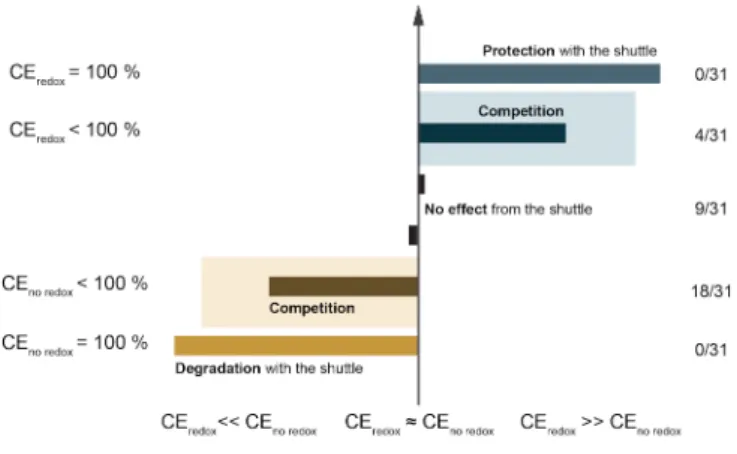
To go further, the different impacts of the shuttle effect on the device were categorizing: (i) protection (ii) degradation (iii) or competition favourable or (iv) unfavourable to the device. These impacts are depicted on Figure 7. The term protection is used to mean that the coulombic efficiency of the device is not degraded at all with the addition of redox ionic liquid compare to a degradation with redox free electrolyte (CEredox =
100%). The redox ionic liquid provides a full protection by avoiding degradation of electrolyte at same potential. The second case presented is the opposite: the addition of redox shuttle degrades the electrolyte but no degradation is observed with redox free electrolyte (CEnoredox = 100%). When these two phenomena are
observed, there is a competition. If the coulombic efficiency is better with the addition of redox ionic liquid, what means there is degradation of the electrolyte but the RIL protects in part the device (CEredox < 100% and
CEredox >> CEno redox). In the other case, the RIL precipitates the degradation of the RIL, a situation to avoid
(CEnoredox < 100% and CEredox << CEnoredox).. The last case that could be observed is no effect of the addition
of RIL (CEredox ≈ CEnoredox)., the coulombic efficiency is similar with and without RIL. Statistically speaking,
our case is more corresponding to a decrease of the coulombic efficiency with the addition of RIL but with also a degradation of the electrolyte (18 measures on 31 in totality). So far, the redox shuttle is damaging the device in our conditions. One step further is to find which conditions are needed to protect the device with the addition of RIL. The protection of overcharge by using RIL has been study for batteries[17] but could be a
Figure 8. Classification of different impacts of the redox shuttle on the coulombic efficiency (CE) of
supercapacitor and statistics of measurements realized. The proportion (y/x) on the left are: (x) the number of coulombic efficiencies calculated for different current density and (y) electrolyte and the number of CE corresponding to the aligned case.
Conclusions
In this study, the TEMPO molecule functionalized with an imidazolium ion has a diffusional behavior leading to a loss of stored redox charges because of a shuttle effect between electrodes during the charge of the device. The impact of the shuttle effect on the Coulombic efficiency is quantifiable. In this case, 4 shuttles result in a 30% loss of Coulombic efficiency.
This observation can be generalized. The redox shuttle effect is highly dependent on the diffusion coefficient of the redox molecule. The diffusion coefficient reflects the viscosity and molar conductivity of the electrolyte. It is therefore useful to determine the conditions needed to limit the redox shuttle effect and the loss of Coulombic efficiency. This also allows applying our conclusions to the use of other redox molecules and other supporting electrolytes as long as there are no specific interactions between the molecule and the electrode. The charging (or diffusion) times given are for a diffusion/separator size layer of 130 µm.
The use of a viscous medium such as BMIm+ TFSI- avoids the redox shuttle effect. The diffusion coefficient
is limited (10-8 cm2·s-1) which generates a very long diffusion time (6840 s for a distance of 130 µm). This
time constant is way too long to be realistic in a supercapacitor and any redox shuttle effect will never be encountered. However, the use of a viscous electrolyte is detrimental to the power of the device.
A diffusion coefficient of 10-7 cm2·s-1 is a good compromise, the charging times are faster than in the present
case and the current density limit is 0.03 A·g-1 to avoid the Coulombic efficiency fading. For diffusion
coefficients from 2·10-7 to 5·10-7 cm2·s-1, it is necessary to avoid slow cycling (current density < 0.08 A·g-1)
which would allow the diffusion of redox molecules and the loss in Coulombic efficiency.
Experimental Section Synthesis of ionic liquids
The 4-hydroxy-TEMPO, bromotrimethylsilane (TMSBr) and methylimidazole (MIm) were provided by Sigma Aldrich. The precursors 1-butyl-3-methylimidazolium chloride and lithium bis(trifluoromethanesulfonyl)imide (LiTFSI) supplied by Iolitec. For the synthesis of 1-methyl-3-imidazolium-TEMPO bis(trifluoromethanesulfonyl)imide, Figure 1, 4-hydroxy-TEMPO was dissolved in a minimum volume of anhydrous acetone under argon atmosphere. The bromotrimethylsilane (5 eq.) was added drop per drop. The mixture was stirring during 24 h at room temperature. The excess of bromotrimethylsilane was removed as well as the sub-product trimethylsilanol under vacuum. The obtained product was a brown batter. It was solubilized in dichloromethane before the addition of the methylimidazole. The slurry was stirring during 24 h at 45 °C. The solvent was removed with rotating evaporator. Afterwards, the metathesis was performed by solubilizing separately the obtained product and LiTFSI (1.2 eq.) in water. The two solutions were mixed and stirred during 2h at room temperature. Then, liquid-liquid extraction was performed to collect the organic phase. The aqueous phase was washed with dichloromethane three times. The organic layer was dried over magnesium sulfate and the solvent was
removed with rotating evaporator. The obtained product was a little viscous red liquid. The (TEMPOIm)+
TFSI- is characterized by DSC, TGA and IR in supplementary information.
The butylmethylimidazolium bis(trifluoromethanesulfonyl)imide were also synthesized. The components are separately dissolved in water then mixed and stirred during 12 h. The result ionic liquid is extracted with dichloromethane. The organic phase is washed with pure water three times to remove the sub product LiCl and dried with magnesium sulfate before removing the solvent with a rotary evaporator. The obtained product is still a transparent liquid.
Conductivity and viscosity measurement
To determine the molar ionic conductivity, a conductivity cell with a cell constant is used to measure the impedance of each solution. The cell constant, k, is 1.8 cm-1. To determine the ionic conductivity, σ, in S·cm -1, of the solutions, the calculation
σ =k /R
is carried out with the electrical resistance R (Ohms) extractedfrom the impedance measurements. The molar conductivity Λ corresponds to the ionic conductivity divided by the concentration of the solution. All measurements are made in a glove box at 20 °C with an Ametek Princeton Applied Research potentiostat.
The viscosity of the solutions is measured with a Couette rheometer (cylinder) at a controlled temperature of 20 °C. The viscosity measurements correspond to an average of 4 measurements made for the shear gradients of 10, 20, 40 and 50 s-1.
Electrochemical characterization
Electrochemical characterizations with three-electrode cell were performed in a glove box using an Ametek Princeton Applied Research potentiostat. The working electrode used was glassy carbon, the counter electrode was a platinum rod and the reference electrode was a silver wire. The working electrode was polished with alumina 0.3 µm and cleaned with water then ethanol before each experiment. The apparent diffusion coefficient was determined by using ultramicroelectrode (UME) in platinum with a diameter of 10 µm. The reference and counter electrode were a silver wire and a platinum wire respectively. The UME was polished with alumina 0.3 µm then rinsed with ultrapure water and ethanol before each experiment. The cyclic voltammetry were performed at 100 mV·s-1 with a sweep potential from 0.2 V to 1.3 V vs Ag/Ag+.
For cyclic voltammetry presented figure 3, three-electrode cell composed of self-supporting porous carbon electrodes were used. The electrodes were constituted of PICACTIF as activated material, acetylene black and polytetrafluoroethylene (60 wt % dispersion in water) as binder with a ratio of 75:15:10 respectively. Firstly, powders were dispersed in ethanol, the polytetrafluoroethylene was added. The ethanol was removed at 50 °C, then the mixture is spread out on a glass plate until the thickness reach 150 µm. Diameter of the self-supported film (electrodes) was 6 mm for the working electrode and 10 mm for the counter electrode. Electrodes were pressed into a stainless steel grid at 10 T.
For device experimentation, a two-electrode Swagelok was used with porous carbon electrode. The electrodes were constituted of PICACTIF as activated material, acetylene black and polyvinylidene fluoride as binder with a ratio of 75:15:10 respectively. Firstly, an ink was formulated by dissolving the polymer PVdF in NMP during 1 h at room temperature. Then the two carbons were added and the ink was stirred during 1 h at room temperature followed by 1 h in ultrasonic bath. Secondly, the ink was coated on a current collector. For the working electrode, the ink was coated on aluminium foil with a doctor blade at 200 µm. The dried thickness is about 60 µm (± 10µm). For the counter electrode, the ink was coated on copper foil with a doctor blade at 500 µm. The dried thickness is about 130 µm (± 10µm). Finally, the coating was dried at 90 °C during 12 h. The coating was punched at a diameter of 9.5 mm to make electrodes. The separator used is Whatmann cellulose paper previously dried under vacuum at 80 °C during 12 h. The thickness of the separator Is about 130 µm.
Acknowledgements
This work was conducted within the framework of RS2E and the Direction Générale de l’Armement (DGA). C. B. is grateful to the DGA for financial support.
Keywords: efficiency • electrolyte • redox ionic liquids • shuttle effect • supercapacitors
[1] B. Dunn, H. Kamath, J.-M. Tarascon, Science 2011, 334, 928-935.
[2] E. Frackowiak, K. Fic, M. Meller, G. Lota, ChemSusChem 2012, 5, 1181-1185.
[3] S.-E. Chun, B. Evanko, X. Wang, D. Vonlanthen, X. Ji, G. D. Stucky, S. W. Boettcher, Nature
Communications 2015, 6, 7818.
[4] aB. Evanko, S. W. Boettcher, S. J. Yoo, G. D. Stucky, ACS Energy Letters 2017, 2, 2581-2590; bJ. Lee, P. Srimuk, S. Fleischmann, X. Su, T. A. Hatton, V. Presser, Progress in Materials Science 2019, 101, 46-89.
[5] aE. Mourad, L. Coustan, P. Lannelongue, D. Zigah, A. Mehdi, A. Vioux, S. A. Freunberger, F. Favier, O. Fontaine, Nat Mater 2017, 16, 446-453; bC. Bodin, E. Mourad, D. Zigah, S. Le Vot, S. A. Freunberger, F. Favier, O. Fontaine, Faraday Discussions 2018, 206, 393-404.
[6] aJ. C. Forgie, S. El Khakani, D. D. MacNeil, D. Rochefort, Physical Chemistry Chemical Physics 2013,
15, 7713-7721; bH. J. Xie, B. Gélinas, D. Rochefort, Electrochemistry Communications 2016, 66,
42-45.
[7] N. Elgrishi, K. J. Rountree, B. D. McCarthy, E. S. Rountree, T. T. Eisenhart, J. L. Dempsey, Journal of
Chemical Education 2018, 95, 197-206.
[8] R. S. Nicholson, Analytical Chemistry 1965, 37, 1351-1355.
[9] W. Wang, R. Balasubramanian, R. W. Murray, The Journal of Physical Chemistry C 2008, 112, 18207-18216.
[10] R. Balasubramanian, W. Wang, R. W. Murray, Journal of the American Chemical Society 2006, 128, 9994-9995.
[11] C. A. Brooks, A. P. Doherty, Electrochemistry Communications 2004, 6, 867-871. [12] A. J. Bard, L. F. Faulkner, 1981, 85, 1085-1086.
[13] P. Simon, T. Brousse, F. Favier, Supercapacitors Based on Carbon or Pseudocapacitive Materials, Vol.
3, 2017.
[14] D. Zigah, J. Ghilane, C. Lagrost, P. Hapiot, The Journal of Physical Chemistry B 2008, 112, 14952-14958.
[15] A. Noori, M. F. El-Kady, M. S. Rahmanifar, R. B. Kaner, M. F. Mousavi, Chemical Society Reviews
2019.
[16] M. Vijayakumar, D. S. Rohita, T. N. Rao, M. Karthik, Electrochimica Acta 2019, 298, 347-359. [17] B. Gélinas, T. Bibienne, M. Dollé, D. Rochefort, Journal of Power Sources 2017, 372, 212-220.