6361
The distribution, abundance, and habitat preference of
lovebirds Agapornis pullaria in Tiortyu riparian
vegetation
*Egwumah, P.O.,1 Agbelusi, E.A.2 and Egwumah, F.A.11 Department of Wildlife and Range Management, University of Agriculture Makurdi, Benue State Nigeria.
2 Department of Eco- tourism and Wildlife Management Federal University of Technology Akure, Ondo State Nigeria.
*Corresponding author: [email protected], phone: +2348053100012
Original submitted in on 7th November 2013. Published online at www.m.elewa.org on 30th April 2014.
http://dx.doi.org/10.4314/jab.v76i1.7
ABSTRACT
Objectives: Intensive agriculture and human exploitation of timber are the main threat to Lovebirds (Agapornis pullaria) distribution and abundance in Tiortyu riparian vegetation in Nigeria
Methodology and Results: Four Vegetation micro-habitats in Tiortyu riparian environment; Forestland vegetation (FLV), Woodland savannah (WLS), Grassland Savannah (GLS), and Cultivated Land (CL) were sampled for 12 months to investigate the distribution, abundance and habitat preference of lovebird Agapornis pullaria. Point count census technique was adopted and data were collected at fortnight interval. Within the period of investigation 26 birds in FLV, 5 in WLS, 2 in GLS were counted and no bird was counted in cultivated land. Lovebird varied significantly (P < 0.05) in Forestland vegetation than any other micro-habitat, while their population was significantly (P < 0.05) influence by late rainy season (August – October).
Conclusion and application of the findings: Intensive agriculture and excessive exploitation of timber and other flora resources pose imminent danger to lovebird’s existence. Therefore, giving respite and sustainable resource exploitation will offer a conducive environment for lovebirds to thrive.
Key words: Abundance, micro-habitat, preference, riparian, vegetation INTRODUCTION
Nine species of lovebirds are found in the sub-Saharan Africa, mainly in the woodlands of the island of Madagascar, South West Africa, north of the highlands of Ethiopia, Central Africa and West Africa each in its own distinct geographical area (Appleyard, 2001). Lovebirds are parrots and they belong to the order Psittaciformis, family; Psittacidae and species Agapornis pullaria ( Borrow and Demey, 2008). This bird is being sold as a pet due to their brightly coloured head and chirruping sound uttered at interval (see Plate 1). Lovebirds have a fragmented distribution with several populations in West Africa
and they occupy lowland savannah and wood grassland (Perrin, 2009). However, recent studies showed differences in population trend with an uneven distribution in different habitat (Reif et al; 2008). Scattered bird distributions can thus be associated with equally scattered habitats (Fuller et al; 2005). Cunningham and Johnson, (2006) and Winter et al; (2006) also highlighted the need to quantify habitat factors and avian occupancy, abundance, density and richness. Estimates of bird abundance are widely used in bird conservation. For example, they allow us to measure changes in
Journal of Applied Biosciences 76:6361– 6367
6362 population size (Buckland et al; 2008) and to assess whether isolated populations are workable (Githiru and Lens 2006). Information on population sizes of individual species can also be used to set priorities, allowing conservation effort to be focused on those species most in need of attention (Richard et al; 2004). Birds usually select foraging habitats based on the availability of their main prey items and understanding habitat preferences provides critical information for species conservation (Franco et al; 2004). The importance of bird monitoring programs was highlighted by the outcome of the 2002 World
Summit on Sustainable Development in Johannesburg where political leaders agreed to strive for a significant reduction in the current rate of loss of biological diversity by the year 2010 (Buckland, 2006). Therefore, availability of scientific and technical information on the distribution, abundance and habitat preference of lovebird Agapornis pullaria in Tiortyu has become major priority. The main aim of the study is to find out the distribution and abundance of Lovebirds and the threat faced by this species due to intensive agriculture and resource exploitation.
PLATE 1: Lovebirds gathered in a Cage. MATERIALS AND METHODS
Tiortyu is located in the southern guinea savannah belt and lies on Latitude 07o 42ǀ 48ǀǀ Nand Longitude 08o 42ǀ 59ǀǀ
Ein Tarka Local Government Areaof Benue State. The study site is not a conservation area and the local people are predominantly farmers. The total area of the riparian vegetation is about 21 hectares out of which 16 was sampled, representing 76% of the riparian vegetation. Four hectares were sorted out in each of the micro-habitat in a stratified random form; segregated into homogenous groups of the same sizes. The four microhabitats are;
cultivated land, grassland savannah, forestland and woodland savannah.
Surveys: Census was conducted in four sampling plots in the riparian vegetation between the hours 7.00-11.00 and 16.00 - 18.00 hours every fortnight to avoid repeated counting of a particular lovebirds species. Stratified random sampling was used. For the census, each hectare was sampled using point count method (PCM) (Buckland et al, 2001) with the assumptions that if one stands at one place it is possible to count birds seen and heard. A radius
6363 of 50 meters was assigned to the sampling points. On arrival at the counting station, the birds were allowed to settle between 5 – 10 minutes, followed with 10 minutes of counting using a binocular with a magnification of 8 × 40 all lovebirds seen and heard were recorded. To determine floristic composition and species richness, in each of the micro-habitat, a step- point method as described by Bruce (2009); using a 10m interval, and setting a transect direction with a compass bearing of 120o, was followed
and whichever vegetation (herbaceous plants) occurred at the regular intervals along the line transect was recorded as “hit” (plants and bare ground). Similarly, in
each plot, the diameter at breast height (DBH) of all woody stems were measured using a metallic measuring tape as described by Elzinga et al, (1998). A distribution statistics using a class interval of 10cm, for instance; 1-10,
10-20, 20-30, 30-40, 40-50, 50-60 obtained from the girth of woody species was established. This was to measure the impact of human activities in the riparian vegetation in relation to lovebirds’ distribution and abundance. Data on rain fall was collected from the Federal Meteorological Station in Makurdi to figure the correlation of rainfall, temperature and relative humidity on lovebirds’ population. Statistical analysis: Analysis of unbalance design using regression to test the effect of woody girths sizes (an index of human exploitation) and lovebirds distribution and abundance in all the micro-habitat was established. Data on vegetation composition were analysed using an unbalance ANOVA design, since all the tree families do not contain equal number of species. Lovebird distribution and abundance was correlated with climatic data to determine its response to weather changes.
RESULTS AND DISCUSSION
The number of lovebird enumerated in all the sampled points in the various micro-habitat are shown in (Fig.1), which implies that there were more lovebirds in forestland vegetation than any other habitat in the riparian vegetation.The result also shows that lovebirds population was significantly higher in forestland vegetation (P< 0.05) than any other micro-habitat in the study area. The preference shown to forestland vegetation by lovebirds populations may be as a result of good breeding site, less
human interference and more food resources availability. In the month of May, June and July which are denoted as early rainy season no lovebird was sighted in any of the four micro-habitat (Fig 2). The number of lovebirds increased gradually from August and attained its maximum in October (late rainy season) and decreases from November to January (early dry season). No lovebird was sighted in February, March and April which are denoted as late dry season.
Fig.1: Distribution of lovebirds in the different microhabitat of Tiortyu riparian vegetation KEY:CL = Cultivated Land FLV = Forest Land Vegetation
6364 Fig. 2: Monthly distribution of lovebirds in Tiortyu riparian vegetation. Plant Species Composition : Thirty five (35) plant
species belonging to 18 families were identified in the study area. The woodland savannah are characterized by scattered woody species, whose canopy. Dominant trees are; Adenodolichos paniculatus (Dullube) Ceratotheca sesmoides (Matak’ashi) and Kaya senegalensis (African mahogany) and consisting of a mixture of fire tolerant trees with compact grass cover. Forestland vegetation is characterized with dense forest canopy with a climax of 10m and above, under-storey and leafy shrub. In this
micro-habitat, lovebirds prefer perching and feeding on; plants like Anogeissus leiocarpa (African birch), Cissus populnea (Okoho), Dichrostachys cinerea (Sickle bush) Isoberlina doka (Doka) and Vitex doniana (Black plum) which are dominant in this vegetation. Table 1, shows the least mean square values of plant composition analysed from 100 step point. In the four micro-habitat, their interaction had no significant effect (P > 0.05). The significant effect (P < 0.05) of families on vegetation composition was noticed within the various micro-habitat. Table 1: Least Means Square (Number/M2) of Vegetation Composition and Plants Families from 100 Step Point
Families CL GLS FLV WLS Ampelidaceae _ _ 2.25 ± 2.25 _ Araceae _ _ _ 1.50 ± 1.50 Asteraceae _ 0.50 ± 0.50 4.75 ± 3.09 5.25 ± 3.04 Bombacaceae _ 14.00 ± 11.50 _ 0.25 ± 0.25 Caesalpinoideae _ _ 0.25 ± 0.25 _ Combretaceae _ 0.38 ± 0.38 10.38 ± 6.79 1.13 ± 0.74 Cyperaceae 3.25 ± 1.57 1.13 ± 1.13 3.63 ± 3.63 11.25 ± 7.96 Euphorbiaceae _ 6.17 ± 4.22 _ 2.58 ± 1.49 Gramineae 7.83 ± 3.24 8.35 ± 3.31 4.73 ± 1.90 3.60 ± 1.61 Malvaceae _ _ _ 1.00 ± 1.00 Meliaceae _ _ _ 0.50 ± 0.50 Mimosoideae _ 6.25 ± 5.83 4.13 ± 2.66 _ Musaceae _ 6.25 ± 6.25 _ 7.50 ± 7.17 Ocnaceae _ 3.25 ± 1.89 _ _ Papilionoideae _ _ 1.92 ± 1.92 0.50 ± 0.29 Pedaliaceae _ _ _ 1.00 ± 1.00 Portulacaceae _ _ _ 5.25 ± 4.92 Verbenaceae 0.25 ± 0.25 _ 10.00 ± 10.00 _ Overall Mean 11.33 ± 5.06 46.28 ± 35.01 42.04 ± 32.49 41.31 ± 31.47
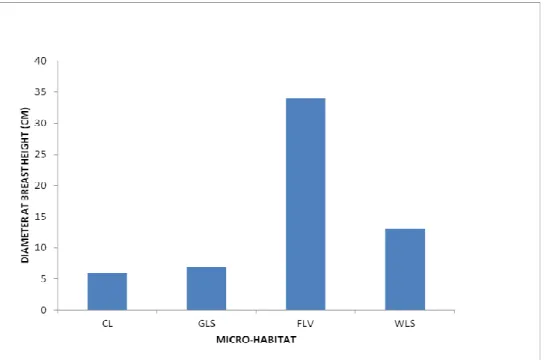
6365 Diameter at Breast Height (DBH) in various micro-habitats: Fig.3 shows the diameter at breast height of tree species in the different micro-habitat. However, there is a highly significant difference (P < 0.05) in the diameter at
breast of trees in FLV to other micro-habitat. This in turn, proved the high preference of lovebirds in FLV and a clue of lower human interference in the micro-habitat.
Fig.3: Distribution of Lovebirds and DBH in different micro-habitats in the riparian vegetation. KEY:
CL = Cultivated Land FLV = Forest Land Vegetation GLS = Grass Land Savannah WLS = Wood Land Savannah Lovebirds and climatic parameters: Table 3 shows,
that the correlation between number of lovebirds and rainfall is highly significant (P < 0.01). From all indication lovebird increases in time and space, with an increase in rainfall which stimulates availability of food source and decreases with decrease in rainfall which affected food sources directly. Temperature and the number of lovebirds have a negative correlation, but the correlation between rainfall and relative humidity is equally significant (P <
0.05). Most of the preferred plant species identified were present at a range of sites within the riparian environment. Such plant species occupied some habitats within the riparian vegetation and most of these trees were found in FLV. The tree become luscious, flower and fruit during the late rainy season (August- October); therefore lovebirds distribution and abundance shows a strong correlation (r2
= 0.8280; P < 0.01) with rainfall and high relative humidity.
Table 3: The Correlation between Rainfall, Temperature Relative Humidity and Lovebird in the Wild Number of lovebird Rainfall Temperature Relative humidity
Number of 1.00 Lovebird Rainfall 0.828** 1.00 Temperature -0.159 0.086 1.00 Relative 0.439 0.739* 0.381 1.00 Humidity ** = (P < 0.01); * = (P < 0.05)
6366 DISCUSSION
There were more lovebirds in FLV when compared with WLS and GLS which agrees with the work on species abundance reported by Joanna, (2009), who worked on the impact of habitat fragmentation on bird community composition in Montverde, Costa Rica. This is because, FLV which is an intact and continuous forest with high count of Acacia camplycantha, Anogeissus leiocarpa and Kigellia africana which lovebirds preferred perching on, best breeding ground due to many holes on the boles and coupled with availability of food resources, supports more birds than any other fragment in this riparian vegetation. This result is not at variance with the work of Knick and Rotenberry, (2002), who reported high number of forest birds in an undisturbed forest environment. Lovebird population increases gradually from the month of August, and attained a maximum in October; because this period coincides with the time of the year when the sampled riparian vegetation is full of vegetation and food resources. The population decreased when dry season sets in and with frequent bush fire, resulting in destruction of food resources that are available to the birds. Fluctuation in food resources is fundamental to species abundance and distribution and this was responsible to sharp decrease or near absence of lovebirds from the month of November to July. The population of lovebirds varies in different microhabitats with FLV having the highest population and CL the least population due to agricultural activities in this habitat. This result agrees with Franklin and Steadman, (2010), who worked on forest plant and bird communities in Lau, Fiji. From this study observation, lovebirds were usually sighted early in the morning foraging in GLS, FLV, and WLS for few hours. A returned visit to the same spot for further verification indicated absence of lovebirds. The result obtained suggests that lovebirds’ community of this area has a migratory characteristic due to human disturbance associated with farming activities during the day. Human disturbance on bird species will definitely force birds to feed on areas of less quality because survival rate and breeding success are influenced by food
intake (Yasue, 2005). It was also observed that lovebirds showed close association with specific plant species in their abundance and distribution, for example lovebirds which are regarded as riparian and middle layer has affinity for Panicum maximum and this has made lovebird to be present in GLS, FLV and WLS due to the distribution of the plant species in the vegetation. Cultivated land is subjected to subsistence farming hence it has a significantly higher count of Gramineae which are annual grasses. Human disturbance is intense in this micro-vegetation because crops like rice, cassava; millet and maize were cultivated, making it difficult for this micro-habitat to sustain lovebirds’ population. Measurement of diameter at breast height (DBH) of tree species in a habitat is an approximate indicator of human activities in that environment. This is clearly shown in Fig.3 which showed FLV having DBH and consequently lower human interference; when compared to other micro-habitat of the riparian vegetation. In this habitat only 20 tree species have DBH of > 5cm if compared to the work of Franklin and Steadman, (2010) which recorded 85 tree species of DBH > 5cm. Due to minimal human disturbance in FLV, most of the trees are matured, having higher girth size and high lovebirds population Fig.1. The development of subsistence farming, tree cutting, firewood collection, grass cutting, forest fires and cattle grazing are the potential threats to lovebirds and plant communities. Lovebird in particular are usually affected by indiscriminate deforestation which is a function of conversion of forest land to a crop land, firewood collection, logging of trees for timber, production of charcoal and wild fires which render lovebirds homeless as tree hole dwelling species. The exposure of bare ground to erosion because of intense farming activities are some of the immediate impact of human activities. However, there was an increase in the population and abundance of lovebirds in the different micro-habitat, with an increase in rainfall which was due to flowering, sprouting tender leaves and blossoming fruiting of trees. CONCLUSION
The riparian vegetation of Tiortyu is capable of sustaining a large population of lovebirds if human interference is curtailed. There is need for Benue State Government intervention by declaring the riparian vegetation a
conservation area, to prevent total destruction of the environment, thereby conserving lovebirds and their habitat for next generation.
ACKNOWLEDGEMENTS
6367 REFERENCES
Appleyard V, 2001. Lovebird Hand Book. Baron’s
Educational Series, New York.
http://www.Barronseduc.com.
Borrow N, and Demey R, 2008. Helm Field Guides Birds of Western Africa. Christopher Helm, A and C Black Publisher Ltd., London WID 3HB.
Bruce A, 2009. Guidelines for Monitoring Weed Control and recovery of Native Vegetation, NSW, Department of Primary Industries State of New South Wales ISBN 9780734719966
www.environment.nsw.gov.au . pp. 4-22
Buckland S T, 2006. Point Transect Surveys for Songbirds: Robust Methodology. The Auk 123: pp. 345-357
Buckland ST,. Anderson DR,. Burnham KP,. Laake JL, Borchers DL and Thomas L, 2001. Introduction to Distance Sampling Oxford University press, Oxford. Considerations and Management Recommendations: Wildlife Society Bulletin 34 (5) 1393 – 1395.
Buckland ST, Stuart JM and Rhys EG, 2008. Estimating Bird Abundance: Making Methods work. Bird Conservation International 18: -S108
Cunningham M A and Johnson DH, 2006. Proximate and landscape factors influence grassland bird distributions. Ecological Applications 16: 1062-1075.
Elzinga CL, Salzer DW and Willoughby J W, 1998. Measuring and Monitoring Plant Populations. Technical Reports 1730-1. Bureau of Land Management. Denver, Colorado USDI, BLM. pp .172-173
Franco AM, Catry A I, Sutherland WJ and Palmeirim JM, 2004. Do different habitat preference Survey methods produce the same conservation recommendations for lesser kestrels? Animal Conservation 7: 291-300
Franklin J; Steadman, D.W 2010. Forest plant Birds Communities in Lau Group, Fiji Plos One Journal 5 (12): 122 -137
Fuller MR, Bernard JD, Simon G, Gabriel SA and Ross AH, 2005. Indices of Bird habitat preference from field surveys of birds and remote sensing of Land cover with wider implications for conservation and Biodiversity Assessment. Global Ecology and Biogeography 14: 223-239 Githiru M and Lens L, 2006. Demography of an
Afro-tropical passerine in a highly fragmented landscape. Animal. Conserv. 9:21–27.
Joanna XW, Frank J and Federico C, 2009.The impact of Habitat Fragmentation on Bird community Composition in Monteverde, Costa Rica. Berkeley Scientific Journal,13 (1):54 – 55. Perrin MR, 2009. Niche separation in African parrots. In:
Hareebottle, D.M.,Craig, A.J.F.K., Anderson,M.D., Rakotomanana, H. and Muchai, M. (eds). Proceedings of the 12th pan-African
Ornithological Congress, 2008. Cape Town, Animal Demography Unit. Pp. 29-37.
Rotenberry J T and Knick S T,2002. Effects of Habitat Fragmentation on Passerine Birds Breeding in Inter-mountain Shrubsteppe. Studies in Avian Biology 25:130 – 140
Reif J, David S, Petr V, Karel S and Vladimir B, 2008. Bird-Habitat Association Predict Population Trends in Central European Forest. Biodivers Conserv 17:3307-3319
Richard DG, David W G and Paul F D, 2004. Bird census and Survey Techniques Suther- 02 qxd PP. 17-52
Serle W and Morel G T 1992. Field Guide to Birds of West Africa William Collins and Co. Ltd. London. pp. 97-104
Winter M, Johnson D H, Shaffer J A, Donovan T M, and Svedarsky W D, 2006. Patch size and landscape effects on density and nesting success of grassland birds. Journal of Wildlife Management 70:158- 172.
Yasue M, 2005. The Effects of Human presence flock size and prey density on Shorebird Foraging rates. J.Ethol.23: 199-204