UNIVERSITÉ DE MONTRÉAL
FLOW INDUCED ORIENTATION IN CARBON NANOTUBE SUSPENSIONS: MODELING AND EXPERIMENTS
GIOVANNIANTONIO NATALE DÉPARTEMENT DE GÉNIE CHIMIQUE ÉCOLE POLYTECHNIQUE DE MONTRÉAL
THÈSE PRÉSENTÉE EN VUE DE L’OBTENTION DU DIPLÔME DE PHILOSOPHIAE DOCTOR
(GÉNIE CHIMIQUE) AOÛT 2015
UNIVERSITÉ DE MONTRÉAL
ÉCOLE POLYTECHNIQUE DE MONTRÉAL
Cette thèse intitulée:
FLOW INDUCED ORIENTATION IN CARBON NANOTUBE SUSPENSIONS: MODELING AND EXPERIMENTS
présentée par : NATALE Giovanniantonio
en vue de l’obtention du diplôme de : Philosophiae Doctor a été dûment acceptée par le jury d’examen constitué de : M. DUBOIS Charles, Ph. D., président
Mme HEUZEY Marie-Claude, Ph. D., membre et directrice de recherche M. CARREAU Pierre, Ph. D., membre et codirecteur de recherche M. FÉREC Julien, Ph. D., membre et codirecteur de recherche M. GRMELA Miroslav, Doctorat, membre
DEDICATION
Alla mia nonna…
ACKNOWLEDGEMENTS
First and foremost, I would like to express all my gratitude to my research director, Professor Marie-Claude Heuzey and to my research co-directors, Professors Pierre Carreau and Julien Férec. During these past years, their support and guidance has been integral throughout my thesis project. I would like to thank Professor Gilles Ausias for its help in the modeling aspects of this project and for his constructive comments on the articles. Thank you to Professors Jan Vermant and Paula Moldenaers for providing access to their rheo-optical setup at KU Leuven and, in particular, Dr. Naveen Krishna Reddy for his help with the rheo-optical measurements.
I would like to thank Professor Daniel Therriault for providing me access to the composite laboratory in the Mechanical Engineering Department of École Polytechnique and Professor Michael Buschmann, Dr. Vincent Darras and Dr. Nicolas Tran-Khanh of the Biomedical Engineering Department for their help with the Confocal microscopy.
Mostly, I would like to thank Professors Fabio Cicoira and Clara Santato for letting me participate in their research.
I would also like to thank Université de Bretagne-Sud for the mobility scholarship and the Society of Rheology for the conference travel grant.
My gratitude is also directed to all the members of the CREPEC group of the École Polytechnique de Montréal and especially, the rheology group. Thank you to Melina Hadmine for training me at the beginning of my Ph.D. and to my friends and colleagues Gilles Lenfant and Marie Matet for having shared long hours in the lab with me and turned those hours into fond memories.
Thank you to Franco, Filippo, Luca, Matteo and the other Italian researchers here at École Polytechnique de Montréal. Our coffee breaks made me miss Italy a little less.
I would like to thank my parents and my brothers who support me in so many ways even if we are far. Finally, I would like to thank my partner, Madeleine, for her love and support during these years and for her ability to make me smile even in the most difficult moments.
RÉSUMÉ
De par leurs propriétés uniques, les nanotubes de carbone (NTCs) sont très prometteurs pour la prochaine génération de matériaux. Les applications sont multiples et variées et touchent des domaines comme l'électronique organique, le renforcement de composites en plastiques conducteurs, les alliages et même de nouveaux types de capteurs biologiques. En dépit de ces promesses et potentialités, les composites et les suspensions de nanotubes de carbone sont par nature difficiles à traiter. La formulation de procédés efficaces pour obtenir des résultats à la hauteur des espérances souhaitées ne font que commencer. Le succès des NTCs, dans toutes les applications possibles, dépend de leur compréhension fondamentale et de la capacité à contrôler l'évolution de leur microstructure lors de leur mise en œuvre.
Lors d’un écoulement, les NTCs dispersés dans une matrice polymère s’orientent et interagissent induisant des corrélations spatiales et orientationnelles. Les agglomérats peuvent également se briser si les forces hydrodynamiques sont suffisantes ce qui augmente la probabilité de contact entre les différents nanotubes et améliore leur interactions avec la matrice ainsi que la fluidité du matériau composite. Au repos, la microstructure d’une suspension de NTCs ne cesse de changer à cause du mouvement brownien et des forces attractives de van der Waals; les nanotubes de carbone diffusent dans la phase liquide et tendent à former un réseau.
Pour analyser un système aussi complexe, une résine époxy de faible viscosité a été utilisée comme matrice pour disperser les nanotubes de carbone à parois multiples (NTCPMs). Les polymères newtoniens sont particulièrement utiles car ils peuvent conférer une relativement large contrainte de cisaillement permettant de briser les agglomérats de NTCs facilitant ainsi leur dispersion. Le comportement newtonien, lui, permet de ne pas masquer les propriétés viscoélastiques de l'ensemble du système.
Du régime de concentration dilué vers un régime plus concentré, les suspensions de NTCs ont été étudiées rhéologiquement afin d’obtenir des informations sur l'orientation et le transport des nanotubes de carbone individuels ainsi que sur les propriétés viscoélastiques du réseau formé par ces particules cylindriques. La rhéologie a été utilisée pour comprendre l'évolution de la microstructure sous écoulement ainsi que dans des conditions statiques. Les effets de l'histoire de
l’écoulement, de la vitesse de cisaillement, du temps de repos et de la direction de cisaillement ont été étudiés.
Pour corréler la microstructure avec les données rhéologiques, deux voies ont été choisies. La première voie comprenait une analyse rhéo-optique. Le dichroïsme des suspensions a été étudié pour les suspensions appartenant aux régimes dilués et semi-dilués. Des informations directes sur la dispersion, l'évolution de l'orientation lors de l'écoulement et les effets dus au mouvement brownien ont ainsi été obtenus. La seconde voie consistait à développer de nouveaux modèles rhéologiques afin de corréler les informations à l’échelle de la microstructure avec l'évolution du tenseur de contrainte ou de l’indice de réfraction de la suspension.
Dans le régime dilué, les nanotubes ont été modélisés comme des particules flexibles. Un modèle modifié à deux tiges a été utilisé ce qui permet d’obtenir des conformations d'équilibre non- alignées. Dans les régimes plus concentrés, la dynamique du système est contrôlée par des interactions de type tige-tige. Les nanotubes ont été modélisés comme des bâtonnets rigides sans inertie et l'état d'orientation du système est influencé par des interactions via des forces de lubrification non-linéaires, des forces hydrodynamiques et par le mouvement brownien. La comparaison des résultats expérimentaux avec les prédictions des modèles proposés permet de quantifier les mécanismes fondamentaux derrière l'évolution de la microstructure des suspensions de NTCs. Afin de mieux différencier la rhéologie des suspensions de NTCs, les prédictions du modèle ont également été confrontées aux données expérimentales pour une suspension de particules microscopiques: des fibres de verre dans le polybutène [Sepehr et al. (2004b)]. Dans le cas des micro-particules, les prédictions du modèle ont confirmé que la réponse rhéologique du système est contrôlée par des effets d'orientation tandis que les interactions entre particules sont dominantes dans le cas des suspensions de NTCs.
Ainsi, ce travail explore les liens entre la rhéologie des suspensions de nanotubes de carbone et l’évolution de leur microstructure en suspension. Ceci est la première étape vers la conception de nouveaux systèmes de traitement afin d'exploiter complètement les propriétés uniques des nanotubes de carbone.
ABSTRACT
Due to their unique properties, carbon nanotubes (CNTs) hold remarkable promise for the next generation of materials, with potential applications in organic electronics, reinforced and electrically conducting plastic composites, new alloys, and even new types of biological sensors and devices. Despite these promises and potentialities, carbon nanotube composites and suspensions are inherently difficult to process, and efficient processing schemes are only just starting to be formulated. The success of CNTs, in all potential applications, depends on the understanding and ability to control the microstructure evolution during processing.
During flow, CNTs dispersed in a polymeric matrix orient and interact, inducing spatial and orientation correlations. Agglomerates can also break if the hydrodynamic forces are sufficient, increasing the probability of contact between different nanotubes and improving the interactions with the matrix and the flowability of the composite. At rest, the microstructure of the CNT suspension keeps changing due to Brownian motion and van der Waals attractive forces, and the CNTs diffuse in the suspending fluid and eventually form a network of particles.
To analyze such a complex system, a low viscosity epoxy was used as the matrix to disperse the multiwall carbon nanotubes (MWCNTs). Nearly Newtonian polymers are particularly useful because they can impart significant shear stress to break the CNT agglomerates and facilitate their dispersion, while their Newtonian behavior does not mask the viscoelastic properties of the overall system.
From dilute to concentrated regimes, CNT suspensions were rheologically probed to obtain information ranging from the orientation and transport of individual carbon nanotubes to the viscoelastic properties of dense and isotropic network of rods. Rheology was used to understand the microstructure evolution under flow and in static conditions. The effects of flow history, shearing velocity, rest time and shearing direction were studied.
To correlate the microstructure with the rheological data, two different routes were undertaken. The first route involved rheo-optical analysis. Dichroism was investigated for suspensions belonging to the dilute and semi-dilute regimes. Direct information on dispersion, orientation evolution during flow and Brownian motion were obtained. The second route consisted in
developing new rheological models in order to correlate micro-scale information to the evolution of the related stress tensor or refractive index tensor.
In the dilute regime, the nanotubes were modeled as flexible particles. A modified two-rod model was used, allowing non-straight equilibrium conformations. In more concentrated regimes, the dynamic of the system is controlled by rod-rod interactions. The nanotubes were modeled as inertialess rigid rods and the system orientation state is influenced by interactions via non-linear lubrication forces, hydrodynamic forces and Brownian motion. The comparison of the experimental results with the models predictions allowed to quantify the fundamental mechanisms behind the microstructure evolution of CNT suspensions. To further differentiate the rheology of CNT suspensions, the model predictions were also confronted with the experimental data for a microsize particle suspension: glass fiber-filled polybutene [Sepehr et al. (2004b)]. In the case of the micro-size particles, the model predictions confirmed that the rheological response of the system was controlled by orientation effects while interactions were dominant in the case of CNT suspensions.
Hence, this work explores the connections between the bulk rheology of carbon nanotube suspensions and their microstructural evolution. This is the first step towards the design of new processing schemes in order to completely exploit carbon nanotube unique properties.
TABLE OF CONTENTS
DEDICATION ... III ACKNOWLEDGEMENTS ... IV RÉSUMÉ ... V ABSTRACT ...VII TABLE OF CONTENTS ... IX LIST OF TABLES ... XIII LIST OF FIGURES ... XIV LIST OF SYMBOLS AND ABBREVIATIONS... XXI LIST OF APPENDICES ... XXVIICHAPTER 1 ... 1
1.1 Introduction ... 1
CHAPTER 2 LITERATURE REVIEW ... 3
2.1 Carbon nanotubes: experimental characterization ... 3
2.1.1 Dispersion of CNTs ... 4
2.1.2 Rheology of CNT suspensions ... 9
2.1.3 Flow induced microstructure ... 21
2.2 Continuum modeling of rod-like suspensions ... 24
2.2.1 Jeffery model ... 25
2.2.2 Folgar and Tucker model ... 26
2.2.3 Orientation distribution ... 27
2.2.4 Dhont and Briels model ... 29
2.2.5 Aggregation/Orientation model ... 30
2.2.7 Férec model ... 33 2.2.8 Rod flexibility ... 34 2.2.9 Thermodynamic approach ... 36 2.2.10 Constitutive equation ... 37 2.2.11 Numerical methods ... 39 2.3 Summary ... 42
CHAPTER 3 RESEARCH OBJECTIVES AND SUMMARY OF THE ARTICLES ... 43
3.1 Objectives ... 43
3.2 Summary of the articles ... 43
CHAPTER 4 ARTICLE 1: RHEO-OPTICAL RESPONSE OF CARBON NANOTUBE SUSPENSIONS ... 46
4.1 Synopsis ... 47
4.2 Introduction ... 48
4.3 Materials and experimental methodology ... 51
4.4 Dichroism in parallel disk and Couette flow geometries ... 54
4.5 Model ... 63
4.5.1 Definitions and hypotheses ... 63
4.5.2 Equations ... 65
4.6 Parametric analysis ... 68
4.7 Predictions at high Pe ... 72
4.8 Concluding remarks ... 76
4.9 Acknowledgements ... 77
4.10 Appendix A: Force Balance ... 77
4.12 Appendix C: Second order orientation tensors ... 81
4.13 References ... 84
CHAPTER 5 ARTICLE 2: RHEOLOGICAL MODELING OF CARBON NANOTUBE SUSPENSIONS WITH ROD-ROD INTERACTIONS ... 88
5.1 Synopsis ... 89
5.2 Introduction ... 89
5.3 Model formulation ... 93
5.3.1 Definitions and hypotheses ... 93
5.3.2 Equations for rod motion ... 94
5.4 Rod orientation distribution ... 98
5.5 Stress determination ... 99
5.6 Numerical method ... 100
5.6.1 Isotropic orientation distribution ... 101
5.6.2 Parametric analysis ... 103
5.7 Materials and experimental methodology ... 109
5.8 Data and predictions ... 112
5.9 Concluding remarks ... 121
5.10 Acknowledgments ... 122
5.11 References ... 122
CHAPTER 6 ARTICLE 3: MODELING INTERACTIONS IN CARBON NANOTUBE SUSPENSIONS: TRANSIENT SHEAR FLOW ... 127
6.1 Synopsis ... 128
6.2 Introduction ... 128
6.4 Numerical method ... 136
6.5 Materials and experimental ... 137
6.6 Data and predictions ... 139
6.6.1 MWCNT suspensions ... 139
6.6.2 Glass fiber suspensions ... 149
6.7 Concluding remarks ... 157
6.8 Acknowledgements ... 158
6.9 Appendix A: Evolution of a2 ... 158
6.10 References ... 160
CHAPTER 7 GENERAL DISCUSSION ... 164
CHAPTER 8 CONCLUSIONS AND RECOMMENDATIONS... 170
BIBLIOGRAPHY ... 173
LIST OF TABLES
Table 2.1: Physical properties of different carbon materials [Ma et al. (2010)]. ... 4 Table 2.2 Summary of material constants for the constitutive equation 2.39 ... 38 Table 5.1 Parameters used for the parametric analysis on the steady shear viscosity, normal stress
difference and a2 components predictions. ... 103 Table 5.2 Characteristics of the materials used in this work. ... 110 Table 5.3 Adjustable parameter values obtained by fitting the experimental steady shear viscosity
and normal stress difference data for carbon nanotubes dispersed in epoxy (CNT-EPO) and glass fibers dispersed in polybutene (PB-GF) [Sepehr et al. (2004b)]. ... 113 Table 6.1 Expressions for λ and C from previous models reported in the literature. ... 133 Table 6.2 Characteristics of the materials analyzed in this work. ... 138 Table 6.3 Parameter values obtained by fitting the transient experimental data for carbon nanotubes
dispersed in epoxy (EPO-CNT (T)). The parameter values obtained by fitting the steady-state values of viscosity and first normal stresses difference, N1, of carbon nanotubes (1.17 vol%) dispersed in epoxy (EPO-CNT (SS)) obtained from Natale et al. (2014) are also reported. . 139 Table 6.4 Adjustable parameter values obtained by fitting the transient experimental data for glass
fibers (7.06 vol.%) dispersed in polybutene (PB-GF (T)). The parameter values obtained by fitting the steady-state values of the viscosity and first normal stresses difference, N1- N2, of glass fibers (7.06 vol.%) dispersed in polybutene (PB-GF (SS)) obtained from Natale et al. (2014) are also reported. ... 151
LIST OF FIGURES
Figure 2.1 Distribution of micro and nano scale fillers of the same 0.1 vol.% in a reference volume of 1 mm3 (A: Al2O3 particle; B: carbon fiber; C: GNP; D: CNT) [Ma et al. (2010)]. ... 5 Figure 2.2 Real part of the complex viscosity,
'
, at 50 Hz, against time of mixing, for a range ofdifferent weight fractions of nanotubes. The arrows mark the critical time for each concentration [Huang et al. (2006)]. ... 8 Figure 2.3 Data for tan (δ) against frequency for 7 wt % CNT-PDMS samples mixed for different
times (tested immediately after mixing) [Huang et al. (2006)]. ... 9 Figure 2.4 Phase behavior of a suspension of Brownian rigid rods [Doi and Edwards (1986)]. ... 10 Figure 2.5 Storage modulus, G’, of PC and PC/MWCNT composites as a function of frequency
[Abdel-Goad and Pötschke (2005)]. ... 11 Figure 2.6 Complex viscosity of polycarbonate/MWCNTs as a function of frequency at 230 °C
[Abbasi et al. (2009a)]. ... 12 Figure 2.7 Storage moduli of polycarbonate/MWCNT as a function of frequency at 230 °C [Abbasi
et al. (2009a)]. ... 13
Figure 2.8 (a) Storage modulus, G’, of SWCNT/PMMA nanocomposites as a function of the nanotube loading at a fixed frequency of 0.5 rad/s. Insert: a log-log plot of G’ vs reduced mass fraction. (b) Electrical conductivity, 𝜎, of SWCNT/PMMA nanocomposites as a function of the nanotube loading. Insert: a log-log plot of electrical conductivity vs reduced mass fraction. Note that 𝛽𝜎 is significantly larger than 𝛽𝐺′ due to the larger magnitude of the change in 𝝈 at the threshold [Du et al. (2004)]. ... 14 Figure 2.9 Evaporation of a drop of SWCNT/poly (3-hexylthiophene) (1:1) in 1, 2-
dichlorobenzene placed between crossed polarizers. The change in light intensity represent the different aligned domains. (A) Before and (B) after evaporation [Allen et al. (2013)]. .. 16 Figure 2.10 Transient stress data of a 2wt% MWCNT/epoxy suspension at shear rate of 1 s-1 [Khalkhal and Carreau (2012)]. ... 17
Figure 2.11 Development of G’ at 1 rad/s for a 2 wt% MWCNT/epoxy suspension after cessation of shear flow for different shear rates [Khalkhal et al. (2011)]. ... 18 Figure 2.12 Anisotropy factor (filled symbols) and storage modulus (empty symbols) for a 2 wt%
MWCNT suspension measured following flow cessation of steady shear at 200 s-1 [Pujari et
al. (2011)] ... 19
Figure 2.13 Scaled birefringence (a) and dichroism (b) as a function of Peclet number. The solid lines represent power-law fits as indicated. The left inset show a TEM of MWCNT (scale bar of 250 nm). The right inset is an AFM image of SWCNT (scale bar of 150 nm) [Fry et al. (2006)]. ... 20 Figure 2.14 Scaled “phase diagram” describing the evolution from a solid-like disordered network
(I) to a flowing nematic (N) for MWCNTs suspended in a low molecular weight polymer solvent, where concentration increases from top to bottom. Open circles are (para)nematic, closed circles are isolated aggregates, open squares are vorticity bands, and closed squares are cavitated networks. The vertical dashed line marks the stability limit. Colors denote MWNT mass concentration; blue (0.025%), brown (0.1%), pink (0.4%), green (0.85%), purple (1.7%), and magenta (3%). The parameter h denotes gap and R0 represents the mean aggregate size in the limit of large gap and weak shear [Hobbie and Fry (2006)]. ... 22 Figure 2.15 The effect of time and gap size on the formation of helical bands (HBs). The shear rate
for all conditions was fixed at 0.5 s−1. Direction of flow is vertical as indicated [Ma et al. (2007)]. ... 23 Figure 2.16 Orientation of a rigid rod described by the unit vector p in the principal direction of
the symmetry axis of the rod. ... 25 Figure 2.17 Schematic of the flexible rod. ... 34 Figure 2.18 Control volume of the spatial discretization used to calculate the fluxes balance. The
faces are labelled as e, w, n and s standing for east, west, north and south, respectively [Férec
et al. (2008)]. ... 40
Figure 4.2 Dichroism as function of shear rate for different volume fractions in parallel disk flow geometry. Open symbols indicate concentrations in the semi-dilute regime. ... 55 Figure 4.3 Dichroism as function of volume fraction for different shear rates in parallel disk flow
geometry. ... 56 Figure 4.4 Normalized dichroism as function of scaled time during relaxation after shearing at 10
s-1 in parallel disk flow geometry. The data at each concentration are scaled with the average relaxation time calculated at that concentration. The solid line represents a stretched exponential function for the α = 0.02 s-1 and β = 0.6. The insert is a zoom of the results at long t/τ. Open symbols indicate concentration in the semi-dilute regime. ... 57 Figure 4.5 Rotary diffusion, α and β (of the stretched exponential function) as functions of volume
fraction. The vertical dashed line represents the theoretical limit between the dilute and semi-dilute regimes [Doi and Edwards (1986)]. The solid lines are guidelines. ... 59 Figure 4.6 Dichroism scaled with volume fraction as function of Peclet number in parallel disk
flow geometry. Open symbols indicate concentrations in the semi-dilute regime. ... 61 Figure 4.7 Dichroism scaled with volume fraction and orientation angle as functions of Peclet
number. The data were obtained in Couette cell (CC) and PP flow geometries. Open symbols refer to the orientation angle. ... 62 Figure 4.8 Flexible particle scheme. ... 64 Figure 4.9 Evolution of the flow direction component of the unit vector pα for different values of
kS at a shear rate equal to 1 s-1. ... 69 Figure 4.10 Evolution of cos (π-θ) (angle between pα and pβ) for different values of kS at a shear
rate of 1 s-1. ... 70 Figure 4.11 Evolution of a) a11 component and b) trace of b2 for different values of kS at a shear
rate of 1 s-1. ... 71 Figure 4.12 Comparison between experimental (filled) and predicted (unfilled) values of dichroism
Figure 4.13 Fitted values for the equilibrium position e as a function of Pe. The trendline represents the regression of the data with a power-law expression. ... 75 Figure 5.1 Individual and overall contributions to the steady-state reduced viscosity of a filled
system in simple shear flow. The results were obtained in the case of isotropic orientation distribution and m=0.3. ... 102 Figure 5.2 Reduced steady-shear viscosity predictions as function of shear rate for different values
of MI. The values of the other three adjustable parameters are reported in Table 5.1 (Test A). ... 104 Figure 5.3 Component a11 of the second order orientation tensor as function of shear rate for
different values of MI. The values of the other three adjustable parameters are reported in Table 5.1 (Test A). ... 105 Figure 5.4 First normal stress difference predictions as function of shear rate for various values of
MI. The values of the three other adjustable parameters are reported in Table 5.1 (Test A). ... 106 Figure 5.5 Reduced steady shear viscosity predictions as function of shear rate for different values
of m. The values of the other three adjustable parameters are reported in Table 5.1 (Test B). ... 107 Figure 5.6 First normal stress difference predictions as function of shear rate for different values
of m. The values of the other three adjustable parameters are reported in Table 5.1 (Test B). ... 108 Figure 5.7 Component a11 of the second-order orientation tensor as function of shear rate for
different values of m. The values of the other three adjustable parameters are reported in Table 5.1 (Test B). ... 109 Figure 5.8 TEM images of a cured suspension containing 3 wt% CNTs at lower (a) and at higher
(b) magnification. The arrows are used to indicate the agglomerates. ... 111 Figure 5.9 Reduced steady shear viscosity data (symbols) for the four CNT concentrations
dispersed in an epoxy matrix. The experimental results are compared with the model predictions (lines). The fitting parameter values are reported in Table 5.3. ... 113
Figure 5.10 First normal stress difference data (symbols) for the four CNT concentrations dispersed in an epoxy matrix. The experimental results are compared with the model predictions (lines). The fitting parameter values are reported in Table 5.3. ... 114 Figure 5.11 Reduced steady shear viscosity data (symbols) of the three GF concentrations dispersed
in a polybutene matrix. The experimental results are compared with the model predictions (lines). The fitting parameter values are reported in Table 5.3. The experimental data are taken from Sepehr et al. (2004b). ... 116 Figure 5.12 Normal stress difference data (symbols) of the three GF concentrations dispersed in a
polybutene matrix. The experimental results are compared with the model predictions (lines). The fitting parameter values are reported in Table 5.3. The experimental data are taken from Sepehr et al. (2004b). ... 117 Figure 5.13 (a) Variations of the a2 components as functions of shear rate for the 1 wt% CNT
suspension. (b) Variation of the a11 component as function of shear rate for various CNT concentrations. ... 119 Figure 5.14 (a) Variations of the a2 components as functions of shear rate for the 5 wt% GF
suspension (PB05). (b) Variation of the a11 component as function of shear rate for different GF concentrations. ... 120 Figure 6.1 Comparison between stress growth experimental data and model prediction for the EPO-CNT system in CCW direction at 10 s-1 using the set of parameters EPO-CNT (SS). ... 140 Figure 6.2 Comparison between stress growth experimental data and model predictions for the
EPO-CNT system in CCW and CW directions for different rest times (0 s, 500 s and 1000 s) at 10 s-1 using the set of parameters EPO-CNT (T). ... 141 Figure 6.3 Comparison between two consecutive stress growth experimental data and model
predictions for the EPO-CNT system in the CW direction for different rest times (0 s, 500 s and 1000 s) at 10 s-1 using the set of parameters EPO-CNT (T). ... 142 Figure 6.4 Predictions of the different contributions to the shear stress and total shear stress
normalized with respect to the matrix contribution for the EPO-CNT system in the CCW run at 10 s-1 using the set of parameters EPO-CNT (T). ... 144
Figure 6.5 Comparison between stress growth experimental data and model predictions in the CCW direction at different shear rates for the CNT-EPO system using the set of parameters EPO-CNT (T). ... 145 Figure 6.6 Model predictions of a2 components for the EPO-CNT system in CCW direction at 10
s-1 using the set of parameters EPO-CNT (T). ... 146 Figure 6.7 Model predictions of a2 components for the EPO-CNT system in steady state as function
of shear rate using the set of parameters EPO-CNT (T). ... 147 Figure 6.8 Comparison of the reduced steady-shear viscosity and first normal stress difference
(insert) for the EPO-CNT system containing 1.17 vol% of carbon nanotubes with the model predictions using the two set of parameters reported in Table 6.3. ... 148 Figure 6.9 Comparison between experimental reversed stress growth data at different shear rates
and model predictions in the CCW direction immediately following an initial CW test for the PB-GF (7.06 vol.%) system using the set of parameters PB-GF (T). Data from Sepehr et al. (2004b). ... 152 Figure 6.10 Comparison between experimental N1-N2 responses to reversed stress growth at
different shear rates and model predictions in the CCW direction following immediately an initial CW test for the PB-GF (7.06 vol.%) system using the set of parameters PB-GF (T). Data from Sepehr et al. (2004b). ... 153 Figure 6.11 Model predictions of the different contributions to the shear stress and total shear stress
normalized with respect to the matrix contribution for the PB-GF (7.06 vol.%) system in the CCW stress growth test at 5 s-1 using the set of parameters PB-GF (T). ... 154 Figure 6.12 Model predictions of a2 components for the PB-GF (7.06 vol.%) system in the CW
direction at 5 s-1. ... 155 Figure 6.13 Comparison of the reduced steady-shear viscosity and first normal stress differences
(inset) for PB-GF (7.06 vol.%) system with model predictions with the two set of parameters reported in Table 6.4. ... 156 Figure 8.1 Confocal microscope coupled with the base of a Linkam platform. ... 186
Figure 8.2 Home-made lid for the Linkam platform and close up of the position on the Linkam base. ... 187 Figure 8.3 1 wt. % MWCNTs (green) in epoxy (black). The scale bar is 10 μm. ... 188
LIST OF SYMBOLS AND ABBREVIATIONS
2
a Second order orientation tensor
2
a Time evolution of a 2
4
a Fourth order orientation tensor
6
a Sixth order orientation tensor
, , , , ,
E W N S M P
a a a a a a Coefficients of the discretization for finite volume method
AF Anisotropy factor
AFM Atomic force microscope
B Dimensionless conformation tensor of a macromolecule
2, 2
m
b b Second order interaction tensor
4, 4
m
b b Fourth order interaction tensor
c Conformation tensor of macromolecule I
C Interaction coefficient
CC Couette cell
CP Cone and plate
CNT Carbon nanotube
D Rod diameter
Dr Coefficient of rotational diffusion I
df Differential interaction force
I
dT Differential interaction torque
Y
E Young modulus
I f Interaction force z F Normal force
f
Trace of 2 m b G’ Storage modulus G” Loss modulus GF Glass fiberIDC Continuous intensity in dichroism
Jm Bessel function of the mth order
k Geometrical adimensional factor
kB Boltzmann constant
L Rod length
i
L Length of the connector i
m Power-law index
MWCNT Multi-walled carbon nanotube
n Rod number density
n Refractive index
n’ Real part of the refractive index
Δn’ Birefringence
N1 First normal stress difference
N2 Second normal stress difference n” Complex part of the refractive index
P Hydrostatic pressure
C
Pe Peclet number
PMMA Poly methyl methacrylate
p Unit vector parallel to the principal axis of the rod
p Orientation vector of the rod α
p Orientation vector of the rod β
p
Time evolution of p
p Time evolution of the rod α
p Time evolution of the rod β J
p Time evolution of p (Jeffery equation)
1, 2, 3
p p p Cartesian components of p
PB Polybutene
q Scattering vector
q Dimensionless interaction coefficient
R External radius of the disk in parallel plate geometry
C
r Center of mass of the rod α
C
r Center of mass of the rod β
r - Radial position
- Rod aspect ratio B
S Boltzmann dissipative contribution
eff S Effective stiffness L S Lifshitz contribution O S Osanger contribution
s
Curvilinear coordinate on the rod αs
Curvilinear coordinate on the rod β SEM Scanning electron microscopyT Torque
I
T Interaction torque
r
T Period of rotation of a spheroid
T Absolute temperature
t Time
TEM Transmission electron microscopy
v Velocity vector
v
Velocity vector of the fluid AX Parallel friction coefficient to translation
C
X Parallel friction coefficient to rotation
A
Y Perpendicular friction coefficient to translation
C
Y Perpendicular friction coefficient to rotation
H Y Friction coefficient Greek alphabet
Lagrange multiplier R
Strain evaluated at R
Shear rateR
Shear rate evaluated at R Scalar measure of the rate of deformation tensor
Numerical step in the direction
Numerical step in the directionA
Elementary surface
r Rod relative velocity at the contact point
δ Identity tensor Phase angle ε Permutation tensor Shear viscosity 0 Matrix viscosity r Relative viscosity
*
Complex viscosity'
Real part of the complex viscosity Euler azimuthal angle
Velocity in the direction †κ
Velocity gradient tensorΛ Mobility tensor
0
Mobility constant
- Rod form factor - Wavelength
1, 2, 3, 4
Material constants
σ Stress tensor
τ Deviatoric part of the stress tensor
Volume fraction Euler polar angle
Velocity in the direction Orientation distribution function
p Orientation distribution for the test rod p
p Orientation distribution for the test rod p
Ω
Angular fluid velocityω Antisymmetric part of the velocity gradient
LIST OF APPENDICES
Appendix A – Coefficient numerical discretization ... 184 Appendix B – Confocal microscopy ... 186
CHAPTER 1
1.1 Introduction
Due to their remarkable physical properties, carbon nanotubes (CNTs) are foreseen as the building blocks for the next generation of materials. Many potential applications have been proposed including conductive and high-performance composites, electrochemical devices, hydrogen storage media, chemical sensors, etc. [Baughman et al. (2002)].
Despite such potentialities, complications arise in the processability of CNT suspensions and research on issues such as dispersion, orientation and chemical modifications is currently pursued. CNTs orientation distribution is affected during processing [Jin et al. (1998), Rahatekar et al. (2009)] and it influences various material properties like bulk rheology [Du et al. (2004), Hobbie (2010)], mechanical properties [Thostenson and Chou (2002)], electrical percolation [Du et al. (2005)] and thermal conductivity [Zhou et al. (2004b), Wang et al. (2008)]. Robust methods to quantify and predict the orientation state of CNT systems and to understand the effect of flow on particle orientation are of great interest both academically and industrially [Zhou et al. (2004a), Pujari et al. (2009a), Pujari et al. (2011)].
Furthermore, CNT suspensions present a complex rheological response due to the combination of the CNT high aspect ratios and their colloidal character. Strong shear-thinning behaviour and apparent yield stress are reported in steady simple shear flow [Hobbie (2010)]. When increasing the particle concentration a network is developed, characterized by a well-defined storage modulus and the system behaves like a soft gel [Hough et al. (2004), Hobbie and Fry (2007), Khalkhal et
al. (2011)]. During rest, Brownian motion leads the system to a more isotropic state corresponding
to a structural build-up in terms of rheological properties [Khalkhal and Carreau (2012)]. This thesis focuses on the orientation behaviour of CNT suspensions and on their rheological response. Rheological and rheo-optical methods are used to probe experimentally the microstructure evolution of these suspensions. Moreover, two microstructural models are proposed. The first describes the dynamics of dilute suspensions. A detailed description of the individual particle conformation is used and its connection with average microstructural properties is derived. In the second approach, a microstructural model accounting for rod-rod interactions is
derived in order to explain the shear-thinning behaviour and the transient rheology of CNT suspensions.
This manuscript is composed of 8 chapters. A review of the current literature is presented in Chapter 2. The research objectives and a summary of the articles are reported in Chapter 3. Chapter 4 focuses on the rheo-optical study and on the modified two-rod model. The presentation of the rigid-rod model accounting for rod-rod interactions and the comparison of its predictions with rheological data at steady state is reported in Chapter 5, while transient shear flows are examined in Chapter 6. Finally, a general discussion and the final conclusions are contained in Chapter 7 and 8, respectively.
CHAPTER 2
LITERATURE REVIEW
This literature review focuses on the rheology of carbon nanotube suspensions and it is divided in two main sections. The first section describes the rheology of CNT suspensions and in particular, defines the connection between CNT physical properties and their rheological response in suspensions. The second part reports some of the mathematical descriptions available in the literature to model the behaviour of suspension of rod-like particles. We focus on continuum modelling approaches because they are at the base of the models developed in this work. Direct simulations are not analysed here.
2.1 Carbon nanotubes: experimental characterization
Carbon nanotubes (CNTs) come in two varieties, single-wall (SWCNT) or multi-wall (MWCNT). The multi-wall carbon nanotubes were the first to be discovered and they consist of concentric cylinders placed around a common central hollow area with a constant separation between layers similar to the graphite interlayer spacing (~0.34 nm). Each individual cylinder has different helicity with diameter ranging from 2 to 50 nm and length of several microns. Only in 1993, it was found that the addition of metals as cobalt to the graphite electrodes in the arc evaporation method resulted in tubes with a single wall [Iijima and Ichihashi (1993)]. A single wall nanotube is close to an ideal fullerene fiber and consists of a single cylinder extending from end to end with a narrow distribution in diameter range (1 - 2 nm). SWCNTs are usually stronger and they present smaller diameters (of the order of few nanometers) than MWCNTs (with diameters of usually 10-200 nanometers). CNT aspect ratios (length to diameter ratio) range between 30 and 1000.
CNTs have incredible mechanical properties with Young’s modulus as high as 1.2 TPa and tensile strength of 50-200 GPa [Qian et al. (2002)] which make them the strongest material on earth. Table 2.1 reports a comparison between of physical properties of different carbon materials. It is clear that CNTs offer advantages in terms of thermal and electrical conductivities with respect to the other carbon materials. Thanks to these properties, a wide range of applications are possible like conductive plastics, energy storage materials, catalyst support, air and water filtration, sensing devices and so on [Thostenson et al. (2001), Ma et al. (2010)].
Table 2.1: Physical properties of different carbon materials [Ma et al. (2010)].
Property Graphite Diamond Fullerene SWCNT MWCNT
Specific gravity (g/cm3) 1.9–2.3 3.5 1.7 0.8 1.8 Electrical conductivity (S/cm) 4·103p, 3.3c 10-2-10-15 10-5 102-106 103-105 Thermal conductivity (W/(m K)) 298p, 2.2c (0.9-2.3)·103 0.4 6·103 2·103 Thermal expansion coefficient (K-1) -10-6p, 2.9·10-5c (1-3)·10-6 6.2·10-5 Negligible Negligible
Thermal stability in air
(°C) (4.5-6.5)·10
2 <6·102 ~6·102 >6·102 >6·102
p: in-plane; c: carbon-axis
The rheological properties of CNT/polymer suspensions play a crucial role in processing and manufacturing of composites. However, CNT suspensions rheology is a complex subject since these slender colloidal particles present rheological features between those of rigid rod suspensions and semi-flexible polymers. The rheological behavior of CNT suspensions is a function of concentration, aspect ratio, dispersion and orientation state [Fan and Advani (2007)]. These different aspects are examined in the following sections.
2.1.1 Dispersion of CNTs
In order to achieve the full potential of CNTs as reinforcements, it is necessary to obtain a good degree of dispersion. The entangled CNTs agglomerates produced by synthesis must be broken down to disperse CNTs homogeneously in the polymer matrix [Song and Youn (2005)]. Due to their large aspect ratios and strong van der Waals interactions, the dispersion of CNTs into
polymers is a very challenging task and has been the main bottleneck to the industrial employment of CNTs.
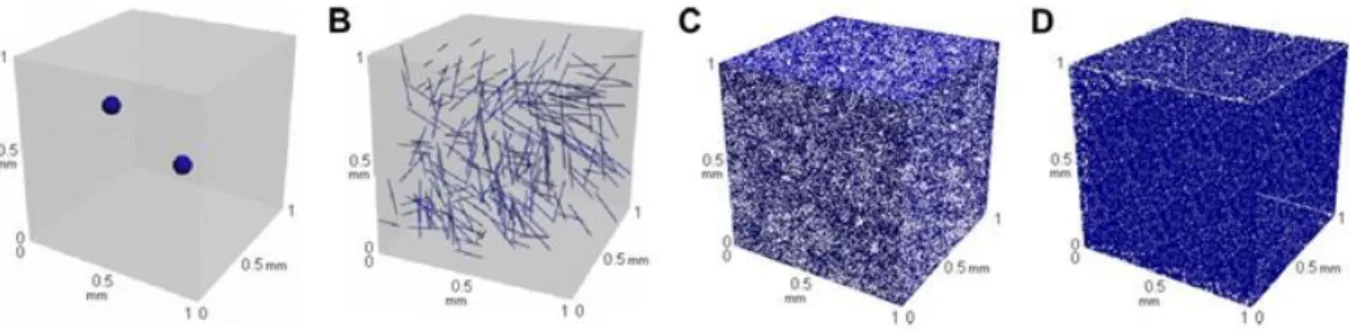
These difficulties can be easily understood by comparing ideal dispersions of micro and nano scale fillers in a polymer matrix at the same volume fraction (0.1 vol.%) as shown in Figure 2.1.
Figure 2.1 Distribution of micro and nano scale fillers of the same 0.1 vol.% in a reference volume of 1 mm3 (A: Al2O3 particle; B: carbon fiber; C: GNP; D: CNT) [Ma et al. (2010)]. In the case of the micro size fillers (cases A and B in Figure 2.1), particles can be easily distinguished. For nanoparticles like graphene nanoplatelets (GNPs) and CNTs (cases C and D in Figure 2.1), the microstructure is completely different. A complex network is formed in the medium where individual nanoparticles cannot be isolated. Interactions between particles are frequent and in the case of poor interfacial properties with the polymer counterpart, re-aggregation phenomena may occur. This simple observation sheds some lights on the difficulties related to nano filler dispersion in composites.
Several techniques have been employed to disperse CNTs in polymeric matrices such as twin screw extrusion [Prashantha et al. (2009)], micro-compounding [Abdel-Goad and Pötschke (2005)], melt mixing in internal mixer [Abbasi et al. (2009a)], three roll milling [Khalkhal et al. (2011)], sonication etc. The method chosen depends on the viscosity of the matrix and on the operating conditions. The idea behind all these techniques is to take advantage of high shear and elongational stresses to break down the CNT agglomerates. At the lab scale, the three roll mill machines has been successful in achieving fine dispersions with thermoset polymers, however this tool is not yet applicable to thermoplastic polymers [Schulz et al. (2011), Khalkhal et al. (2011), Olowojoba et
As an alternative to direct mixing, the use of solvents can improve the quality of dispersion since solvents reduce the viscosity of the medium and facilitate the diffusion of particles. However, after mixing, the solvent needs to be removed, which is time consuming and non-environmentally friendly. In addition, the separation process of the solvent becomes more difficult with increasing filler content and some residual trace of solvent can remain in solution. This could affect the rheological properties of the suspension [Khalkhal (2012)].
Another possibility to improve the CNT dispersion is to modify chemically or physically the nature of carbon nanotube surface [Lee et al. (2007)]. This route will not be analyzed in detail here since it was not investigated in this work. However, a concise presentation of most common approaches is reported since its great importance in manufacturing nano-composites.
Chemical functionalization of CNTs is a mean to improve the affinity between CNTs and the polymer matrix. The attachment of functional entities on the CNT sidewalls is associated with a change of hybridization from sp2 to sp3 and a loss of π-conjugation on the graphene layer. This structural change can be obtained with the use of molecules with high chemical activity, such as fluorine [Mickelson et al. (1998)]. The C-F bonds in the fluorinated CNT can be replaced by amino, alkyl and hydroxyl groups [Touhara et al. (2002), Stevens et al. (2003)]. In addition to fluorination of CNTs, similar methods, including cycloaddition [Tagmatarchis and Prato (2004)], chlorination, bromination [Unger et al. (2002)], hydrogenation [Kim et al. (2002)] and others, have also been employed in the recent years. Attachment of oxygen containing functional groups (carboxyl, carbonyl, hydroxyl groups, etc.) on the surface of CNTs could be achieved by applying several oxidative processes such as strong acids (HNO3, H2SO4) or a mixture of them [Esumi et al. (1996), Lee et al. (2007)], ozone [Sham and Kim (2006)] or reactive plasma [Wang et al. (2009), Ávila-Orta et al. (2009)]. It is well known that carboxylic and hydroxyl groups can be used as precursors for successive modifications specific to the nature of the bulk polymer chosen.
However, functionalization has large drawbacks since modification of CNT surface morphologies causes defect formations which have detrimental consequences on the CNT mechanical and transport properties. In extreme cases, functionalization can break down the tubes and, hence, decrease their length (and aspect ratio).
Therefore, physical compatibilization is an interesting alternative to tune interfacial properties of nanotubes. Small-molecule surfactants that naturally form rod-like micelles in aqueous solutions [Wenseleers et al. (2004)] or wrapping polymers such as DNA [Badaire et al. (2005)] have been used to disperse CNTs, but their effectiveness decreases markedly with increasing nanotube concentration. In addition, surfactants generally reduce the electrical conductivity of the network by several order of magnitude [Hobbie (2010)].
Different dispersion states lead to different rheological and mechanical behaviors. Du et al. (2004) examined the effect of dispersion of single-walled carbon nanotubes (SWCNTs) in poly(methyl methacrylate) (PMMA). They produced three SWCNT/PMMA suspensions of different dispersions quality at the same concentration. They found that nanotubes dispersion impacts the viscoelastic properties of the resulting nanocomposites. The best dispersed samples presented higher values of the storage modulus, G’, and a plateau at low frequencies in small amplitude oscillatory shear, SAOS, which suggests the formation of a network.
Huang et al. (2006) worked with MWCNTs in polydimethylsiloxane (PDMS). The samples were dispersed using an Ika Labortechnik mixer with rotation speed of the paddle of 1000 rpm and temperature of ~30 °C. The main objective of their work was to develop an alternative rheological method to monitor the dispersion state. First, they studied the effect of mixing time on the reproducibility of rheological data. The rheological measurements presented an erratic behavior for short mixing times but after a certain period of mixing, called the “characteristic or critical time”, these erratic values turned to a plateau value as shown for the real part of the complex viscosity in Figure 2.2. The characteristic time increased with CNT loading but overall, such change in viscosity with mixing time occurred for all the mixtures investigated.
Figure 2.2 Real part of the complex viscosity,
'
, at 50 Hz, against time of mixing, for a range of different weight fractions of nanotubes. The arrows mark the critical time for each concentration[Huang et al. (2006)].
Huang et al. (2006) suggested that the reason behind the large discrepancies in the rheological percolation threshold reported in the literature might arise from two distinct possibilities. First, when the suspension is mixed for longer time than its characteristic time, one may reach or exceed the percolation threshold by forming a well dispersed and homogenous network of nanotubes. Hence, the rheological response would become that of an elastic solid. Second, mechanical (rheological) percolation could take place when individual aggregates, or tube clusters at mixing time lower than the characteristic time, come into contact and form chains of aggregates through the medium. This second type of aggregate-mediated jamming may be responsible for much higher threshold concentrations.
An empirical method suggested to quantify nanotube dispersion is the evolution of the peak of the loss factor, tan(δ), with increasing mixing time as shown in Figure 2.3 for samples of 7 wt % CNT in PDMS.
Figure 2.3 Data for tan (δ) against frequency for 7 wt % CNT-PDMS samples mixed for different times (tested immediately after mixing) [Huang et al. (2006)].
This type of behavior was also confirmed for a suspension of 4 wt % CNTs. Huang et al. (2006) findings demonstrated that rheological measurements can be used as probe for the dispersion state. However, the authors did not show direct or indirect observations of their systems microstructure after such long mixing time (for a 7 wt % CNT suspension, the required mixing time is of about 23h). Furthermore, the characterization of the nanotubes dispersion is also a difficult process due the length scale involved in nano composites. The most common techniques used are: optical and confocal microscopy, scanning electron microscopy (SEM) and transmission electron microscopy (TEM). A superficial evaluation of the dispersion can be performed by optical microscopy. The quality of the dispersion can be qualitatively studied by uniformity of light intensity when viewed in transmission mode, where heterogeneities in nanotubes density are apparent at size scales greater than ~10 μm [Du et al. (2004)]. Dispersion at a finer length scale can be probed by imaging fracture surfaces of nanocomposites using SEM or on ultramicrotomed surfaces with TEM. However, these techniques require samples in the solid state.
2.1.2 Rheology of CNT suspensions
The rheology of CNT suspensions is of fundamental importance for the design and optimization of any processing scheme. CNT suspensions present a complex rheological behavior due to their quasi unidimensional structure, their colloidal character and the attractive van der Waals forces acting
on the rods. In addition, the high aspect ratio of these particles, when coupled with inter-particle attraction and Brownian motion, often favors the formation of rigid-rod networks or gels at remarkably low concentrations [Hough et al. (2004), Hobbie (2010)].
The rheological response of colloidal rod like particles in suspensions is strongly dependent on the regime of the concentration probed. Three concentration regimes have been defined in the literature for rod-like particles: dilute, semi-dilute and concentrated regime [Doi and Edwards (1986)].
Figure 2.4 Phase behavior of a suspension of Brownian rigid rods [Doi and Edwards (1986)]. The dilute regime is defined by the constraint:
nL
3
1
where n is the number density of the particles and 𝐿 is the length of the rod. This ensures that the individual rods are able to rotate freely. The semi-dilute regime is limited betweennL
3
1
andnL D
2
1
and the shear viscosity varies as a quadratic function of the concentration. These constrains imply that rods can overlap. Since the volume fraction is still sufficiently low, the static properties are not influenced by the excluded volume interaction being of the order ofL D
2 , but the dynamical ones are. At concentration higher thannL D
2
1
multiple particle interactions are more frequent and terms which depends on powers of the volume fraction higher than 2 become more and more important. For Brownian rod-like particles interacting only with excluded volume effects, there will be a critical concentration at which the system will spontaneously form first a biphasic phase, where there will be coexistence of domains with an isotropic and aligned orientation state and, then, a complete nematic phase (liquid crystal) (Figure 2.4).The effect of nanotube concentration can be clearly observed in small angle oscillatory shear (SAOS). Because of attractive forces and Brownian motion, the increase of concentration brings
the establishment of a CNT network through the system, accompanied with a transition from liquid to solid like behavior [Du et al. (2004), Pötschke et al. (2004), Abdel-Goad and Pötschke (2005), Fan and Advani (2007)]. This can be appreciated by analyzing the moduli and/or complex viscosity versus frequency. In particular, the appearance of a plateau at low frequencies of the storage modulus is a noticeable sign of the liquid to solid-like transition as shown in Figure 2.5.
Figure 2.5 Storage modulus, G’, of PC and PC/MWCNT composites as a function of frequency [Abdel-Goad and Pötschke (2005)].
The onset of the solid like behavior has been explained as the concentration at which the size of polymer chains is larger than the separation between the nanotubes [Du et al. (2004)] or as the concentration when the polymer chain entangles with the CNTs to create a network [Pötschke et
al. (2004)].
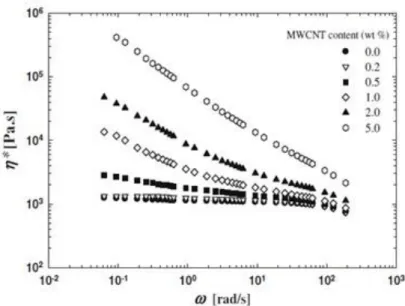
Abbasi et al. (2009a) reported similar results for MWCNTs and polycarbonate systems. The low frequency values of complex viscosity (Figure 2.6) significantly increase with the addition of MWCNTs indicating that the long polymer chain relaxation in the nanocomposites is effectively restrained by the presence of the nanotubes. Shear-thinning behavior also appears progressively.
Figure 2.6 Complex viscosity of polycarbonate/MWCNTs as a function of frequency at 230 °C [Abbasi et al. (2009a)].
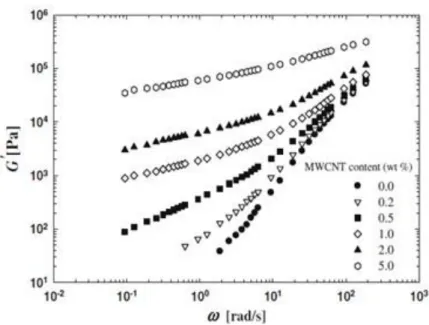
The dependence of G’ on 𝜔 at low frequencies becomes very weak as the concentration of MWCNTs increases (as showed in Figure 2.7). Increasing the filler content, nanotube-nanotube interactions become dominant and the percolated network restrains the long range motion of the polymer chains. At high frequencies the effect of the nanotubes on the rheological behavior is relatively weak. This behavior suggests that CNTs do not significantly affect the short-range dynamics of the polymer chains [Du et al. (2004)]. Similar rheological behavior have been observed by many authors: Du et al. (2004), Meincke et al. (2004), Fan and Advani (2007), Lee et
Figure 2.7 Storage moduli of polycarbonate/MWCNT as a function of frequency at 230 °C [Abbasi et al. (2009a)].
The presence of a network can also be verified by electrical/thermal conductivity analysis and a comparison with the rheological data could help understanding the effects on the microstructure. Generally, polymers are really good insulators but the presence of a conductive filler such as CNTs can modify the conductivity of the system by different orders of magnitude. Du et al. (2004) compared the effect of SWCNT loading in poly (methyl methacrylate) (PMMA) on the rheological and electrical properties as reported in Figure 2.8.
Figure 2.8 (a) Storage modulus, G’, of SWCNT/PMMA nanocomposites as a function of the nanotube loading at a fixed frequency of 0.5 rad/s. Insert: a log-log plot of G’ vs reduced mass fraction. (b) Electrical conductivity, 𝜎, of SWCNT/PMMA nanocomposites as a function of the nanotube loading. Insert: a log-log plot of electrical conductivity vs reduced mass fraction. Note
that 𝛽𝜎 is significantly larger than 𝛽𝐺′ due to the larger magnitude of the change in 𝝈 at the threshold [Du et al. (2004)].
Figure 2.8 (a) shows that G’ increases drastically between 0.1 and 0.2 wt% loading, indicating a sudden change in the material structure, typical of a percolated system. Similar changes can be observed in the electrical conductivity. However, the sharp change appears only at larger loading values ~0.4 wt% (Figure 2.8 (b)). Different tube-tube distances are required for rheological and
electrical percolation. In this particular system, assuming valid the electron hopping mechanism, the rod-rod distances required to create a conductive path in the medium are ~5 nm. To have rheological percolation, the nanotube network needs to restrain polymer motion and this requires that the rod-rod distances are at least comparable to the diameters of random coils of polymer chains, which in this case are equal to ~18 nm. Thus, higher nanotubes content is needed to reach the electrical conductivity threshold due to the shorter distances required [Du et al. (2004)]. Because of their high aspect ratio, CNTs should be the ideal candidates for the formation of a lyotropic nematic liquid crystal. Unfortunately, this entropically driven phase is really hard to achieve because of the polydispersity in particle aspect ratios and of attractive interactions that have the effect of widening the biphasic regime. Lyotropic liquid crystalline formation was reported for SWCNTs dispersed in superacids [Davis et al. (2003)], stabilized with DNA [Badaire
et al. (2005)] or dispersed in conjugated polymers [Lee et al. (2009), Allen et al. (2013)]. Figure
2.9 shows an example of a liquid crystalline phase of SWCNT in a conjugated polymer obtained by Allen et al. (2013).
Figure 2.9 Evaporation of a drop of SWCNT/poly (3-hexylthiophene) (1:1) in 1, 2- dichlorobenzene placed between crossed polarizers. The change in light intensity represent the
different aligned domains. (A) Before and (B) after evaporation [Allen et al. (2013)]. Such liquid crystal state could improve the processing of concentrated CNT suspensions, owing to the mutual spontaneous alignment and the reduced shear viscosity of the nematic phase [Davis et
al. (2003)]. However, for the reasons cited above, a dense and isotropic network seems to be the
most common high-concentration scenario [Hobbie (2010)].
Recently, Khalkhal and Carreau (2012) studied the non-linear rheological response of MWCNTs in a Newtonian epoxy matrix. By applying a constant shear rate to a CNT suspension, the shear stress present a clear overshoot at very low strains [Pujari et al. (2011)].
Figure 2.10 Transient stress data of a 2wt% MWCNT/epoxy suspension at shear rate of 1 s-1 [Khalkhal and Carreau (2012)].
By applying two consecutive stress growths, the overshoot in the shear stress disappears if no rest time is allowed between the two tests. If a certain rest time is allowed between two consecutive stress growths, the overshoot reappears again and its intensity is proportional to the duration of the rest time [Khalkhal and Carreau (2012)]. During rest, the system keeps evolving thanks to Brownian motion which helps to reform the network. This can be clearly observed by analyzing the storage modulus after a shearing step. G’ decreases by increasing the shear rate until a critical shear rate is reached, however during rest, the network in the system is slowly restored.
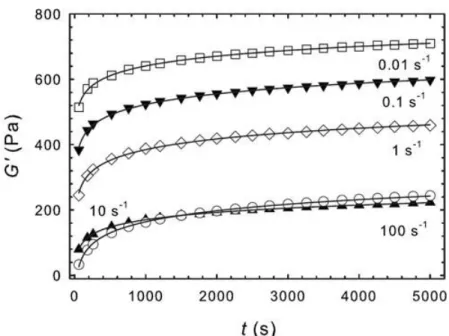
Figure 2.11 Development of G’ at 1 rad/s for a 2 wt% MWCNT/epoxy suspension after cessation of shear flow for different shear rates [Khalkhal et al. (2011)].
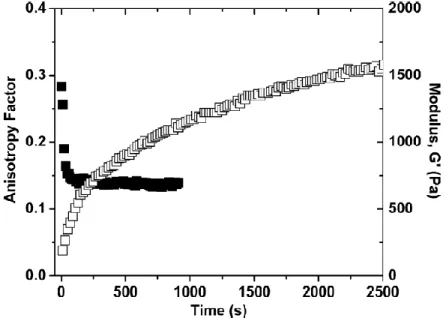
This behavior was also reported for nano-clays platelets by Mobuchon et al. (2009a). However, the full understanding of this structure build-up is not clear. Pujari et al. (2011) studied the microstructure evolution of concentrated MWCNT suspensions with small and wide angle x-ray scattering (SAXS and WAXS). Their rods were essentially non Brownian. During rest they monitored the x-ray scattering and calculated the anisotropy factor (AF) relative to the scattering patterns. The anisotropy factor is defined as
2 24
i i j j i j
AF q q q q q q (2.1)
where q is the scattering vector. The AF quantifies the degree of anisotropy in the 2D scattering patterns. They observed a fast change of AF at short time scale which was not possible to correlate with the low diffusion coefficient of their systems (Figure 2.12). Hence, they hypothesized that a portion of the shear-induced orientation was lost due to an elastic deformation of the rods within highly entangled clusters. Upon flow cessation the elastic energy stored during flow was released causing the fast change in AF. In more dilute samples, they did not observe such behavior and, hence, they attributed it to the presence of elastic clusters in concentrated systems [Pujari et al.
(2009a)]. This implies that the flexibility of these rods plays an important role in their suspension dynamics [Switzer III and Klingenberg (2003)].
Figure 2.12 Anisotropy factor (filled symbols) and storage modulus (empty symbols) for a 2 wt% MWCNT suspension measured following flow cessation of steady shear at 200 s-1 [Pujari et al.
(2011)]
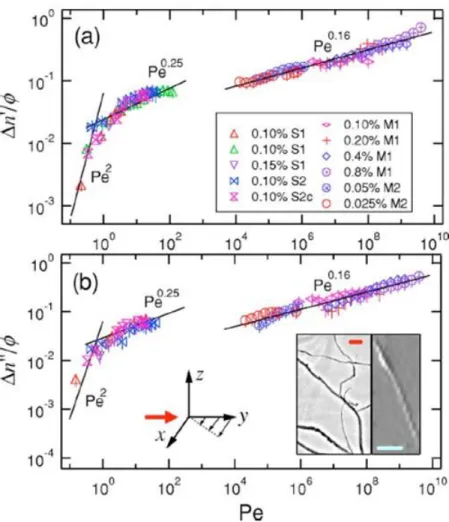
In addition, Pujari et al. (2009a) and Pujari et al. (2011) reported progressive alignment of the rods in the flow direction by increasing the shear flow intensity. This shear-induced alignment was previously reported in the innovative work of Fry et al. (2006) where they probed the microstructure with a modulation polarization technique. Single- and multi-walled CNTs were analyzed in dilute and semi dilute regimes. Birefringence (Δn’) and dichroism (Δn”), respectively the real and complex parts of the refractive index tensor, were analyzed.
Figure 2.13 Scaled birefringence (a) and dichroism (b) as a function of Peclet number. The solid lines represent power-law fits as indicated. The left inset show a TEM of MWCNT (scale bar of 250 nm). The right inset is an AFM image of SWCNT (scale bar of 150 nm) [Fry et al. (2006)]. They found that the overall degree of alignment was proportional to Pe2 in the range of small Pe for dilute suspensions and in semi-dilute suspensions for Pe<200 it scaled as Pe0.25 as shown in Figure 2.13. These findings are in good agreement with the Doi and Edwards (1986) theory for rigid rods. In the limit of infinite Pe (Pe between 105 and 1010), the scaled birefringence and dichroism increased as Pe0.16. This response is weaker compared with the exponent (0.25) found at lower Pe, suggesting that rod deformation might influence the orientation behavior of these suspensions.
2.1.3 Flow induced microstructure
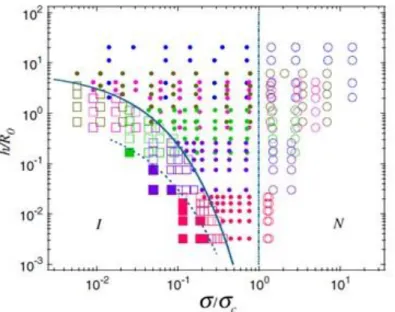
Flow can create anisotropic organization of suspending particles if interactions between particles are comparable to hydrodynamic forces [Vermant and Solomon (2005)]. When external shear stresses are applied to the suspension, mechanical entanglements and flow-induced clustering can be observed [Hobbie and Fry (2007), Rahatekar et al. (2006b)]. In the case of CNT suspensions, different types of microstructures have been reported as function of the shear stress by Hobbie and Fry (2006). When a certain stress is applied to a network structure, the network is gradually destroyed and fragmented into clusters (or flocs) that then flow as microscopic bodies. Increasing the shear stress or shear rate, the size of these aggregates decreases and, eventually, the scale of an individual nanotube is approached. This breakup can be quantitatively appreciated by analyzing the shear-thinning effect in steady state viscosity and a critical stress for homogenization, 𝜎𝑐, can be defined as the shear stress corresponding to the state when clusters are visually absent from the suspension at the microscopic scale. Before reaching the critical stress, Hobbie and Fry (2006) found that the suspension passed through a series of states with different morphologies. The phase diagram is showed in Figure 2.14, the onset of full dispersion corresponds to the vertical line 𝜎 𝜎⁄ 𝑐 = 1: on the left extreme, there is an isotropic elastic network (I) while on the right extreme there is a fully dispersed flow aligned (N) state. From the left side, one finds a fragmented network, vorticity banding, and isolated aggregates denoted in the sequence defined by increasing shear rate or shear stress, while to the right of the onset of full dispersion, the suspension consists entirely of flow-aligned individual nanotubes.
Figure 2.14 Scaled “phase diagram” describing the evolution from a solid-like disordered network (I) to a flowing nematic (N) for MWCNTs suspended in a low molecular weight
polymer solvent, where concentration increases from top to bottom. Open circles are (para)nematic, closed circles are isolated aggregates, open squares are vorticity bands, and closed
squares are cavitated networks. The vertical dashed line marks the stability limit. Colors denote MWNT mass concentration; blue (0.025%), brown (0.1%), pink (0.4%), green (0.85%), purple (1.7%), and magenta (3%). The parameter h denotes gap and R0 represents the mean aggregate
size in the limit of large gap and weak shear [Hobbie and Fry (2006)].
Rheo-optical studies can be used to understand better the formation mechanism of these flow- induced states, as reported by Ma et al. (2007). They studied MWCNTs in an epoxy matrix using a strain-controlled rheometer with 50 mm parallel plates and a gap size of 130 μm. While the suspensions were sheared, optical micrographs were taken to study the microstructures (Figure 2.15).
Figure 2.15 The effect of time and gap size on the formation of helical bands (HBs). The shear rate for all conditions was fixed at 0.5 s−1. Direction of flow is vertical as indicated [Ma et al.
(2007)].
With the application of shear, collisions occurred between CNTs and diffuse aggregate structures were interlocked to progressively form helical bands (HBs) aligned perpendicularly to the direction of flow as shown in the time evolution series of Figure 2.15 a, b and c. The gap size at which the shear is applied influences both the formation kinetics and the final diameter of the HBs. Applying shear rate of 0.5 s-1 , HBs were formed within a shear time of 600 s, for gaps lower than 180 𝜇𝑚. However at a gap of 230 𝜇𝑚, no clear HB structure was created. Thus, the confining effect of the gap plays an important role in the formation of such anisotropic structures. Hence, the presence of HBs may be derived from a mechanical and geometrical mechanism rather than being of rheological origin as proposed by Lin-Gibson et al. (2004). Ma et al. (2007) also observed that at high shear rate, the HBs, formed in the vorticity direction, broke up in a less clearly defined state that was aligned predominantly in the shear direction. The breakup of HBs in separated aggregates and the consequent alignment came with a certain shear thinning behavior of the suspension. However, during the change in microstructure from isotropic aggregates to HBs, no effects on the
![Table 2.1: Physical properties of different carbon materials [Ma et al. (2010)].](https://thumb-eu.123doks.com/thumbv2/123doknet/2341599.33966/31.918.94.818.176.630/table-physical-properties-different-carbon-materials-ma-et.webp)
![Figure 2.5 Storage modulus, G’, of PC and PC/MWCNT composites as a function of frequency [Abdel-Goad and Pötschke (2005)]](https://thumb-eu.123doks.com/thumbv2/123doknet/2341599.33966/38.918.268.666.314.604/figure-storage-modulus-mwcnt-composites-function-frequency-potschke.webp)
![Figure 2.10 Transient stress data of a 2wt% MWCNT/epoxy suspension at shear rate of 1 s -1 [Khalkhal and Carreau (2012)]](https://thumb-eu.123doks.com/thumbv2/123doknet/2341599.33966/44.918.222.704.138.477/figure-transient-stress-mwcnt-epoxy-suspension-khalkhal-carreau.webp)