CIRPÉE
Centre interuniversitaire sur le risque, les politiques économiques et l’emploi
Cahier de recherche/Working Paper 05-08
Low-fee ($5/day/child) Regulated Childcare Policy and the Labor
Supply of Mothers with Young Children: a Natural Experiment from
Canada
Pierre Lefebvre Philip Merrigan
Mars/March 2005
_______________________
Address for correspondence: Pierre Lefebvre, Economics, UQAM, CP 8888, Succ. Centre-ville, Montréal, QC, Canada H3C 3P8. Tel. (514) 987-3000 #8373; Fax (514) 987-8494
lefebvre.pierre@uqam.ca
We thank Nour-Ed-Dine Barmaki for his excellent research assistance. The authors are grateful to Jean-Pierre Simard and Ugo Ceppi for their helpful comments/suggestions on earlier versions of this paper, and especially Gordon Cleveland for his very detailed review. This analysis is based on Statistics Canada’s Survey of Labour and Income Dynamics (SLID) restricted-access annual (1993-2002) Microdata Files, which contain anonymized data collected in the SLID and are available at the Quebec Inter-university Centre for Social Statistics (QICSS), one of the Canadian Research Data Centres network. All computations on these microdata were prepared by Pierre Lefebvre and Philip Merrigan. The responsibility for the use and interpretation of these data is entirely that of the authors. This research was partly funded by CIRANO-Québec’s Department of Finance research partnership, the Social Sciences and Humanities Research Council of Canada and the Fonds québécois de la recherche sur la société et la culture.
Abstract:
On September 1st, 1997, a new childcare policy was initiated by the provincial government of Quebec, the second most populous province in Canada. Childcare services licensed by the Ministry of the Family (not-for-profit centres, family-based childcare, and for-profit centres under the agreement) began offering day care spaces at the reduced parental contribution of $5 per day per child for children aged 4 years. In successive years, the government reduced the age requirement and engaged in a plan to create new childcare facilities and pay for the cost of additional $5 per day childcare spaces. By September 2000, the low-fee policy applied to all children aged 0 to 59 months (not in kindergarten) and the number of partly subsidized spaces increased from 77,000 in 1998 to 163,000 spaces, totally subsidized by the end of year 2002, while the number of eligible children, zero to four years old, declined from 428,000 to 369,000 over the same period.
Using annual data (1993 to 2002), drawn from Statistics Canada’s Survey of Labour and Income Dynamics (SLID), this study attempts to estimate the effect of the policy on the labor supply behavior of Quebec mothers with pre-school children, aged from 0 to 5 years old. The analysis examines the impact of the policy on the following outcomes : labor force participation, annual number of weeks and hours at work, annual earned income and whether the job was full-time for mothers who declared having a job during the reference year. A non-experimental evaluation framework based on multiple pre- and post-treatment periods is used to estimate the effect of the childcare regime.
The econometric results support the hypothesis that the childcare policy, together with the transformation of public kindergarten from a part-time to a full-time basis, had a large and statistically significant impact on the labor supply of Quebec’s mothers with pre-school children. The estimates also suggest, though less convincingly, that the size of the impact increased concurrently with the positive growth in the number of low-fee spaces
Keywords: Mother’s labor supply, preschool children, childcare subsidy, natural experiment
On September 1st 1997, the government of the province of Quebec1 in Canada implemented a
new policy of day care subsidies. From that day on, accredited day care facilities offered subsidized day care (the $5 per child per full-day fee policy) for children who were 4 years of age on September 30th 1997. The government also promised to progressively decrease (every year) the age requirement
for subsidies and increase the number of subsidized day care spaces, targeting a number of 200,000 for 2006 (compared to 79,000 available in late 1997).
This new policy was integrated within major changes in family policy including a new unified child tax benefit contingent on family income (replacing universal child allowances) harmonized with the federal child tax benefit of the government of Canada, full-time publicly-provided kindergarten in a school setting (in place of half-day kindergarten), and $5 per day before- and after-school day care for kindergarten-age and grade school children.
The policy pursued three major objectives: to fight poverty, to increase mothers’ participation in the labor market, and to enhance child development and equality of opportunity for children. These goals are not particular to Québec and have been observed in several countries since the eighties as early childhood education and day care public policies have spearheaded family policy.2
Despite the large amount of public funds dedicated to this program – direct public subsidies to childcare services increased from $209 million in fiscal year 1995-96 to $1.4 billion in year 2004-05 – there is not one study that examines whether the objectives pursued by this policy have been reasonably met.
Using annual data (1993 to 2002), drawn from Statistics Canada’s Survey of Labour and Income Dynamics (SLID), this study contributes to filling this gap by analyzing the effect of the policy on the labor supply behavior of Quebec’s mothers with pre-school children (zero to 5 years of age). The analysis examines the impact of the policy on the following labor supply outcomes: labor force participation for two different months in the same year (April and August), annual number of weeks and hours worked, annual earned income as well as full-time participation for mothers who declared having a job during the reference year. A non-experimental evaluation framework based on multiple pre- and post-treatment periods is used to estimate the policy effects. Québec’s mothers, the treatment group, are compared with mothers having children of similar ages in the other provinces, the control group, over several years.
1 Québec, which is mainly French speaking, represents approximately 25 percent of the Canadian population. 2 The approach is similar to the ones adopted by several European countries. See OECD (2001) for a review of early childhood education and care policies, and Blau and Currie (2004) for a larger discussion and a presentation of American initiatives in that domain.
The econometric results support the hypothesis that the childcare policy together with the transformation of public kindergarten from a part-time to a full-time basis had a large and statistically significant impact on the labor supply of Quebec’s mothers with pre-school children.
The rest of the paper proceeds as follows: Section 1 presents public policy pertaining to childcare across Canada and traces the unique evolution of Québec in this regard. Section 2 identifies the conceptual issues and lays the framework for the econometric analysis. Section 3 describes the data set used to perform the analysis and presents descriptive statistics. Section 4 contains the empirical results which are discussed in section 5 with their policy implications. Section 6 identifies extensions for future research on this topic.
1. Childcare policy in Québec and across Canada
There are a substantial number of studies showing that young children have a strong negative impact on their mother’s labor supply. The pioneering work of James Heckman (1974) was the first to show than an increase in childcare costs reduces the mother’s labor supply and the number of hours worked (conditional on employment).3 Several measures can be used to reduce the burden of
childcare expenditures and encourage the labor market participation of mothers with young children. In Canada, two major policy instruments have been implemented over the last 15 years: (1) at the federal and provincial level, a tax deduction for day care expenses; (2) at the provincial level, childcare fee subsidies that depend on family income and are geared to low-income families. In some provinces, small subsidies are directed to licensed centres and regulated day care providers and are based on start-up costs, capital costs of providing childcare and operating costs that vary with the number of children. The last approach, directing subsidies to providers was favoured by the government in Québec for the implementation of its low-fee policy.
Since 1972 at the federal level and in all provinces, the tax deduction for childcare expenses has subsidized childcare expenses. Currently, up to $7,000 of childcare expenditures per child less than 7 years of age and up to $4,000 for other children less than 17 can be deducted from taxable income.4 Since 1983, the deduction can be claimed only by the spouse with the lowest income, and
provides assistance only for individuals who would pay taxes without the deduction. In 1994, the
3 For a review of the empirical literature which is mostly American, see Blau and Currie (2004), and Blau (2003). For results in the Canadian context, see Cleveland, Gunderson and Hyatt (1996), Powell (1997, 2002), and Michalopoulos and Robins (2000, 2002). Choné et al. (2004) summarize the findings for France.
4 In 1992, the maximum deductions were respectively $5,000 and $3,000; in 1998 they were increased to $7,000 and $4,000. The provision is formulated in such a way that expenditures for day camp and summer camp may be considered childcare expenses.
government of Quebec, which had its own provincial deduction, converted it into a refundable tax credit for childcare expenses which is more generous as family income decreases, compensating families for 26 to 75 percent of childcare expenses.5
The 1966 cost-sharing arrangements between federal and provincial governments (to finance social assistance and the provision of welfare services) provided provincial governments with funds to finance day care for low-income families. Since childcare is an area of provincial jurisdiction in Canada, each province was free to set its own financial and social criteria for eligibility to subsidized care. Table A1, taken from Doherty et al. (2003), shows the fee-subsidy policy of each province for the year 2001. Policy in provinces other than Quebec remained largely unchanged during the nineties (although fee subsidy eligibility levels and rates have been raised modestly in some provinces6) and the number of children in subsidized day care remains very low.7 The constancy of subsidy policy in
the rest of Canada is relevant, given our estimation methodology.
The “National Children’s Agenda” is another noteworthy policy initiative. In 1998, the federal government modified its child tax benefit (targeted to low income families) making it more generous (and increasing the benefit over the following years). Most provinces either reduced basic welfare benefit rates by the amount of the federal child tax benefits or achieved the same results by treating them as non-exempt income for the purposes of calculating welfare payments (welfare is a provincial responsibility). In return for their welfare savings, provinces agreed “to invest” more than the savings in new cash transfers or services directed to all low-income families with children (to provide incentives for families to move from social assistance to employment by assisting them with the cost of raising their children, making it easier for low-income parents to support their families through employment; and promoting attachment of families to the work force). This initiative gave birth to a host of provincial programs some seeking to increase day care subsidies and make work pay for parents with low earnings
5 The conversion rate used the highest marginal tax rate, so that no family incurred a financial loss after the change. The maximum amounts for the federal deduction and the Quebec tax credit are the same. However, the $5/day parental contribution paid to licensed and regulated providers can not be claimed as an expense for Québec’s refundable tax credit but can be claimed at the federal level as childcare expenses for the deduction.
6 Friendly et al. (2003) present a tentative estimate of the number of children in these day care programs in 2001. 7 Cleveland and Hyatt (1998) present the fee-subsidy policy of each province for the year 1995.
potential.8 However, the amount of spending in licensed and regulated day care by provinces
other than Québec, in the context of this initiative, has been very modest9.
The implementation of Québec’s child care policy (1997-2002)
Table 1 presents an overview of public policy measures related to childcare and kindergarten for pre-school children in Québec and other provinces for the time period of this analysis. The first part of the Table shows how the $5 per day childcare policy was implemented from year to year. Table 2 presents the evolution of the number of spaces partly or totally subsidized by the government from 1993-1994 to 2003-2004 by type of childcare setting as well as the total number of Québec’s children in different age groups by year.
Before September 1997, in Québec, some subsidies partially covering fixed costs were directed to all licensed and regulated childcare arrangements, and low-income families received a fee subsidy according to eligibility criteria (see Table 11 for the amount of public funds dedicated to childcare). The fees charged by the providers were not regulated. It was on September 1st 1997 that the maximum fee of $5 per day for children aged 4 was introduced for providers receiving public subsidies. Notice that it is only since September 2000 that all children under 5 have had access to publicly supported day care for the maximum fee of $5 per day. The first phase concerned primarily children who were three or four years old. It is possible that most of the mothers of these children were already in the labor market when the policy was implemented and that they were the first to benefit from the subsidies. Hence, the labor supply effect should be weaker for the first years of the program. The rate of growth of subsidized spaces increased in the third year of the program (childcare facilities and spaces are created throughout the year).
Since the introduction of the policy, it is well known that the program has not been able to satisfy all of the increased demand for low-fee spaces.10 Table 2 shows that in 2000, at most 29% of
8 See Lefebvre and Merrigan (2003) for an analysis of this plan and the official presentation at the web site
http://socialunion.gc.ca
9 Friendly et al. (2003) estimate (Table 15) that approximately 7% of the $535 million spent by provinces (excluding Québec) in 2000-2001 for this initiative was dedicated to regulated childcare.
10 The web site of the Department in charge of family policy offers the following advice: “First of all, you must decide whether you want childcare in a facility (childcare centre or day care centre) or in a home environment. Then find out which childcare establishments are located near your home or place of work. In order to have a wide choice, it is best to start looking ahead of time, even as much as a year in advance. Otherwise, there may not be room in the childcare establishment that suits you best when you need it. If you put your child on a waiting list, it is more likely that she/he will be accepted when the time comes for you to use child care. Establishments regulated by the Ministère de l’Emploi, de la Solidarité sociale et de la Famille generally fill up quickly. This is explained by the establishment’s good reputation and the possibility of obtaining places for a reduced monetary contribution or with other forms of financial assistance.”
all children aged 0 to 4 years had access to a subsidized space or 35% of all children aged 1-4 years (according to number of spaces in March 2000). It is difficult to obtain data on the number of children on waiting lists with no access to a subsidized space. It is possible however that some mothers may have joined the labor market anticipating the opening of a space for their child. This hypothesis however will be more difficult to test given the data at hand.
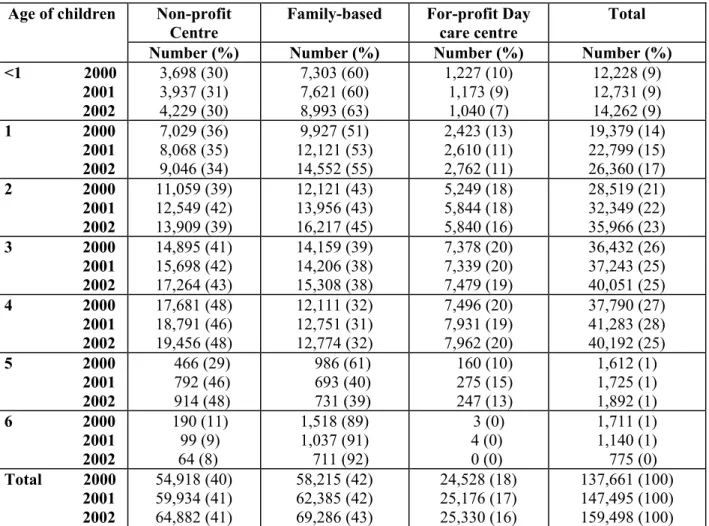
Table 3 shows the distribution of the number of children for each age group in subsidized day care for the years 2000-2002.11 The largest increases in spaces used are for children who are 1 or 2
years old. The share of children 3 or 4 years old, despite being the largest, has decreased since 2000. Only 17% of children less than one are in subsidized day care in 2002 compared to 45% for the 3 or 4 years. A recently enhanced federal maternity- and parental benefits program (available in all provinces) has tempered the need for day care during the child’s first year of life.12
Additionally, the Québec program subsidizes parents who cannot afford the $5 per day fee. Table 4 shows the number of children from very low-income families who see their fee waived and are in free subsidized spaces from 1999 to 2003. The share of children from disadvantaged families in subsidized day care is very small. This is a major failure of the policy given its objectives.13
We cannot trace a similarly elaborate picture of the evolution of childcare services for other provinces in Canada, but the number of children in subsidized-fee day care is very small relative to Québec.14
Childcare use in Canada: what are the arrangements and how much?
It is also difficult to obtain a larger picture of day care utilization, arrangements and reasons for the use of day care across Canada. The last national survey on childcare use was conducted in 1988. Other than licensed centres and family-based regulated day care, parents can choose
11 Such detailed numbers are unavailable before 2000.
12 Employment Insurance, a federal program, pays maternity benefits to biological mothers with insurable employment for work missed because of pregnancy and childbirth for a maximum of 15 weeks. Since year 2001, hours worked necessary to qualify for benefits were reduced from 700 to 600. Since December 1999, supplementary parental benefits payable to biological and adoptive parents who experience a separation from work to care for a newly born or adopted child increased from a maximum of 10 to 35 weeks. According to a Statistics Canada study (Corak, 1999) in 1998 approximately half of families with a newborn received benefits. The statistics of the Employment Insurance Commission (2004) show that 60 percent of families with a newborn received benefits in 2002. The Commission estimates that parents are using at least 85.2% of the full-year (the entire 50 weeks) available to them. Before 2001, approximately 70 percent of mothers with benefits returned to work seven or eight months after giving birth. In 2001 and 2002, more than 70 percent of mothers with benefits had a leave of absence for at least 11 months.
13 See Lefebvre (2004) for a more elaborate analysis.
14 For some partial and tentative estimates, see Friendly et al. (2003) and Doherty et al. (2003). The OECD (2004) study on Canadian childcare deplores the state of patchy day care statistics in Canada.
unregulated day care in their own home or in someone else’s home by a relative or by a non-relative. Provincial and federal policies provide tax relief for childcare spending as long as receipts are presented to income tax authorities.
Table 5A shows the number of taxpayers who benefited in Québec from the refundable tax credit for childcare expenses (including expenses in summer day camp as well). Surprisingly, this amount increased from 192 million in 1996 to 213 million dollars in 2000 despite the fact that expenses for $5 day care are excluded as eligible childcare spending for the tax credit. This could be explained by mothers who are entering the job market and are anticipating a subsidized space in day care but use unsubsidized care temporarily. However, the global amount of tax credits for 2004 is expected by the government to be 170 million, lower than in 1996, as more and more parents use low-fee day care.
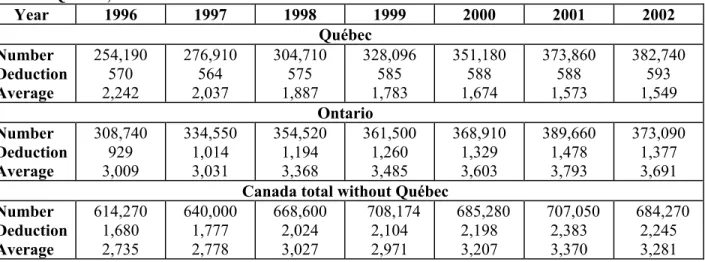
Table 5B presents the number of taxpayers benefiting from the federal tax deduction for childcare expenses from 1996 to 2002, the average amount of the deduction per taxpayer, as well as the aggregate amount of these deductions at the federal level for Québec, Ontario, and Canada without Québec. Table 5C shows the tax expenditure for the federal government due to these deductions. For the last few years, since 2000, approximately 1 million taxpayers deducted 2.8 billion dollars from their taxable income representing 600 million dollars in tax savings. Notice the remarkable progression in the number of Québec taxpayers using the federal deduction because it is available (the 5$ per day expenses) to users of Québec’s subsidized day care. From 1998 to 2002, 80,000 more taxpayers used this provision in comparison to 16,000 for the rest of Canada. However, the average deduction in Québec is approximately 50% less than in the rest of Canada, reflecting the significant decrease in the price of day care.15
Two annual Statistics Canada surveys offer information on spending for childcare. The Survey on Household Spending asks all families (presumably not just those who are working or studying) how much they spend annually on childcare. Table 6A presents spending for childcare in Québec and the other provinces as well as the number of households that report such spending. Québec households have reduced their spending in this area. The average amount of spending is 49% lower than in other provinces. The Survey of Labour and Income Dynamics (SLID), since 1999, reports spending on childcare by parents for the purpose of work or schooling. The statistics in Table 6B presents a different picture of the level and evolution of spending patterns, although the number of families with such expenditures is broadly similar in the two surveys. The figures of the SLID may be
15 The same provisions apply at the provincial level of taxation (except in Québec as explained before) which gives further tax reduction for childcare expenses.
more accurate because of the larger sample of families with young children. However, both surveys show that the amount of spending was on average much smaller in Québec, while the SLID indicates that the number of families with such expenditures increased significantly in comparison to the other provinces.
The Canadian National Longitudinal Survey of Children and Youth (NLSCY) is produced every two years since the year 1994-1995 and four cycles are now available for analysis, the last covering years 2000-2001. This survey asks parents if they use childcare services for the purpose of studying or work (the question is not asked to households where parents do not work nor attend schooling). Table 7 presents for Québec and the other provinces the principal care arrangement used by parents for children younger than 6 years and for the 4 cycles.16 From the third wave of the survey, it appears that a larger percentage of children in Québec are in day care than in other provinces. Family-based day care outside of the child’s own home is the most widely used mode of day care across Canada. Day care is growing rapidly in Québec relative to other provinces since 1998. Day care in the household by non-relatives is slightly higher outside of Québec. Centre-based care, including before- and after-school care increases strongly in Québec compared to the other provinces where this arrangement ranks third.17
Kindergarten as day care
Publicly provided kindergarten for five year old children implies an implicit subsidy for day care. Gelbach (2002) analyses the impact of such an in-kind subsidy to parents (which makes more expensive child care services unnecessary for that part of the day, which assists families who wish to work on a sample of single mothers with a youngest child of 5 years old taken from the 1980 census.18 He estimates that access to free publicly provided kindergarten increases the probability of
being employed by 5% on the date of the interview as well as increasing other labor supply measures. All provinces offer publicly provided free kindergarten for 5-year-old children in a school setting under the auspices of the Ministry of education.19 All programs are for a half-day (2 hours and
30 minutes) during the school year, except in Québec (which is for a full day, since the fall of 1997),
16 Unfortunately, the classification of arrangements has changed from cycles 1-2 to cycles 3-4. 17 Page: 8
Lack of inclusion of full-day kindergarten as a mode of care probably distorts the changes here. Most five year olds and eligible four year olds attend kindergarten and it is their main mode of care. If they are not in before and after school programs, they will be recorded as “no care arrangement used” in all likelihood, or perhaps care in own home by a relative (see the increase in this care by a relative shown in the table).
18 The study exploits the fact that the month-of-birth requirement for entry to kindergarten changes from one state to another.
New-Brunswick and Nova-Scotia. In most provinces parents are free to register their child in kindergarten, as it is not a legal requirement (a large majority of eligible children do attend kindergarten). In Ontario, most school boards offer a half-day of junior kindergarten for four-year old children. Again, most eligible children attend these kindergartens. Finally, several provinces, including Québec, offer a limited number of junior kindergarten spaces for handicapped and underprivileged children of age 4.20
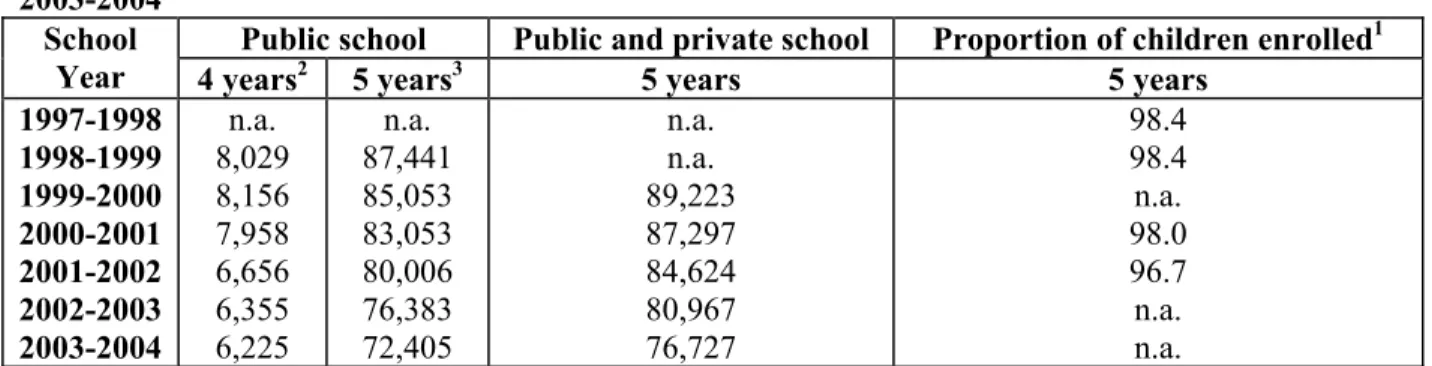
Table 8 shows the number of children of 4 or 5 attending kindergarten in Québec since 1998 For the 5 year olds, before September 1997, 88% of eligible children attended a public kindergarten. Since kindergarten has been available full-time, 98% attend kindergarten. In 1998, only 8,000 4 year old children attended kindergarten, with the number decreasing ever since. Also, since September of 1997, given the introduction of pre- and after-school $5 day care, the number of parents using these services has considerably increased.
Table 9 presents the number and proportion of children in different schooling levels, for Québec, Ontario, and other provinces, by cycle of the NLSCY, and by the age of the child.21 At the
age of 4, except for Ontario, the majority of children do not attend school. At the age of 5, for all provinces other than Québec, more than 80% of children are reported to attend kindergarten. In Québec, the proportion in kindergarten is smaller than for the other provinces (these figures differ from the administrative data shown in Table 8); however the proportion in either kindergarten or junior kindergarten is over 80%. Unfortunately, the data do not permit a distinction by part-time or full-time use. At six, all children are virtually in school, in the first or second grade.
Table 10 presents, by year, the number of 5-12 year old children in Québec benefiting from the $5 per day before- and after-school day care if they are enrolled on a regular-basis (at least two and a half hours per day for a minimum of three days per week). The growth has been spectacular since 1997. We cannot produce the same numbers for other provinces where such benefits are not available to parents.
We conclude that the only major change in kindergarten policy for 5 year old children from 1993 to 2002 occurred in Québec and that the preceding numbers justify the inclusion of 5 year old children in the empirical analysis of the effect of the change in the childcare policy of 1997.
20 The parents of these children are welfare recipients and engaged in a welfare-to-work or training program.
21 The age of a child determines the questions asked about him. Instead of using the real age of a child, the NLSCY constructs an “effective age” so that the child stays in the same age cohort that he was associated with, whenever the field survey is conducted, before or after his anniversary. For example, in cycle 4, the effective age is calculated in terms of year 2000: that is 2000 less the year the child was born; a child born in 1998 will be in the 2 years cohort even if the survey is realized in the winter of 2001. The actual age of a child at the interview may be different from the “effective age”. The survey is conducted in the autumn and in the winter, overlapping two civil years.
2. Analytical framework and econometric modeling
Conceptual issues
Before the introduction of the low-fee policy, the main policy instrument in Québec for childcare assistance was the refundable tax credit for child care expenses, more generous for low-income households,22 making the net price for families paying for childcare services (if they provided
receipts for childcare expenses in their tax return) contingent on family income. Therefore, as a result of the $5 per day policy, high income families experienced a larger reduction in net childcare prices than low-income families, all other things equal. Families with the lowest incomes that had used the refundable tax credit saw virtually no change in the net price of day care.
The simplest way to illustrate the incentive effects introduced by childcare subsidies is the model presented by Blau (2003). Suppose the mother is responsible for one child; day care services are of homogenous quality and cost p dollars per hour; there are no informal day care services; for each hour worked an hour of day care is required; there are no fixed costs to work, and w is the wage rate. The mother’s budget constraint is given by: c = I = y + (w-p)h, where c is consumption, I is income net of day care expenses, y is non-labor income and h are hours worked. The normalized time constraint is: h + l = 1, where l is leisure and utility is u(c, l). The hourly wage net of the hourly day care price (w-p) is the slope of the budget constraint in figure 1. The slope of this budget constraint is higher in absolute value when childcare services are free. The higher the childcare costs, then the higher will be the reservation wage and the probability of not working (h=0). A linear subsidy of s dollars per hour modifies the budget constraint such that: c = y + (w-p+s), increasing the net wage and the slope of the budget constraint (see Figure 1) and the probability of working. However, conditional on work the effect of the subsidy is ambiguous because of income and substitution effects.
In Québec, before September 1997, the subsidy for childcare expenses operated through a provincial refundable tax credit based on family income. The federal tax deduction for childcare expenses also lowered the price of childcare. In short, both levels of government subsidized and still subsidize day care with these policy instruments. However, this type of subsidy is non-linear. Figure 2 displays the non-linear budget constraint. The subsidy rate decreases from s1 to s2 at level of income
I1, corresponding to h1 hours worked and from s2 to s3 at I2. At I3, the subsidy is nil. This type of
subsidy is an incentive for women not participating to participate, however the effects conditional on work are more complicated but the effect on hours of work remains ambiguous.
22 This tax provision can be used by families whose children are not cared in the subsidized spaces. Moreover, the federal deduction for childcare expenses applies as well.
The $5 fee for day care can be considered as a fixed cost of work for a fixed number of hours of day care. Figure 3 adds to figure 2 a generic case with a fixed cost per day, f, for a maximum of h* of day care per day. Therefore, rather than decreasing the mother’s net salary, the new day care policy is implemented as a very low fixed cost f of going to work. Furthermore, her net wage (abstracting from income taxes) is not affected by day care use until she reaches h*, an amount consumed by very few parents. We can compare the case of an hourly subsidy, in a non-linear case with the fixed costs model as shown in figure 3. The ordinate becomes y-f, and the slope is w up until h*. The budget line crosses the budget constraint with an hourly subsidy at point h#. Because f is so small, it is expected
that the new subsidy will have a positive impact on participation. Since the refundable tax credit is still available, mothers have the choice to be in either regime. Again f is so small that only mothers with very little day care needs would choose to remain with the refundable tax credit. In fact, the point where a mother would be indifferent between both regimes would not be at h# but at a point
lower than h#. In most other cases, the impact of the new subsidy on hours worked will depend on
income and substitution effects.
Moreover, the price of day care for families who do benefit from a subsidized space that usually offers 11 to 12 hours of day care per day, 5 days per week is not only low but is also independent of the mother’s labor status, hours of labor supply and family income.23 For mothers
working full-time, taking into account work time, commuting time between the home, the day care facility and workplace (let us say 9 hours), the hourly cost of day care is less than $0.60 per hour.
As discussed earlier, the net price of day care varied with family income before the fixed-fee policy. In addition, several families did not receive the tax subsidies, as receipts were not supplied to tax authorities, the informal arrangement with their childcare provider being superior to an arrangement with receipts. Baril et al. (2000) estimated that in 1997 the net price of center-based regulated day care (with receipts provided and after federal and provincial personal taxation) before the $5 per day fee policy, ranged from $5/day for a very low-income family to $15/day for a high-income family. However, low-high-income families could be liquidity-constrained and have problems accessing reliable day care, so that the policy could have important effects on this group as well. Also, parents using free day care provided by a relative could prefer a subsidized space because of the long hours that are available in these settings. Finally, the $5 per day childcare providers could be
23 In the low-fee childcare centers (including the school-based ones), services are usually provided from 7h30 to 18h; in family-based childcare the operating hours must be for a maximum of 10 hours. These services must be offered for a maximum of 20 days per four weeks and no more than 261 days per year. Since most of the spaces must be occupied full-time, a family must pay for the 261 days ($1,305) on a yearly basis to maintain its access to a space, even if the child is absent from the childcare service (due to sickness or for family vacations).
seen as more reliable than a person at home as the service is available every day of the week, as well as being licensed and regulated.
Note that the impact of the policy could have appeared earlier on hours worked, weeks worked and earnings than on participation as the first to benefit from the program were mothers already using the registered and regulated day care services. However, the sign of the effect of the program on hours is ambiguous for these mothers.
Empirical model
Our econometric approach is based on a difference-in-differences (DD) procedure which is now well established in labor economics (Card, 1990; Angrist et Krueger, 1999; Meyer and Rosenbaum, 2001; Bertrand et al., 2004). We observe mothers with young children in Québec, where the policy is implemented, before and after the policy change. Our control group will be mothers with children of the same age in the rest of Canada, where no important reform occurred during the same time period. The year 1999 will be considered as the first year of the program even though it was originally implemented in late 1997. The first year would simply accommodate mothers who were already in the labor market and barely any new spaces were available before 1999. Our model will, however, introduce what could be called an anticipation effect.
Suppose Y1 is the value of the outcome of interest for an individual after the introduction of
the program, Y0 is the value before the program, and ∆ =Y1-Y0. The standard DD estimator is written
as:
DD ≡ E(∆|Q=1)={E(Y1 |Q=1)−E(Y0 |Q=1)}−{E(Y1|Q=0)−E(Y0 |Q=0)} (1). Where E is the mathematical expectation operator and Q=1 if the mother lives in Québec, and 0 otherwise. The identification conditions for this estimator are spelled out in Heckman, Lalonde and Smith (1999). More generally, it can be written, as:
DD ≡ [E(Ys-1+k | Q = 1) - E(Ys-1-k* | Q = 1] - [E(Ys-1+k | Q = 0) - E(Ys-1-k* | Q = 0] (1a).
Where s is the period of regime change while s-1+k and s-1-k* (with k>0 and k*≥0) represent respectively the periods after and before the regime change. The question is how to choose k and k* in a context where the policy is implemented over several years.
The same estimate can be obtained with a regression analysis using the following model:
it i i i it Q A AQ Y =
α
+θ
+γ
+β
+ε
(2).Where i represents mothers, Qi is a dummy variable taking the value of 1 if the mother lives in Québec and 0 otherwise, Ai takes the value of 1 if the period is after the policy change and 0 otherwise, AQi is an interaction term betweenAi et Qi, εit is an error term (with E(εit | Q, t=0)), and
α θ γ
β, , , are parameters to be estimated. The DD estimator is equivalent to the least squares estimator ofβ. We could not find any reason to believe this policy to be endogenous in the sense of being correlated with unobservable variables specific to Québec, leading to a spurious regression. In fact, the policy was totally unexpected when it was announced to the general population. A more important consideration is the possibility that differential pre-period trends could bias the results (Meyer 1995). If Québec mothers’ labor supply was increasing at a faster rate than in the rest of Canada before the program, the DD estimator will be biased upwards and we will attribute to the policy effects that are due to other factors.
To handle this issue, we turn to a more general specification presented by Francesconi and Van der Klaauw (2004).24 They make two major modifications to equation (1). First they introduce
specific pre-policy trends for the treatment and control group, in our case for Québec and the rest of Canada. The model can be written as:
Yit = α + θQi + (γ11 + γ12Qi)t + γ2I(t≥s) + βQiI(t≥s) + εit (3).
where t is a time trend, I(w) is an indicator function specifying whether the period is a post- or pre-policy period. In our case, post-pre-policy periods start in 1999 when a substantial number of new places are created. The parameter γ11 is the effect of the aggregate trend while γ12 is the effect of the specific
trend in Québec, γ2 is theaggregate post-policy effect, and β remains the policy effect. In a three
period model, they show conditions such that the OLS estimator of β in specification 3 is identical to a difference-in-differences-in-differences estimator (DDD):
DDD ≡ {[E(Ys-1+k l Q = 1) - E(Ys-1 l Q = 1] - [E(Ys-1 l Q = 1) - E(Ys-1-k* l Q = 1]} -
{[E(Ys-1+k l Q = 0) - E(Ys-1 l Q = 0] - [E(Ys-1 l Q = 0) - E(Ys-1-k* l Q = 0]} (4).
If the true model is given by specification (4), DD estimates (β + γ12(k+k*)). If γ12 is not equal to 0,
then the DD estimator is biased. Second, they also introduce a common change in trend after the policy is implemented. Therefore, the post-period trends remain specific to each region, but can change (not in a specific fashion) relative to their pre-policy values. Hence, a more general specification than (3) is given by:
Yit = α + θQi + (γ11 + γ12Qi)t + [γ21 + γ22(t-s)]I(t≥s) + βQiI(t≥s) + εit (5).
In addition to pre-policy specific trends, γ22 represents the effect of the post-policy aggregate
(common to both regions) change in the specific trends. Equation (5) admits both common aggregate intercept and trend changes for the periods after the policy change. If the true model is (5), DD
estimates β + γ12 (k + k*) + γ22 k-1, while DDD estimates β + γ12(k-k*) + γ22(k-1),25 and DDD
correctly estimates β only if k=1. The main identification condition for the estimation of the policy effect in this model is that, other than the introduction of the region specific childcare policy, there are no contemporaneous shocks that affect the relative outcomes of the treatment and control groups. Since the policy change was included within a more general reform in public policy our estimated effects could be corrupted by other aspects of the policy. However in previous work (Lefebvre and Merrigan, 2003) we show the other labor supply incentives incorporated in the policy were not very strong.
Specification (5) can be enriched in three ways. First, it is possible to add a number of controls to the regression analysis such as the age of the mother and her level of education as well as several other “exogenous” explanatory variables. Second, despite the fact that very young children were not covered in the first years of the program and that the first year of the program did not create new day care spaces and facilities, a specific effect for the year 1998 is added in the regression as an anticipation effect. Finally, the effect of the gradual increase in the number of places from 1999 to 2002 can be represented by a series of year-specific dummies from 1999 to 2002. These additions to (5) give: Yit = α + θQi + (γ11 + γ12Qi)t + [γ21 + γ22(t-s)]I(t≥s) +
∑
+Φ = 2002 1998 t it tQ β ′ X it + εit (6).Where
β
t represents a time-specific effect of the policy, Xit is a vector of socioeconomic controlvariables and Φ is a vector of parameters. Specification (6) is the final specification with Yit
representing different labor market outcomes.
3. Data set
The data used for our empirical analysis are provided by Statistics Canada Longitudinal Survey of Labour and Income Dynamics (SLID), a nationwide survey on household and personal income as well as labor force participation. The individuals for this survey are sampled though the Labour Force Survey (LFS) which covers all provinces with the exception of the three Territories, native reserves, the military and individuals residing in institutions. Conceived originally as a rotating panel survey, the first panel was produced in 1993. The same individuals were interviewed every year from 1993 to 1998. In 1996, a second panel was introduced covering the years 1996 to 2001. In 1999,
25 If the length of the time-periods is the same for the pre- and post-difference terms, then k=k* and differences in the time evolution of the outcome variable between treatment and control groups do not contribute to the bias.
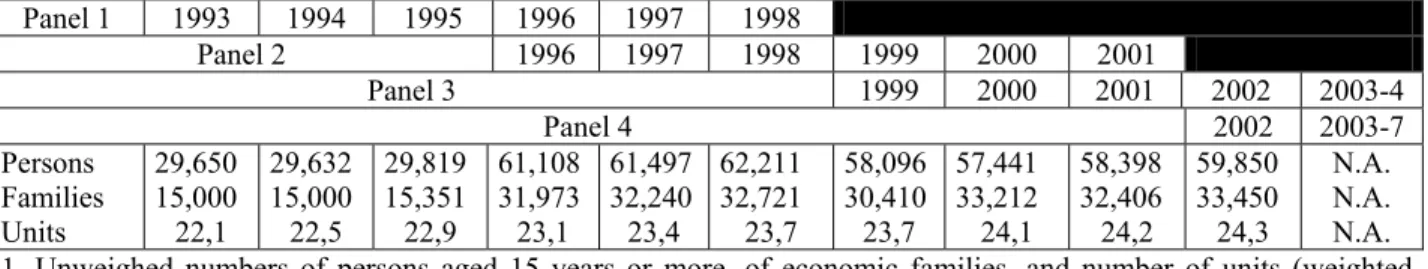
a third panel was started to replace the first cohorts of respondents. The last panel started in 2002. Since 1996, the SLID is composed of two cohorts representative of the total population of individuals aged 15 or more. Table A illustrates the structure of the panel as well as the total number of individuals and households in the survey and the population-weighted number of individuals.
Table A: Structure and size of samples1 in the Survey of Labour and Income Dynamics Panel 1 1993 1994 1995 1996 1997 1998 Panel 2 1996 1997 1998 1999 2000 2001 Panel 3 1999 2000 2001 2002 2003-4 Panel 4 2002 2003-7 Persons Families Units 29,650 15,000 22,1 29,632 15,000 22,5 29,819 15,351 22,9 61,108 31,973 23,1 61,497 32,240 23,4 62,211 32,721 23,7 58,096 30,410 23,7 57,441 33,212 24,1 58,398 32,406 24,2 59,850 33,450 24,3 N.A. N.A. N.A. 1. Unweighed numbers of persons aged 15 years or more, of economic families, and number of units (weighted number of persons aged 15 years or more) in million. N.A: not available.
First, from the years 1993 to 2002, we sampled mothers in single-mother or two-parent census families, with at least one child less than 18, who were aged between 18 and 56 years.26 Second, we
kept only mothers with a least one child aged 5 years or less for the regression analysis. Finally, we separated our sample by the level of education of the mothers: mothers with a high school education or less and mothers with more than high school education. Five labor market variables were chosen to analyze labor market behavior:27
1. Labor market participation for two of the 12 months of the year (the information is available for any of the twelve months): April and August (coded ml04v2 and ml08v2 respectively). 2. Employment during the year of reference: full-time (coded fl1prt1); this indicator applies to
individuals having worked during the year of reference. 3. Number of weeks worked during the year (coded wksem28). 4. Number of hours worked during the year (coded alhrwk28).
5. Earnings for the year of reference in all jobs (coded earng42), in real 1992 dollars. A descriptive analysis
Figures 4 to 6 contain graphs tracing the time series evolution of the five labor market variables for the years 1993 to 2002 for mothers in Québec and the rest of Canada. Figures 4(a) to 4(f) present the percentage of mothers working in the month of April and the month of August by the age of children present in the census household, marital status and level of education in Québec (Q) and the other provinces of Canada (C). Figures 4(a) and 4(c) for both months show the same pattern for mothers with at least one child who is 1 to 5, and mothers with at least a child from 0 to 5 years.
26 Only by using census families can a unique link be established between a mother or the spouse of a man and the children living in the family.
The graphs clearly show, except for the aberration in 1995, that from 1998, the participation rates for these groups in Québec increase rapidly relative to the rest of Canada, eventually being higher for 2001 and 2002. This increase is notable in 1999, the first year with a substantial increase in low-fee day care spaces.
Figures 4 (b) and (d) presents the same rates for mothers with at least a child from 0 to 5 years and, mothers with at least one child who is 6 to 11 years and no child less than 6 years. We observe that for the latter, the rate in Québec increases relatively to the rest of Canada in 1994, 4 years before the change in regime, and then grows at the same rate until 2002, when there is fall in the rate in the rest of Canada relative to Québec. Therefore, the pattern for the mothers with very young children is very different from mothers with older children and no young children. If the growth rate in Québec for mothers with a child that is 6 to 11 years had been much higher than in the rest of Canada for the post-1998 period, it would have been difficult to attribute the differences in the case of the mothers with very young children to the day care policy. Figures 4(e) and 4(f) concern only the month of April as the results for August are similar. Figure 4(e) repeats Figure 4(b) with the 0-5 age group for mothers living with a spouse and with at least one child less than 6 years. The figure shows the same pattern as with the full sample, participation rates being higher for mothers in a couple. The sample of single mothers was too small to perform the analysis. Finally, Figure 4(f) presents participation rates by education level. The effect of the policy is striking for the highly educated group. For the less educated, the gap that existed before 1998 seems to be receding.
Figures 5 present the same time series but for annual average weeks worked ((a) to (c)) and average hours worked ((d) to (e)). Figure 5(a) compares mothers with at least a child from 0 to 5 and, mothers with at least one child who is 6 to 11 years and no child less than 6. Again the same pattern emerges with very strong growth in Québec for mothers with very young children relative to the rest of Canada after 1998. The relative increase for the other mothers occurs in 1994 followed by similar growth in both regions. Figure 5(b) shows that the time series pattern for couples is similar to that of the full sample. Figure 5(c) compares the patterns by education level. The graph displays evidence of a positive effect of the policy for both groups. The patterns for hours, figures 5(d) to 5(f) not surprisingly, closely mimic the patterns for weeks.
Figures 6(a) to 6(d) present the time series for annual average earnings. Figure 6(a) shows that for both age groups in early childhood, there is a stagnation of mean earnings from 1999 in the rest of Canada while they are growing steadily in Québec. Figure 6(b) compares mothers with children under 5, with those who have none, but have at least one child 6 to 11 years. Again, we observe for the latter strong growth in Québec relative to the rest of Canada, from 1994 to 1996, after
which growth is similar, except for 2002 when there is an unexpected dip for the rest of Canada. It is possible that by then, some dynamic positive effects on labor supply of the program are affecting mothers with older children, as children who were under six at the beginning of the program are now older than six. Figure 6(c) shows how the program had impacts on both classes of education. Figures 6(d) to 6(f) trace the percentage of participants in the labor market working full-time. Again, the results point to a positive effect of the program.
4. Econometric results
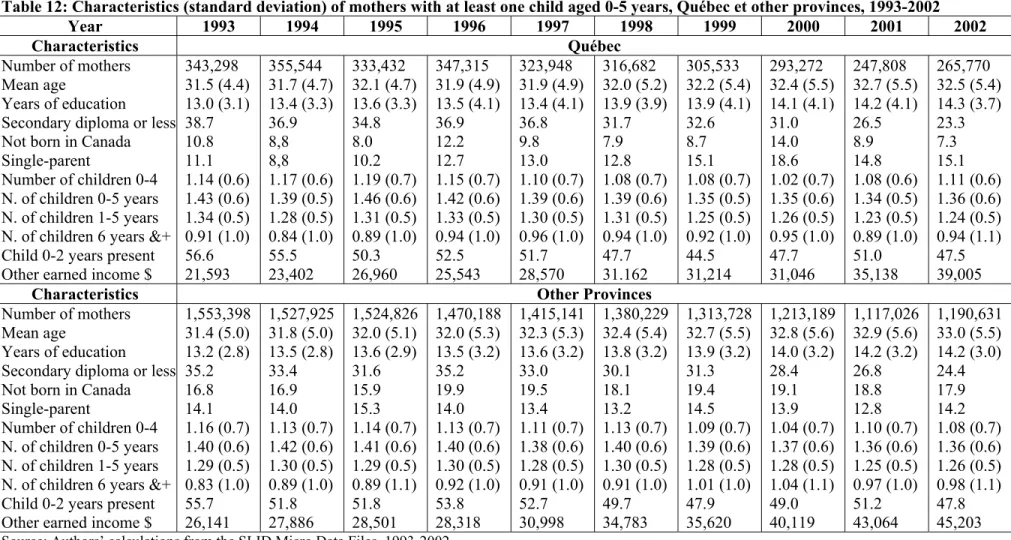
Table 12 shows the mean values by year of mothers’ characteristics for the main sample of mothers with at least one child younger than 6 years. Mothers are quite similar in both regions. We note the following differences: mothers in Québec are slightly less educated in the earlier years of the sample; compared to the other provinces, the prevalence of single-mother families in Québec is lower in the early years and higher in the later years; the proportion of mothers born outside Canada is smaller and family levels of earned income from sources other than the mother are lower in Québec than in the rest of Canada.
The econometric results are found in Tables 13 to 17. Three specifications were estimated for each of the samples, one with a dummy variable for the year 1998 and one without it. Samples were created on the basis of the children’s ages and the mother’s education. Because a large proportion of mothers stay at home in the first year of a child’s life and fewer subsidized day care spaces are available when the child is less than one, we also estimate models in families where there is at least one child aged 1 to 5. We also split the sample in mothers with a high school education or less and mothers with more than a high school education. The former would be in lower-income families and are more likely liquidity-constrained.
Each table corresponds to a particular dependent variable. Table 13 presents the results for participation in the months of April. Regressions were done with the month of August and the results were very similar. Tables 14 to 17 concern respectively annual hours worked, weeks worked, yearly earnings, and participation in full-time work. The Tables present only the parameters estimates relevant to the policy change. Complete results are available from the authors.
The control variables used in the estimations are: mother’s age, mother’s age squared, years of education, years of education squared, a dummy variable for mother being born in a foreign country, a dummy variable for single-mother households, the number of children greater than 5 years of age in the household, the number of children less than 6 years, a dummy variable for the presence of a child less than 3, and earned income from a source other than the mother. Three specifications
were estimated for each sample: (i) assumes a constant treatment effect for the years 1999 to 2002 (β1998=β2000=β2001=β2002) and no pre-program trends (α31=α32=0); (ii) assumes pre-program regional
specific trends but keeps constant yearly program effects; (iii) assumes pre-program regional specific trends as well as non constant program effects. The p-values presented below the coefficients for each specification are computed for the following nulls: (i) (α31=α32=0); (ii) (β1998=β2000=β2001=β2002).
Given that smaller provinces are over sampled, all the regressions were done with Statistics Canada’s sampling weights.
Participation
The results for participation are presented in Table 13. In general, the dummy variable for 1998 is never statistically significant, showing that the first year of the program mostly subsidized mothers already working. Second, we do not reject the model with no pre-program trends and do not reject the null of equal effects when pre-program trends are present. Samples without children aged less than 1 year produce slightly larger effects for the program. Program effects are estimated to be positive and statistically significant. The program effects are larger for mothers with a high school education or less. Finally, specification (iii) shows an increasing effect of the program that is consistent with the gradual increase in subsidized places. For all mothers, the effects, when constant, range between .0747 and .0917 and the largest effects are for the year 2001 and 2002 ranging between .11 and .13, which are very large considering the participation rate was around 0.57 in Québec in 1993. Therefore, there is evidence that the program had a strong and increasing impact on participation.
Hours worked
Results for annual hours worked are presented in Table 14. The program effect is systematically positive. The effect for 1998 is everywhere positive except for one case, but it is never statistically significant. The p-values for the null of no pre-policy trends are lower however and the same is true for the null of equality of effects. For specification (ii), no policy effects are statistically significant, and the estimated effects are smaller than for specification (i) but remain relatively large as the average number of hours worked before the program was around 980 hours. Effects in the first two specifications range between 138 and 148 hours when the sample is not split by education. Very large effects are found for mothers with a high school diploma or less with the sample of children from 1 to 5. This could be explained by the fact that higher educated women already work longer hours so that the income effect of the price change could be more important in their case. We observe the same pattern of increasing policy effects from 1999 to 2002, with coefficients for 2001 and 2002 being statistically significant and large (between 182 and 321 hours for the complete samples).
Weeks worked
Table 15 presents results for annual weeks worked. For all tests the p-values are low. Specification (ii) yields generally smaller effects than (i), but the coefficients are mostly significant. For (i) and (ii), when the sample is not split by education, effects range between 3.28 and 4.56, quite large effects as the mean number of weeks worked was 30 in 1993. The strongest effects are for less educated mothers. This is consistent with the results on annual hours worked. Once again, the strength of the effects increases with time, reaching up to 9.18 weeks (but with a large standard error) for uneducated mothers. For mothers with children from 1 to 5, the effect for 2002 is 6.09 and statistically significant. The general pattern of the results is consistent with participation and hours worked.
Earnings
For earnings, Table 16, the p-values show that the null of no pre-policy trends is rejected or close to being rejected in all cases in (i). The constant effect null is not rejected in (ii). Therefore, there is reason to prefer on these grounds specification (ii), where the effects on earnings are not statistically significant, despite being close in size to the effects in (i) (around $2,300 per year), which are significant. The larger standard errors could be the result of larger measurement errors in the case of earnings. Specification (iii) displays the same pattern of increasing effects seen for the previous dependent variables. The most difficult results to reconcile are the large labor supply effects for the less educated with the smallest effect for earnings. This can be explained by the much lower hourly wages for the less educated.
Full-time jobs
Table 17 presents results for full-time work and shows that the increase in participation concerns mainly full-time work.
5. Discussion and policy implications
Discussion
The results support the hypothesis that the low-fee day care policy implemented by the province of Québec at the end of 1997 has had substantial labor supply effects on the mothers of pre-school children in this province. The strong statistical evidence is provided with data that spans the years 1993 to 2002 and an econometric model that is general enough to dismiss competing hypotheses that could explain the large increase in labor supply particular to Québec after the start of the policy and that is more general than standard DD or DDD evaluations. The evidence shows that the policy had effects on both educated and less educated mothers despite the fact the decrease in
price was larger (considering Québec’s tax policy on childcare expenses before the program started) for higher income families. This can be explained by the fact that lower income families are liquidity-constrained and that the policy made childcare facilities more easily available. The results also provide some evidence, however more tenuous because the null of the equality of the effects cannot be rejected, that the effect on labor supply became stronger as more and more subsidized spaces were created across the province for different age groups.
It is also possible that the creation of low-fee spaces contributed in reducing the price of other forms of day care services by way of increased competition in the industry, amplifying the effects of the policy. Since we do not observe the same differences in the progress of labor supply variables between Quebec and the rest of Canada for mothers with children aged 6 to 11 with no child less than 6 years, we can be more certain that the estimated effects are due to the policy.
If all the new child care spaces created were provided to women who would have worked without the policy, then the policy would have no effect, but this is difficult to imagine, since 69,000 new $5 per day spaces were created over the years from 1999 to 2002. Finally, we could not identify any other distinctive tax-transfer policy in Quebec that could have explained the estimated effects found with the SLID.
Are the results consistent with the estimated effects of child care prices on labor supply found in the economic literature? Blau and Currie (2004) and Blau (2003) conclude, that the link between child care prices and labor supply is weak. In France, Chroné et al. (2004), with a sample of mothers with children less than 3 years also find a small effect of prices on labor supply. Cleveland, Gunderson and Hyatt (1996) and Powell (1997, 2002), using the 1988 Statistics Canada’s Survey on child care utilisation, find a substantial negative effect of child care prices on labor supply. For example, Cleveland, Gunderson and Hyatt (1996), who do not distinguish between full-time and part-time work, estimate that a 10% decrease in prices would increase employment of mothers with young children living in a couple by 3.9%. Powell (1997) computes an almost identical price elasticity of -0.38 for participation and -0.32 for hours worked. Powell (2002), in a multinomial model with three different modes of paid day care and participation in the labor market finds very high labor supply elaticities with respect to child care prices: -1.40 for day care centers, -3.60 for day care at home with a non-relative, and -0.80 for day care at home with a relative. A decline of 10% in day care center prices is estimated to result in a 5.2 percentage points decrease in participation. If the price of all modes of day care is increased by 10%, she finds a decrease of 5.6 percentage points of participation.
Michalopoulos and Robins (2000), who also use the same 1988 survey and a more complex methodology (multinomial estimation, full- and part-time participation, three types of paid child care,
and estimated tax subsidies for these six choices), find for mothers living in a couple a price elasticity of -0.203 when all types of labor force participation are considered. However, an increase of $1 per hour in price (given an initial price of $2.21 per hour) results in a 6 percentage points decrease in full time participation for an elasticity of -0.464, while the elasticity for part-time participation is -0.203. They compute the effects of a $1,000 subsidy on work and use of a day care center to be of 4 percentage points, an elasticity of 0.094. For the same subsidy, applied to all day care modes and all types of participation, they compute an elasticity of 0.118 and a 10 percentage points increase in participation.
Baril et al (2000), on the basis of an average price of $25 per day in registered center-based day care in the metropolitan area of Montréal for year 1997, estimated the net price of day care (after tax benefits), at $5 per day for the lowest income families, $10 per day for middle income families, and $15 per day for families paying the highest marginal tax rate. The minister responsible for the family policy (Théberge, 2003) estimates that before the low-fee policy, families paid on average $18 per day before tax credits. On the basis of this information we can summarize that prices fell on average by approximately 50 percent. We find the effect of the policy to be 7.6 percentage points for labor force participation. Since the participation rate in Québec for 2002 is 69%, we estimate that it would have been 61.4% without the policy. Hence, the policy increased participation by 12.3% for a price elasticity of 0.25, close to the results of Michalopoulos and Robins (2000). Using the same reasoning we find for annual hours worked, weeks worked and earnings, price elasticities respectively of 0.26, 0.28, and 0.34, all quite credible.
Policy implications
What are the implications for public policy concerning only labor supply? To answer this we must consider the costs of the program. Table 11 indicates that the average yearly subsidy to registered day care providers increased on average from $3,788 for 1996-1997 to $8,015 per year in 2003-2004. This average masks important differences across modes of day care. For year 2003, according to the Quebec’s Department of the Family (Théberge, 2003), without taking into account the age of children which affects the amount paid to providers, the public subsidy per day is $40 in a not-for-profit center, is $30 in a for-profit-center (under-agreement), is $22 in the family-based regulated setting, which on a yearly basis translates to respective amounts of $10,500, $7,900, and $5,800$.28 The Department of the Family estimates that before the policy the daily subsidy per child
28 The subsidy per day differs mainly according to the setting and the age group of the child, and the amount paid to a child care service is calculated per space, per day (on the basis of 261 days per year) and takes into account the cost of the premises, general expenses, optimization (all subsidized spaces must be occupied but children can be absent
was respectively $11 per day (not-for-profit centre), $1 per day (for-profit centre), and $4 per day (family-based).
The monetary allotments used to support this policy appear therefore to be relatively high if their only advantage is to increase labor supply. A large wedge has been created between what is actually paid for by the parents (since January 2004, $7 per day) and the actual cost of day care (closer to $40 per day). This pricing policy coupled with the necessity of utilizing these services five days per week creates strong distortions related to the optimal choice of day care services. The dynamics of the regime imposed by the government29 have basically negated other types of policy
interventions to support families with young children. For example, if families had a choice between a day care subsidy and a lump-sum amount of the same value (a policy pursued in Norway and Denmark for children aged less than 3 years), several families with children under three years of age would probably choose the lump sum.30 However, given that this would generate job losses in the
publicly funded system, unions could react strongly to such a policy and disrupt services. In other words, major policy changes surrounding child care policy become impossible to implement, and it becomes an irreversible policy. The $2 per day rise in 2004 was badly received by public opinion and the government decided that the fee would not increase in 2005.
15 percent of the time on an annual basis), childcare and educational expenses. For 2002-2003, a not-for-profit centre with 60 spaces (a typical organization), received around $60 per day for each child aged less than 18 months and $40 per day for a child aged 18 to 59 months. On an annual basis, the value of the subsidy thus ranges from $11,500 to $15,700, depending on the age of the child. The other types of childcare services receive lower subsidies: about $30-$45 per day per child in a for-profit centre and a little less than $23 per day per child in a family-based setting (one adult cannot care for more than 6 children including his child; of these children no more than two may be under the age of 18 months).
29 In parallel with the creation of new places, the wages provided to educators and all types of employees in childcare centres were steeply increased and regulated after negotiations with the main unions representing the employees. According to wage schedules published by the ministère de l'Emploi, de la Solidarité sociale et de la Famille, in 2004, educators with recognized training in childcare are paid between $13,86 and $18,36 an hour according to their experience (from one to ten years, defined as job-based in the education or social sectors). For educators with no specific training, more years of experience compensate for training. For a person in a management job in a centre, the wage schedule starts at $37,000 and goes up to $49,000 for 13 years of experience. The usual social benefits are attached to childcare jobs. The government has also agreed to pay a special 50 million $ contribution over four years toward a retirement fund. The increase in the number of spaces and the improvements brought to the working conditions of childcare providers explain the rapid increases in the public subsidy (from $209 million in 1995 to $1.3 billion for fiscal year 2003-04). Moreover, these numbers could well go up. Indeed, most of the employees in centres are unionized with either one of the two main federations representing workers in the education sector. Union leaders maintain that educators are underpaid and that their wages do not respect gender equity (since almost all educators are women). They also consider that family-based childcare providers affiliated and supervised by a not-for-profit centre (currently considered self-employed persons) should be considered employees of the centres. The current government has re-enacted and passed a labor-law initiated by the preceding government stating that family-based childcare providers are not employees but self-employed workers.
Taking into account the high level of labor force participation of Québec’s mothers with young children (69% in 2002), it is not clear that if the government would have maintain the actual fee for child care services (it was increased to $7/day in 2004 and remains at that level in 2005) it would have driven more mothers to work. The creation of more low-fee spaces (the objective is 25,000 more by the end of year 2006) raises the question of the “efficiency” of the policy to induce more mothers to join the labor force and work full-time who otherwise would choose other modes of work (e.g. part-time) and child care for their young children.
Table B presents the distribution of gross daily prices31 (before tax credits and tax deductions)
for childcare in 1998 and 2000-2001. Of course, the dominant category is the $5 per day services is. However, a rather large proportion of families (36%) pay more than $5/day either because they cannot find a space (in the subsidized network) or by choice, and 8% use “free” day care (by relatives or subsidized childcare with a fee waiver). In both cases, government subsidies are much larger for parents using the $5 per day services generating some inequities across families. Furthermore, families with young children who choose to care for their children themselves or do not use non-parental child care, even though they are employed part-time or full-time (parents who coordinate their shifts to provide exclusively parental care), are not treated equally in terms of public family support. The value of the subsidies attached to in-kind child care is not matched by the other forms of family support for families caring for and educating their children or using other types of childcare, such as part time or full-time home-based care. Even though there is a generous provincial refundable tax credit based on family income for childcare expenses, it is not sufficient to match the in-kind subsidies offered to families using the $5/$7 per day child care services.
Table B: Gross price per day per child for childcare services paid by families with children aged 0 to 4 years in day care, Québec, 1998 and 2000-2001
Prices in 1998 Survey Prices in 2000-01 Survey <$5 <$5 $5 $5 $6-14 $6-14 $15-20 $15-25 >$20 >$25 $0 $0 August-September 1998 1.5% 11.5% 31.3% 25.4% 21.3% 9.7% December-February 2000-01 <1.0% 56.0% 15.0% 18.0% 3.0% 8.0%
Source: Survey on childcare services, 1998 and 2000 (Tables 3.1.11 and B.13), Institut de la statistique du Québec (1998, 2001). For 1998, among the 4,345 respondent families with children aged 0-4 years, 3,799 indicate the price they paid for childcare services. For 2000-2001, among the 6,783 respondent families, 71% (4,810) were using day care (for at least one child age 0-4 years) regularly to work or study.
There is also a “one size fits all issue”. The Québec model of childcare services implemented during the last seven years is “one-dimensional,” in the sense that it serves well the needs of parents
31 The use of gross prices overstates the inequity between the two groups of families (the $5 per day group and the one who receives tax subsidies).