EARLY ONLINE RELEASE
Posted September 15, 2018
CITATION
Desiage, P.-A., J.-C. Montero-Serrano, G. St-Onge, A.C. Crespi-Abril, E. Giarratano, M.N. Gil, and M.J. Haller. 2018. Quantifying sources and transport pathways of surface sediments in the Gulf of San Jorge, central Patagonia (Argentina). Oceanography 31(4), https://doi.org/10.5670/ oceanog.2018.401.
DOI
https://doi.org/10.5670/oceanog.2018.401 PERMISSIONS
Oceanography (ISSN 1042-8275) is published by The Oceanography Society, 1 Research Court, Suite 450, Rockville, MD 20850 USA. ©2018 The Oceanography Society, Inc. Permission is granted for individuals to read, download, copy, distribute, print, search, and link to the full texts of Oceanography articles. Figures, tables, and short quotes from the magazine may be republished in scientific books and journals, on websites, and in PhD dissertations at no charge, but the materi-als must be cited appropriately (e.g., authors, Oceanography, volume number, issue number, page number[s], figure number[s], and DOI for the article).
Republication, systemic reproduction, or collective redistribution of any material in
Oceanography is permitted only with the approval of The Oceanography Society. Please contact Jennifer Ramarui at info@tos.org.
Permission is granted to authors to post their final pdfs, provided by Oceanography, on their personal or institutional websites, to deposit those files in their institutional archives, and to share the pdfs on open-access research sharing sites such as ResearchGate and Academia.edu.
O
ceanography
THE OFFICIAL MAGAZINE OF THE OCEANOGRAPHY SOCIETYSPECIAL ISSUE ON THE GULF OF SAN JORGE
QUANTIFYING SOURCES
AND TRANSPORT PATHWAYS OF
SURFACE SEDIMENTS IN
THE GULF OF SAN JORGE
,
CENTRAL PATAGONIA (ARGENTINA)
By Pierre-Arnaud Desiage, Jean-Carlos Montero-Serrano, Guillaume St-Onge, Augusto César Crespi-Abril, Erica Giarratano, Mónica Noemí Gil, and Miguel J. HallerDust plumes blown out from Patagonia reaching the Gulf of San Jorge and the Argentinean continen-tal shelf. MODIS Aqua satellite image (Bands 7-2-1; acquired on November 3, 2016) generated from the NASA Worldview application.
Oceanography
| December 2018 | https://doi.org/10.5670/oceanog.2018.401INTRODUCTION
Key oceanographic processes, such as bio-geochemical cycles, primary production, and sediment transfer to deeper waters, occur on continental shelves, which lie between terrestrial/coastal and oceanic domains. Because they are partially land-locked and partially open to the ocean, gulfs provide suitable small-scale analogs for the mechanisms occurring on the con-tinental shelf. Furthermore, large coastal embayments such as gulfs are often sen-sitive marine environments affected by human activities (e.g., fisheries and/or urban development). Located in the cen-tral part of the Argentine continental shelf (ACS), the Gulf of San Jorge (here-after referred to as GSJ; Figure 1) provides a perfect example of both economical- industrial development and environmen-tal preservation. Indeed, numerous for-aging and reproduction areas for marine birds and mammals coexist in the GSJ with commercial shrimp and hake fish-eries, as well as terrestrial oil production. In this strategic environmental and oceanographic context, numerous stud-ies focusing on the grain size and miner-alogical and geochemical composition of the detrital sediments over gulfs and con-tinental shelves have been performed to determine their sources and depositional conditions and to identify their transport
pathways as well as regional hydro-dynamic patterns (e.g., Preda and Cox, 2005; Spagnoli et al., 2008; Saukel et al., 2010). A growing number of studies also work with bulk mineralogy, clay mineral-ogy, and elemental geochemistry to char-acterize modern sedimentary processes and to determine the provenance of ter-rigenous sediments (e.g., Andrews and Vogt, 2014; Gamboa et al., 2017).
On the Argentinean continental shelf and margin, the physical and chemical properties of surface and subsurface sed-iments have been characterized via bulk and clay mineralogy and elemental and isotopic geochemistry (e.g., Petschick et al., 1996; de Mahiques et al., 2008). All these results contributed to investigations of the composition and provenance of ter-rigenous inputs. Additionally, the chem-ical signatures of rivers, aeolian dust, and topsoil samples have been analyzed to estimate the potential riverborne and windborne inputs to the Patagonian litto-ral (Gaiero et al., 2004, 2007). However, most of the coastal studies, as well as the sampling campaigns, have been con-ducted in the northern region of the ACS and especially in the Río de La Plata estu-ary at ~35°S (e.g., Nagai et al., 2014). This focus leads to a disproportionate amount of information available for the north compared to the other coastal and inner
shelf areas of Argentina.
In this study, we present the first multi-proxy analysis based on grain-size distri-bution, bulk and clay mineralogy, and elemental geochemistry (major and trace elements) of surface sediments from the GSJ. The main objectives of this study were to (1) characterize the spatial dis-tribution of the surface sediments, and (2) define the different sources and trans-port processes of detrital sediment in the GSJ. Samples from potential sources areas (such as beaches, tablelands, dry-bed lakes, river mouths, and oceanic environ-ments) were also analyzed to document the relative differences between the sedi-ment composition in the potential source areas and sediment samples from the GSJ.
STUDY AREA Physical Setting
The Patagonian continental shelf rep-resents the southern part of the ACS and is delimited by the Patagonian coast from Cape Horn (55°S) nearly to the Colorado River (39°S). The hydrodynam-ics of the region consists of a northward (NNE) flow of sub-Antarctic cold water (i.e., Patagonian Current; Figure 1a) con-veyed onto the shelf through the Cape Horn Current and the Malvinas Current along the continental slope (Palma et al., 2008, and references therein).
The Atlantic coast of Patagonia is therefore characterized by a dry climate (from 200 mm yr–1 to 400 mm yr–1
rain-fall; Coronato et al., 2008). The strongest winds are concentrated between 49°S and 53°S in the heart of the southern westerly winds belt (Kilian and Lamy, 2012). The surface hydrology consists of eight main watercourses, mostly perennial, drain-ing toward the east from Andean head-waters to the Atlantic. Except for the Negro River in the north and the Santa Cruz River in the south, the other major watercourses have relatively limited dis-charge (Figure 1a; Kokot, 2004).
The GSJ is a semicircular basin, approx-imately 160 km long and 250 km wide, located in the central part of Patagonia between 45°S (Cape Dos Bahías) and
ABSTRACT. The Gulf of San Jorge (GSJ) is a semicircular basin, approximately 160 km
long and 250 km wide, located in the central part of Patagonia between 45°S and 47°S, lacking any present-day major perennial tributaries. The grain size and bulk and clay mineralogical compositions as well as major and minor elements of 75 surface sed-iment samples from the GSJ and the adjacent continental shelf were investigated to define the spatial distribution, transport pathways, and potential sources of terrige-nous material. To better constrain the origins of GSJ sediments, analyses were also performed on 14 terrestrial, riverine, and marine samples from potential source areas around the gulf and Patagonia. The mineral assemblage of surface sediments in the gulf, dominated by plagioclase, quartz, and clays, is a function of the primary continen-tal volcanic geology of Patagonia. The significant concentration of volcaniclastic parti-cles indicated by mineralogical signatures and scanning electron microscope images of sediments suggests a substantial contribution from rhyolitic volcanism to the modern sedimentation in the gulf. High amounts of smectite are carried into the GSJ by dust transport, whereas inputs of chlorite and illite seem to be associated with continental shelf current transport from southern Patagonia. Finally, our results suggest that 50% of the surface sediment in the GSJ is derived from external/oceanic inputs, 40% from inner gulf shores (i.e., erosion and runoff), and 10% from dust (i.e., aeolian transport).
47°S (Cape Tres Puntas; Figure 1b,e), an encroachment of the South Atlantic Ocean in the heart of southern South America. The bathymetry of the basin rapidly decreases to reach the 90 m iso-bath, which defines a large flat cen-tral region that covers most of the sur-face of the gulf and corresponds to the Patagonian outer shelf (Violante et al., 2014). The hydrodynamic and water mass origins in the gulf are related to the north-ward circulation on the shelf (Figure 1a; Palma et al., 2008), but the GSJ is also located at the limit of the influence of the Magellan Strait discharge flowing along the coast and entering the gulf in the southeastern sector at Cape Tres Puntas (Fernández et al., 2005).
From geological and geographical points of view, most of the GSJ forms the eastern part of the hydrocarbon- producing San Jorge Gulf Basin that is surrounded by the North Patagonian Massif to the north, the Deseado Massif
to the south, and the Andes to the west (Sylwan, 2001). The presence of these two massifs is expressed in the GSJ area by Jurassic silicic volcanic rock outcrops, predominantly rhyolitic, from the Chon Aike province (Figure 1a; Pankhurst et al., 1998). The main outcrop of silicic rocks, dominated by rhyolites and ignimbrites, is located in the northeast-ern part of the gulf close to Cape Dos Bahías and covers the entire sector of the Patagonia Austral Marine Park (hereafter referred to as marine park; Figure 1a,b; Pankhurst et al., 1998). The tablelands of the San Jorge Gulf Basin are mainly over-lain by Eocene-Miocene sedimentary rocks of the Sarmiento and Patagonia Formations (Cuitiño et al., 2015), as well as Quaternary fluvio-glacial deposits (e.g., “Rodados Patagónicos”; Martínez and Kutschker, 2011). The tablelands reach the coast as cliffs or beach-ridge systems, and are generally composed of gravel and/or sand (Isla et al., 2002).
Sedimentation
The main suppliers of terrigenous mate-rials to the Patagonian littoral are coastal erosion, rivers, and aeolian transport, as well as transportation and redistribution of sediments from the shelf by the pre-vailing northward-flowing Patagonian Current. Indeed, according to Pierce and Siegel (1979) and Gaiero et al. (2003), the estimated contributions of coastal ero-sion, dust transport, and rivers to the ter-rigenous sedimentary supply transferred offshore are, respectively, 56%, 41%, and 3% (Violante et al., 2014). The weak pro-portion of sedimentary inputs to the con-tinental shelf by the Patagonian rivers is explained by their present low flows and the low particulate loads in their downstream sectors (Gaiero et al., 2003; Kokot, 2004). The large aeolian contri-bution results from a combination of strong westerly winds over the regional geomorphology and the arid climate, which stimulates the resuspension and
! ! !! ! ! ! ! ! ! ! ! !! ! ! ! ! 0 1 2 Kilometers
¹
! ! ! ! ! ! ! ! ! ! ! ! ! ! ! ! ! ! ! ! 0 1 2 Kilometers¹
! ! ! ! ! ! ! ! ! ! ! ! ! ! ! ! ! ! ! ! ! ! ! ! ! ! ! ! ! ! ! ! ! ! ! ! ! ! ! ! ! ! ! ! ! ! ! ! ! ! ! ! ! ! ! ! ! ! ! ! ! ! ! ! ! ! ! ! ! ! ! ! ! ! ! ! ! ! ! ! ! ! !!! ! # # # # # # # # 66°W 67°W 45°S 46°S 47°S 0 25 50 Kilometers¹
Río Chico Río Deseados
Patagonia Austral Marine Park # # # ## 64° W 68° W 72° W 38° S 42° S 46° S 50° S 54° S¹
# # ## 60°W 62°W 64°W 66°W 68°W 45°S 46°S 47°S 0 50 100 Kilometers¹
P1 P2 < Comodoro Rivadavia 40 m 60 m 20 m 40 m 20 m Bathymetry 0 m 20 m 40 m 60 m 80 m 100 m 120 mb
c
d
(P2) ! ! 200 m 1000 m R. Santa Cruz R. Gallegos BV05s
s
s
s
s
s
s
s
s
s
BV04 BC01 BV06 G4 BV09 G1 BV03 BV02 G9 G10 G12 G13 BV01 SF15 G15 G14 G16 BV42 BV43 BV48 BV49 BV39 G5 BC07 BV10 BC06 BC04 BV08 BV07 G7 G6 BV35 BV34 BV36 BV37 BV38 BC11 BV40 BV41 BV44 BV47 BV50 BV45 BV46 GC07 06PC BC08 BC10 BC09 BV26 BV25 BV23 BV22 BV33 BV28 BV27 BV26 BV29 BV32 BV30 BV31 R. Chico BV17 BV16 BV14 BV15 BV13 BV12 BV11 BV19 BV18 BV20 BV21 SoM 05PDN 14RCHU 07NS1 08NS2 BV51 BV52 BV54 BV55 13CDB 12PM 11MED 10BB 09PV 01CSCB 02RL 04RCB < Comodoro Rivadavia R. Deseado R. Negro R. Chubut Gulf of San Jorge North Patagonian Massif Deseado Massif Bajo de Sarmiento Magellan Strait Jurassic rhyolites Patagonian Batholith Cenozoic volcanism Sedimentary rocksa
(P1)e
Fig. 1b Cape Tres Puntas Cape Dos Bahías R. Colorado Patagonian CurrentFIGURE 1. Maps of the study
area with sample locations. The dots indicate surface sediment samples in the Gulf of San Jorge (GSJ), the diamonds denote sites with surface sediment samples as well as water column fil-ters, and the triangles illus-trate samples from poten-tial source areas. (a) Map of Patagonia showing the main hydrodynamic circula-tion on the Patagonian con-tinental shelf (gray arrows; Palma et al., 2008), sim-plified surface geology, and main geographic fea-tures mentioned in the text. (b–d) Bathymetric maps of the Gulf of San Jorge and marine park areas. (e) Bathymetric map of the GSJ with adjacent continental margin.
Oceanography
| December 2018 | https://doi.org/10.5670/oceanog.2018.401 transport of surficial terrestrial sedimentsfrom Patagonian tablelands to the shelf (Crespi-Abril et al., 2018).
The GSJ does not have any present-day major and perennial tributaries likely to strongly affect the sedimentation. Furthermore, the gulf is located in the heart of several hundred kilometers of lit-toral without major rivers, except for the relatively low flow of the Deseado River (5 m3 s–1; Kokot, 2004), which reaches
the ocean a few dozen kilometers south of the GSJ (Figure 1a). However, there are aeolian inputs to the Gulf area (Isla et al., 2002; Crespi-Abril et al., 2016), as the basin is located on the outskirts of major dust sources (Prospero et al., 2002).
MATERIAL AND METHODS
Seventy-five marine surface samples were collected in the GSJ, as well as on the con-tinental shelf. The sampling was per-formed using a Van Veen grab sampler (65 samples), a box corer (8 samples), a gravity corer (1 sample), and a piston corer (1 sample) wherein the uppermost 1 cm of sediment was recovered to col-lect only the sediment-water interface (Figures 1b–e). These core-top sedi-ments were found to represent modern
time or at least the last decade/century when the topmost centimeters were miss-ing. All marine samples were recovered on board R/V Coriolis II from January 29 to March 4, 2014 (Leg 1: MARES and Leg 2: MARGES), as part of the PROMESSe (PROgrama Multidisciplinario para el Estudio del ecosistema y la geología marina del golfo San Jorge y las costas de las provincias de Chubut y Santa Cruz) project. Bulk and clay mineralogy and elemental geochemistry were analyzed for all samples, whereas grain size analy-sis was performed on only 57 samples due to the low quantity of sediments avail-able for the Leg 1 stations. The 63–300 µm and <63 µm sediment fractions of three selected samples (BV01, BV06, and BC11) were also examined using a scanning elec-tron microscope (SEM) to determine the abundance and the geochemical charac-ter of volcaniclastic particles (e.g., glass shards) in the marine sediments. In addi-tion, 13 terrestrial and riverine samples as well as a marine surface sediment sam-ple (0–2 cm sediment depth) from the Magellan Strait were analyzed for their mineralogical and elemental geochemis-try signatures (see details in the support-ing information; Figure 1a,b).
To document the chemical compo-sition and geochemical classification of suspended sediments in the water col-umn, 22 seawater samples from 11 sta-tions were recovered in the GSJ during the MARES cruise (Figure 1b). For each station, seawater samples were collected using Niskin bottles fixed on a CTD rosette both at the sea surface (2 m depth) and close to the seafloor. Between 0.5 L and 1.5 L of seawater, depending on par-ticle load, was filtered onto glass-fiber GF/F filters. The filters were stored frozen at −20°C until they could be analyzed.
The source samples and detailed meth-odology used for the analyses of grain size, SEM, bulk and clay mineralogy, and elemental geochemistry, as well as the statistical approach are presented in the online supplementary material.
RESULTS
Grain-Size Distribution
In the GSJ, the analyzed sediments are mostly fine to very fine silts, as well as very fine sands with a mean grain size (Φ scale) ranging from 8.01 (very fine silt) to 3.73 (very fine sand; Figure 2b, Figure S1a, and Table S1). Coarser sed-iments are dominant for the northern
! ! ! ! !!! ! ! ! ! ! ! ! ! ! ! ! ! !!!!!!!!!! !!!! ! ! ! ! ! ! ! ! !! ! ! ! ! ! ! ! ! ! ! ! ! !! 65°30'W 66°0'W 66°30'W 67°0'W 67°30'W 45°0'S 45°30'S 46°0'S 46°30'S 47°0'S 0 25 50 Kilometers ! ! ! !! !! ! ! ! ! 0 1 2 Kilometers !! ! ! ! !!! ! ! ! ! ! ! !!! ! 0 1 2 Kilometers P1 P2 Comodoro Rivadavia 40 m 60 m 20 m 40 m 20 m Log [EM 7.34/ (EM 5.59 + EM 3.04)] - 3.00 2.70 fractionFiner R. Chico Bathymetry Coarser fraction - 0.15 0 m 20 m 40 m 60 m 80 m 100 m 120 m c (P1) d e(P2)
a
b
2 4 6 8 10 12 1 2 3 4 5 6 7 0 5 10 0.5 0.6 0.7 0.8 0.9 1.0 ● Class (ɸ) Number of factors (q) Relative amount Explained variance (r 2) 250 62 Class (µm)16 4 1 0.2 EM 1 (3.04 ɸ/121.8 µm) EM 2 (5.59 ɸ/20.7 µm) EM 3 (7.34 ɸ/6.16 µm) 15 GSJ samples FIGURE 2. End-membermodeling analysis (EMMA) performed on the detri-tal fraction of the grain-size distribution in the GSJ. (a) The grain-size distribu-tion of the first three end members accounts for more than 91% of the vari-ance. (b) Three representa-tive unmixed grain-size dis-tributions produced from EMMA based on the grain-size distributions of the GSJ samples (gray lines). (c–e) Log[EM3/(EM2+EM1)] end-member ratios in the GSJ and marine park areas, respectively. ! ! ! ! !!! ! ! ! ! ! ! ! ! ! ! ! ! !!!!!!!!!! !!! ! ! !! ! ! ! ! ! !! ! ! ! ! ! ! ! ! ! ! ! ! !! 65°30'W 66°0'W 66°30'W 67°0'W 67°30'W 45°0'S 45°30'S 46°0'S 46°30'S 47°0'S 0 25 50 Kilometers ! ! ! !! !! ! ! ! ! 0 1 2 Kilometers !! ! ! ! !!! ! ! ! ! ! ! !!! ! 0 1 2 Kilometers P1 P2 Comodoro Rivadavia 40 m 60 m 20 m 40 m 20 m Log [EM 7.34/ (EM 5.59 + EM 3.04)] - 3.00 2.70 fractionFiner R. Chico Bathymetry Coarser fraction - 0.15 0 m 20 m 40 m 60 m 80 m 100 m 120 m c (P1) d e(P2)
a
b
2 4 6 8 10 12 1 2 3 4 5 6 7 0 5 10 0.5 0.6 0.7 0.8 0.9 1.0 ● Class (ɸ) Number of factors (q) Relative amount Explained variance (r 2) 250 62 Class (µm)16 4 1 0.2 EM 1 (3.04 ɸ/121.8 µm) EM 2 (5.59 ɸ/20.7 µm) EM 3 (7.34 ɸ/6.16 µm) 15 GSJ samplescoastal sample patches (marine park area; Figure S1b,c), especially close to the Cape Dos Bahías area (P2; Figure S1c). Fine silts prevail in the north-central area of the GSJ, with a finer fraction in the inner part of the gulf (Figure S1a). The mean sediment grain size measured in the GSJ for this study coincides with results obtained by Fernández et al. (2003). Furthermore, end-member modeling analysis (EMMA) provides a model with three end members (EM) that explain 91% of the variance in the grain size data set (Figure 2a). Based on the grain size distributions of the three end mem-bers (Figure 2b), EM1 represents a well-sorted distribution associated with the very fine sand fraction (mean ~3.04 Φ), EM2 shows a well-sorted distribution associated with the coarse and medium silt fractions (mean ~5.29 Φ), and EM3 represents a well-sorted distribution with main peaks corresponding to the finer grain fractions (i.e., fine silt to clay; mean ~7.34 Φ). EM1 and EM2 charac-terize all the samples from the park area
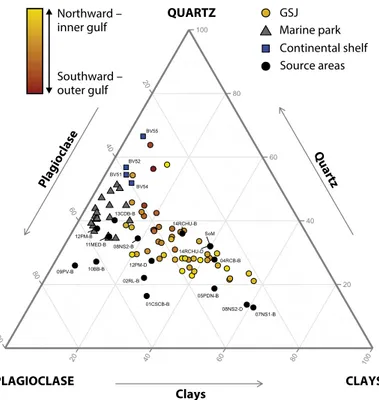
FIGURE 3. Quartz-plagioclase-clays ternary plot illustrating the relative
compositions of the main minerals. The samples are illustrated accord-ing to their locations in the Gulf of San Jorge; the northward-inner gulf to southward-outer gulf tendency is calculated from absolute latitude and lon-gitude coordinates (excluding the park sites).
20 40 60 80 100 20 40 60 80 10 0 20 40 60 80 100 01CSCB-B 02RL-B 04RCB-B 05PDN-B 07NS1-B 08NS2-B 08NS2-D 09PV-B 10BB-B 11MED-B 12PM-B 12PM-D 13CDB-B 14RCHU-B 14RCHU-D SoM CLAYS PLAGIOCLASE QUARTZ Plagioclase Quart z Northward – inner gulf Southward – outer gulf Clays BV55 BV52 BV51 BV54 Marine park Continental shelf Source areas GSJ
(P1 and P2), as well as the three sam-ples from the southern part of the gulf, and EM3 represents most of the samples from the north-central area (Table S1). Maps of the log[EM3/(EM2+EM1)] end- member ratios are used to illustrate the spatial variations of the relative pro-portion between very fine silt and coarse silt to identify the mechanism of transport/sources of particles in the GSJ (Figure 2c–e).
Bulk Mineralogy
The most abundant minerals in the GSJ bulk sediments, identified accord-ing to the quantitative X-ray diffrac-tion (qXRD) method developed by Eberl (2003), are quartz (14%–51%), plagioclase (15%–49%), clays (2%–41%), amorphous silica (4.5%–35.5%), and K-feldspar (2%–12%). The bulk miner-alogical compositions of sediments also indicate smaller proportions of pyrox-ene (<2.7%), amphibole (<1.5%), and Fe-oxides (<0.9%; Table S2). Amorphous silica can mostly be identified as volcanic
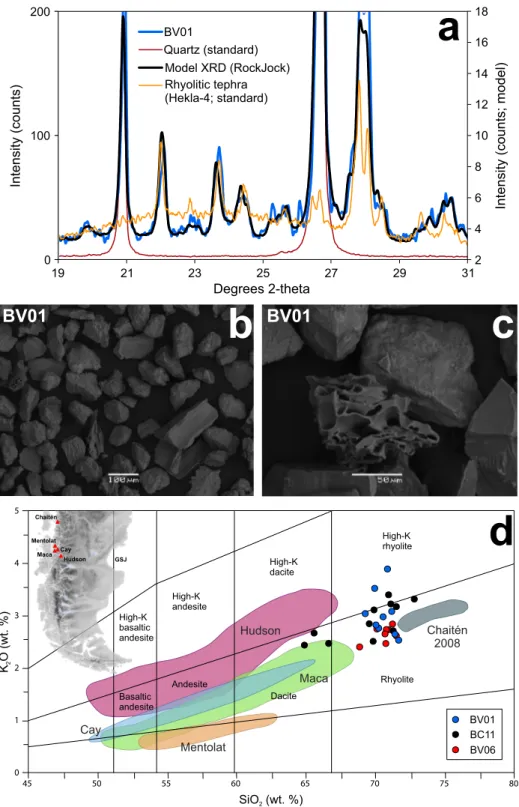
rhyolitic tephra based on the Icelandic tephra sample (Hekla-4), which is used as a mineral standard in RockJock v11 (Andrews et al., 2013). Indeed, in the XRD scans centered between 19° and 31° two-theta, the samples containing higher proportions of amorphous silica (>10%; e.g., BV01; Figure S3a) present patterns similar to the standard of rhyolitic tephra (Hekla-4). Furthermore, SEM imaging of the sediments in the 63–300 µm frac-tion from the BV01, BV06, and BC11 sites attests to the appreciable amounts of volcaniclastic particles, which are mainly represented by highly vesicular glass shards and slightly vesicular glass shards with blocky to curviplanar shapes (Figure S3b,c). SEM images also show the near absence of diatom frustules, consid-ered to be the other potential source of amorphous silica. The geochemical data in K2O-SiO2 of glass shards in the surface
sediments confirm the rhyolitic composi-tion of volcaniclastic particles in surface sediments (Figure S3d). The bulk min-eralogy is presented in a ternary diagram showing the three most abundant miner-als (quartz, plagioclase, and clays) in the GSJ samples (Figure 3). The ternary dia-gram also includes results from bulk min-eralogy analyses of marine and terrestrial sediments from the Patagonian continen-tal shelf, Strait of Magellan, and San Jorge Gulf Basin, all representing potential source areas of sedimentary inputs to the GSJ (Figure 3). The ternary diagram reveals that the clay content differs signifi-cantly between sediments from marine park areas and those from most of the other parts of the gulf. Indeed, the sites in the marine park areas are characterized by lower concentrations of clays (2%–10.5%) with homogeneous values of quartz and plagioclase (26%–42% and 34%–49%, respectively) in contrast to the clay con-tents in the other parts of the GSJ, which are higher (6%–41%), with scattered val-ues of quartz and plagioclase (14.5%–51% and 16.5%–37%, respectively).
To visualize the main tendencies of mineralogical enrichment in the gulf, spatial distributions of mineralogical
Oceanography
| December 2018 | https://doi.org/10.5670/oceanog.2018.401 balances for major mineral groups(i.e., b{(Quartz+Feldspars)/Clays}) were
con-ducted (Figure 4a; see statistical details in the online supporting information). The results indicate higher values associated with quartz and feldspar enrichments versus clay enrichment for the marine park areas. The lower values are related to most of the other parts of the GSJ, with the exception of intermediate values for sam-ples located in the northern and southern outer parts of the Gulf (Figure 4a).
To confirm the five-source compo-sition, SedUnMix was run with the five sources against the source area sam-ples previously used to define the source compositions (see details in supplemen-tary material; Table S5). The results indi-cate a high proportion of sources S1, S2, S4, and S5 to the sediment compo-sition of their respective source samples
(from 65% to 100%; Table S4). The con-tribution of source S3 to its representa-tive source samples is weaker (from 7% to 47%; Table S4), and proportions are mainly shared with source S5. Spatial distributions for the proportions of inner gulf coastal inputs (S1 + S2), dust trans-port (S4) and external/oceanic contribu-tions (S3 + S5) to sediment mineralogical composition are presented respectively in Figure 4b–d. Sources S1 and S2 are abundant in the sediment assemblage of the coastal park areas and the north-east-central part of the GSJ (>40% with mean value ~70% close to the park). The proportions of sources S1 and S2 in sample composition are compara-tively low for the other sectors of the GSJ (<30%; Figure 4b). The results from Figure 4c indicate that a low to interme-diate fraction of the sediment assemblage
is associated with source S4 (<50%), with distribution limited to approximately ten samples in the northwestern and cen-tral parts of the GSJ. Nevertheless, this study focuses on the aeolian transport of silt and clay fraction particles using the <63 µm fraction of 08NS2 and the fine dry- bedload sediment from 07NS1 as source samples to generate a dust- related source (S4) in SedUnMix. Thus, we consider only the intermediate- to long- distance aeolian transport. This bias could have led to underestimating the wind-blown “coarse” dust, which is known to be deposited in the region as shown by the creation and displace-ment of dune fields south of Comodoro Rivadavia (Montes et al., 2015). S3 and S5 combined represent the source with the highest contribution to the sediment composition of the Gulf, excluding the
FIGURE 4. (a) Spatial
distri-bution of the elemental bal-ance for major mineral groups (i.e., b{(Quartz+Feldspars)/Clays}). (b–d) Maps showing rela-tive proportions of inner gulf coastal inputs (S1 + S2; b), dust transport (S4; c) and external/ oceanic contributions (S3 + S5; d) to sediment mineralog-ical composition. The propor-tions in major mineral groups (quartz, feldspars, and clays) of proposed sources (S1 + S2, S4, and S3 + S5) are pre-sented in pie charts.
! ! ! ! !!! ! ! ! ! ! ! ! ! ! ! ! ! !!!!!!!!!! !!!! ! ! ! ! ! ! ! ! !! ! ! ! ! ! ! ! ! ! ! ! ! !! 65°30'W 66°0'W 66°30'W 67°0'W 67°30'W 45°0'S 45°30'S 46°0'S 46°30'S 47°0'S 0 25 50 Kilometers
¹
! ! ! ! ! ! ! ! ! ! ! !! !!! ! ! ! ! !!!!!! !!!! ! ! ! ! ! ! ! ! ! ! ! ! ! ! ! ! ! ! ! ! ! ! ! ! ! ! ! ! ! ! ! ! ! ! ! ! ! ! ! ! 65°30'W 66°0'W 66°30'W 67°0'W 67°30'W 45°0'S 45°30'S 46°0'S 46°30'S 47°0'S 0 25 50 Kilometers¹
! ! ! ! ! ! ! ! ! ! ! ! ! !!! ! ! ! ! !!!!! ! ! ! ! ! ! ! ! ! ! ! ! ! ! ! ! ! ! ! ! ! ! ! ! ! ! ! ! ! ! ! ! ! ! ! ! ! ! ! ! ! ! ! ! ! 65°30'W 66°0'W 66°30'W 67°0'W 67°30'W 45°0'S 45°30'S 46°0'S 46°30'S 47°0'S 0 25 50 Kilometers¹
< Comodoro Rivadavia S1 + S2 (Proportions %) 0 R. Chicob
25 50 75 100 20 m 40 m 60 m 80 m 100 m < Comodoro Rivadavia S3 + S5 (Proportions %) 0 R. Chicod
25 50 75 100 20 m 40 m 60 m 80 m 100 m ! ! ! ! ! ! ! ! ! ! ! ! ! ! !! ! ! ! ! !!!!! ! ! ! ! ! ! ! ! ! ! ! ! ! ! ! ! ! ! ! ! ! ! ! ! ! ! ! ! ! ! ! ! ! ! ! ! ! ! ! ! ! ! ! ! ! 65°30'W 66°0'W 66°30'W 67°0'W 67°30'W 45°0'S 45°30'S 46°0'S 46°30'S 47°0'S 0 25 50 Kilometers¹
< Comodoro Rivadavia (Proportions %) S4 0 R. Chicoc
25 50 75 100 20 m 40 m 60 m 80 m 100 m ! ! ! ! ! ! ! ! ! ! ! ! ! ! ! ! ! ! ! ! !!!!!! !!! ! ! ! ! ! ! ! ! ! ! ! ! ! ! ! ! ! ! ! ! ! ! ! ! ! ! ! ! ! ! ! ! ! ! ! ! ! ! ! ! ! ! 65°30'W 66°0'W 66°30'W 67°0'W 67°30'W 45°0'S 45°30'S 46°0'S 46°30'S 47°0'S 0 25 50 Kilometers¹
< Comodoro Rivadavia b{(Quartz+Feldspars)/Clays} R. Chicoa
20 m 40 m 60 m 80 m 100 m 5.35 3.07 0.79 Quartz + Feldspars Clays Quartz FeldsparsClays S1+S2 composition (Major mineral groups)Quartz
Feldspars
Clays S4 composition (Major mineral groups)
Quartz
Feldspars
Clays S3+S5 composition (Major mineral groups)
coastal park areas, especially in the cen-tral sector (from 47% to 86%), in the southwest part (from 50% to 100%), and in the oceanic perimeter of the GSJ (from 56% to 100%; Figure 4d).
Elemental Geochemistry
The major element composition of bulk sediments from the GSJ is characterized by very high proportions of SiO2, high
contents of Al2O3, and lower concentra-tions of Fe2O3, CaO, K2O, MgO, TiO2,
P2O5, and MnO (Table S3). Sr, Zr, and V
dominate the minor and trace elements. The sediment samples are plotted in the log(SiO2/Al2O3) versus log(Fe2O3/K2O)
classification diagram (Herron, 1988) coupled with the results of the water sam-ple filters (surface and bottom) to com-pare the geochemical classification and
mineralogical maturity between sedi-ment from the seafloor and the water column (Figure 5c). The seafloor sedi-ments and suspended sediment in the water column are geochemically clas-sified as shale and wacke with no major distinction concerning the dispersion in the diagram of the seabed and suspended sediment samples.
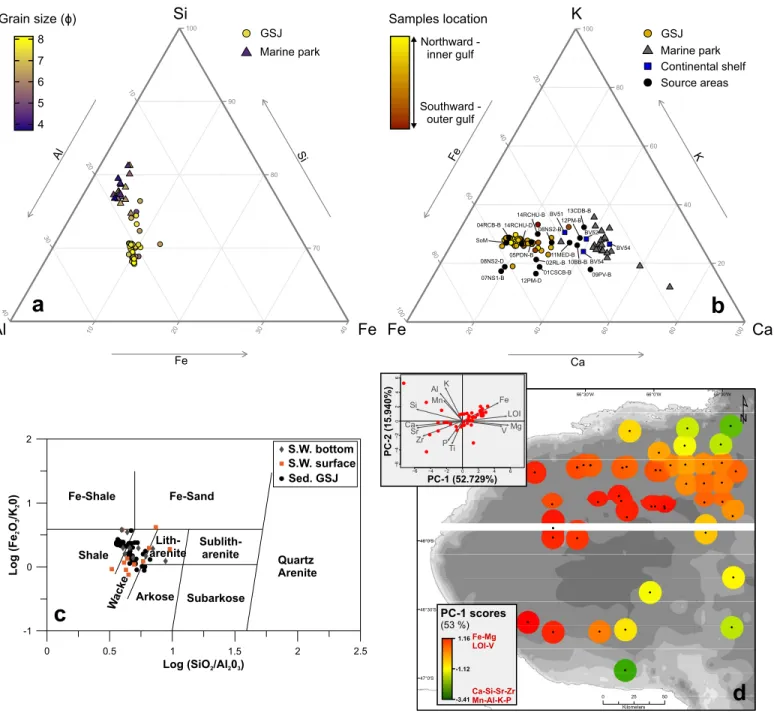
The ternary diagrams Al-Si-Fe and
FIGURE 5. (a) Si-Al-Fe abundances of marine park areas and other GSJ samples associated with mean grain size (Φ). (b) K-Fe-Ca distribution of marine
park areas and other GSJ samples, plotted together with potential source area samples, as well as surface sediment samples from the Patagonian con-tinental shelf (Table S3). The samples are illustrated according to their location in the gulf; northward-inner gulf to southward-outer gulf tendency calcu-lated from absolute latitude and longitude coordinates (excluding the park sites). (c) Herron (1988) geochemical classification diagram for surface sedi-ment and water column samples of the GSJ. (d) Biplot of the PC-1 versus PC-2 generated from the log-centered transformation of major, minor, and trace elements of GSJ samples, presented with map of PC-1 scores.
20 40 60 80 100 20 40 60 80 100 20 40 60 80 100 K Fe Fe Ca 01CSCB-B 02RL-B 04RCB-B 05PDN-B 07NS1-B 08NS2-D 08NS2-B 09PV-B 10BB-B 11MED-B 12PM-B 12PM-D 13CDB-B 14RCHU-B 14RCHU-D SoM K Ca Northward -inner gulf Southward -outer gulf 70 80 90 100 10 20 30 40 10 20 30 40 Si Al Al Fe Si Fe 8 7 6 5 4
Grain size (ɸ) Samples location
a
b
BV54 BV54 BV52 BV51 Fe-Shale Fe-Sand Quartz Arenite Subarkose Arkose Shale WackeLith-arenite Sublith-arenite
-1 0 1 2
0 0.5 1 1.5 2 2.5
Log (SiO /Al 0 ) 2 2 3
Log (Fe O /K 0) 23 2 Sed. GSJ S.W. surface S.W. bottom n n n n n n n n n n n ss sss s s s s s n s ! ! ! ! ! ! ! ! ! ! ! ! ! ! ! ! ! ! ! ! ! ! ! ! ! ! ! ! ! ! ! ! ! ! ! ! ! ! ! ! ! ! ! ! ! ! ! ! ! 65°30'W 66°0'W 66°30'W 67°0'W 67°30'W 45°0'S 45°30'S 46°0'S 46°30'S 47°0'S 0 25 50 Kilometers
¹
PC-1 scores (53 %) 1.16 -1.12 -3.41 Fe-Mg LOI-V Ca-Si-Sr-Zr Mn-Al-K-P −2 −4 PC-1 (52.729%) −6 PC-2 (15.940%) −6 −4 −2 0 2 4 6 0 2 4 6 Mg Al Si P K Ca Ti Mn Fe LOI V Sr Zr • • •••• ••••••••• • • • •• •• •••• •• • ••• ••• • • • • • • • • • • • • •c
d
Marine park GSJ Marine park Continental shelf Source areas GSJOceanography
| December 2018 | https://doi.org/10.5670/oceanog.2018.401 Fe-K-Ca (Figure 5a,b; see details in theonline supporting information) high-light the clear distinction between coastal park areas and central GSJ samples with higher relative proportions of Si (>74%; Figure 5a) and Ca (>38%; Figure 5b) in the park. The enrichment in Si seems positively correlated with coarser sedi-ments (Figure 5a).
We illustrate the scores from the first two principal components of the log- centered geochemical data (excluding the geochemically distinctive areas of the coastal park) as they account for more than 69% of the total variance (Figure 5d). PC-1 scores account for 53% of the total variance and appear to be positively cor-related with Fe-Mg-V-LOI and nega-tively correlated with Ca-Si-Sr-Zr-Mn-Al-K-P. The spatial distribution of PC-1 elemental geochemical scores indicates that high values dominate the central and southwest parts of the gulf and are asso-ciated with enrichment in Fe, Mn, and V in these areas (Figure 5d). These results expose a noticeable tendency similar to that of the bulk mineralogy distribution in the GSJ with higher enrichments in clays in the central and southwest parts of the GSJ (Figure 5a). Limited sectors in
the northeast and southeast parts of the GSJ, close to Capes Dos Bahias and Tres Puntas, present intermediate to low PC-1 scores (Figure 5d).
Clay Mineralogy
The clay mineral assemblage of sediment in the gulf is highly dominated by smec-tite with a contribution of more than 75% for at least 85% of the samples. In contrast, chlorite, illite, and kaolinite contents are rather low with average con-tributions close to 8%, 6.5%, and 1.5%, respectively (Table S2). The relative abundances of kaolinite, smectite, and coupled illite plus chlorite (I+C) of the GSJ samples, as well as marine and ter-restrial samples associated with potential source areas for sedimentary inputs in the GSJ, are plotted in a ternary diagram (Figure 6a,b). The results confirm the high proportions of smectite in GSJ sedi-ment, especially in the coastal park areas (Figure 6b). The spatial distribution of the log[smectite/(illite+chlorite)] ratios shows that the higher values occur in the southern part and on the oceanic perim-eter of the gulf, excluding the northeast sector, suggesting enrichment in I+C in these regions (Figure 6c).
SEDIMENT DISTRIBUTION, POTENTIAL SOURCE AREAS, AND TRANSPORT PATHWAYS
In the GSJ, grain size analysis and distri-bution are used to highlight two clearly distinct sedimentary environments. The dominance of coarser sediments (i.e., very fine sand) in the northern part of the gulf in the coastal marine park areas reflects moderate- to high-energy environments (erosive environments; Fernández et al., 2003). These sediments are mainly asso-ciated with EM1, especially the sediments close to Cape Dos Bahías, and to a lesser extent with EM2. Due to the absence of riverine inputs in the GSJ, we suggest that the well-sorted fine sand EM1 can be associated with sediments derived from local erosion (i.e., beach and cliff ero-sion; Isla et al., 2002), and the well-sorted coarse to medium silt EM2 with wind-blown “coarse” dust from nearby sources such as dune fields on the outskirts of the GSJ (Montes et al., 2015). The sec-ond distinct sedimentary environment is observed in the central part of the gulf with fine to very fine silts corresponding to a depositional environment with low energy (Fernández et al., 2003). The sed-iments in this area are almost exclusively
FIGURE 6. (a–b) Ternary diagram of smectite (S), kaolinite (K), and illite + chlorite (I+C) relative concentration in samples from marine park areas, other
GSJ samples, continental shelf, and potential source areas. (c) Spatial distribution of log[S/(I+C)]. 60 50 60 70 80 90 100 10 20 40 50 Smectite Kaolinit e Illite + Chlorite I+C S K 11-MED BV-51 02-RL 14-RCHU 01-CSCB 13-CDB 05-PDN 07-NS1 09-PV 08-NS2 10-BB 20 40 60 80 100 20 40 60 80 100 20 40 60 80 100 BV-54 SoM 04-RBC 12-PM BV-52 Fig. 6b
a
b
Zoom of dotted line area
! ! ! ! ! ! ! ! ! ! ! !! !!!! ! ! ! ! !!! ! ! !!! ! ! ! ! ! ! ! ! ! ! ! ! ! ! ! ! ! ! ! ! ! ! ! ! ! ! ! ! ! ! ! ! ! ! ! ! ! ! ! ! ! 65°30'W 66°0'W 66°30'W 67°0'W 67°30'W 45°0'S 45°30'S 46°0'S 46°30'S 47°0'S 0 25 50 Kilometers Comodoro Rivadavia Log [S/(I+C)] R. C hico
c
20 m 40 m 60 m 80 m 100 m 1.56 0.91 0.25ChloriteIllite + Smectite Marine park Continental shelf Source areas GSJassociated with EM3, which is character-ized by a large dominant mode extend-ing from medium silt to clay that could reflect a depositional environment asso-ciated with sediments transported over significant distances (e.g., currents and aeolian transport).
The bulk mineralogy, rather homo-geneous and dominated by plagioclase, quartz, and clay minerals, is in accor-dance with the topsoil and riverine min-eralogy from eastern Patagonia previ-ously published in Gaiero et al. (2004). The high proportions of plagioclase and quartz reflect the dominant volcanic sig-nature of Patagonia, mainly driven by the southern volcanic zone of the Andean Cordillera but also, to a lesser extent, by volcanic rocks erupted since the Jurassic. Indeed, numerous studies have high-lighted the major influence of Andean volcanism on the mineralogical, chemi-cal, and isotopic signatures of beach, riv-erine, and marine samples from western (Bertrand et al., 2012), as well as east-ern Patagonia (Potter, 1994; Gaiero et al., 2007). The prevalence of clays in the riv-erine samples (Chubut and Deseado), as well as in samples from the area known as “Bajo de Sarmiento,” suggests that riv-erine and aeolian transports have an impact on the inputs of clays in the GSJ. According to Gaiero et al. (2004), the sus-pended loads of the Chubut and Deseado Rivers, likely to be partially transported to the gulf, present the highest propor-tions of clay minerals in comparison to other Patagonian riverine and top-soil samples. Furthermore, the poten-tial of wind to transport clays from dust source areas such as Bajo de Sarmiento (Prospero et al., 2002; Montes et al., 2017) is reinforced by the nature of the soil cov-ering the Gulf of San Jorge Basin. Indeed, the soil is mainly composed of yermosols that are often characterized by a devel-oped argillic (clay) B horizon that is eas-ily eroded by wind (Gut, 2008). In the GSJ, the sediments enriched in clay min-erals are located in the deep and cen-tral areas that are associated with weaker hydrodynamic conditions and identified
as depositional environments (Fernández et al., 2003). In addition, the appreciable amounts of volcaniclastic particles, iden-tified as rhyolitic tephras (Figure S2) in the bulk mineralogical composition and observed as glass shards in SEM images of the surface sediments (Figure S3b,c), also support the aeolian and riverine transport contribution, as opposed to coastal erosion, which carries modern and past (i.e., remobilization of terres-trial tephra deposits) volcanogenic parti-cles into the GSJ. Furthermore, the geo-chemical composition of glass shards suggests a dominance of rhyolitic volca-niclastic material (Figure S3d); however, the sources of recent rhyolitic products are rare in the volcanic zone close to the GSJ (i.e., Southern Volcanic Zone of the Andes), except for the Chaitén volcano in Chile (López-Escobar et al., 1993). Thus, we hypothesize that the ash plumes gen-erated by the explosive rhyolite eruptions of Chaitén volcano and the remobiliza-tion of associated tephra deposits repre-sent the most conclusive source of mod-ern tephra in the GSJ.
The well-defined correlation between the grain-size distribution and the bulk mineralogy, where the coarser grains are associated with clay-poor and plagioclase/ quartz-rich samples (Figures 2 and 4a), highlights the presumptive impact of the grain size on the sediment mineral com-position. Therefore, the bulk mineral composition of sediments in the GSJ is primarily controlled by the dominant and homogeneous continental volcanic signa-ture in Patagonia, but it is also influenced by the grain-size distribution.
Our analysis of clay-mineral assem-blages in the GSJ, highly dominated by smectite, is relatively consistent with the results reported both on the nearshore areas of Patagonia (Pierce and Siegel, 1979) and on the continent (i.e., riverine and topsoil material; Gaiero et al., 2004). This high smectite content is related to the combination of two factors: (1) poten-tial high inputs of smectite from adjacent eastern and southern Patagonian sources (Petschick et al., 1996; Diekmann et al.,
2000), and (2) rapid gravitational settling on coastal areas of smectite compared to other clay minerals (Pierce and Siegel, 1979). Indeed, the well-crystallized smec-tite observed in the gulf (Table S2) is mostly connected to the physical weath-ering of Si-poor rocks, such as the basal-tic and basalt-andesibasal-tic formations dom-inating the Cenozoic volcanism in the central part of Patagonia (Petschick et al., 1996; Corbella and Lara, 2008). Moreover, the smectite transported onto the Patagonian Shelf seems to be derived at selected locations from large morainic and glacio-fluvial Quaternary deposits (Marinoni et al., 1997). It should be noted that in the vicinity of the Gulf of San Jorge Basin, sedimentary and pyroclastic rocks represent potential sources of smectite (e.g., Las Flores Formation [Raigemborn et al., 2009]; Bajo Grande Formation [Dominguez et al., 2008]). Furthermore, because of the high proportions of smec-tite from the Bajo de Sarmiento (07NS1 and 08NS2) and the Deseado River (05PDN) samples, as well as its scattered proportions in the GSJ shore samples, the clay-mineral assemblages of riverine and terrestrial samples point to riverine and aeolian transport as the main suppliers of smectite to the gulf (Figure 6a,b).
The contrast between low to moder-ate proportions of illite and chlorite in the GSJ and higher contents in the shelf samples shows the influence of conti-nental shelf inputs for these clay miner-als in the gulf. The illite and chlorite are derived from Patagonian batholiths and low-grade metamorphic rocks located in Antarctica as well as in Patagonia (Petschick et al., 1996; Diekmann et al., 2000). The chlorite and illite are both transported from southern South America and the Drake Passage along the Argentinean continental shelf (Petschick et al., 1996). Once sediments settle on the shelf, the northward circulation controls their redistribution and transport (Palma et al., 2008). The inputs of illite and chlo-rite to the GSJ by the Patagonian Current flowing northward through the continen-tal shelf from southern South America
Oceanography
| December 2018 | https://doi.org/10.5670/oceanog.2018.401 are also supported by I+C enrichmentin the eastern and southern parts of the gulf (Figure 6c).
In addition, the concentration of kaolinite in the gulf is very low despite the numerous outcrops of rhyolites and ignimbrites in eastern Patagonia, known as potential sources of residual kaolin deposits (Dominguez et al., 2008), and despite the significant amount of kaolin-ite in the Las Flores Formation, which overlies tablelands in some sectors of the San Jorge Gulf Basin (Raigemborn et al., 2009). This near absence of kaolinite may be due to dilution with much higher con-tents of smectite, illite, and chlorite.
The major and minor element com-position of surface sediments seems well correlated to the mineralogical properties in the GSJ. The PC-1 scores derived from elemental geochemistry signatures show patterns of distribution similar to those found in the elemental balance of major mineral groups in the gulf. The large pos-itive PC-1 scores are associated with Fe, Mg, and V in areas enriched in clays, and conversely, negative PC-1 scores are asso-ciated with Ca, Si, Sr, Zr, Mn, Al, K, and P in areas enriched in quartz and feld-spar (Figures 5d and 4a). Furthermore, numerous major elements reveal good correlations with various minerals iden-tified in the gulf. For example, the major components Si, Fe, and Ca are linked to the presence of quartz (r2 = 0.61; Figure S4a), the sum of Fe-bearing min-erals (notably, pyrite, magnetite, hema-tite, goethite, and maghemite) and clays (r2 = 0.66; Figure S4d), and plagioclase
(r2 = 0.77, Figure S4b), respectively. The
relationship between mineralogy and major element composition supports and strengthens the use of quantitative X-ray diffraction to determine the mineral-ogy of sediment samples, as well as the use of SedUnMix to estimate the propor-tions of potential sources for the compo-sition of surface sediments in the GSJ. In addition, the absence of clear differences in the geochemical classification between particles from suspended sediments from the water column and surface sediments
from the same site reveals that most of the material carried toward the surface water of the gulf settle on the bottom of the GSJ (Figure 5c).
SUMMARY AND CONCLUSIONS
The investigation of grain size, bulk and clay mineralogy, and the geochemistry of surficial sediments from the GSJ was used to highlight the nature and spa-tial variability of surface sediments. The results reveal and allow quantification of numerous factors, such as continental volcanism, local coastal inputs (i.e., ero-sion and runoff), dust and aeolian trans-port, hydrodynamic conditions, and the northward- flowing Patagonian Current, that impact sedimentation in the GSJ. Based on our interpretation, coupled with nonlinear mixing models (SedUnMix) of
bulk mineralogy, we suggest that the ori-gin of sediments in the GSJ is 50% from external/oceanic inputs, 40% from the inner gulf shores, and 10% from dust (i.e., aeolian transport). In the central part of the GSJ, a region associated with a lower-energy depositional environment enriched in clays (Figure 7), the contribu-tions of external/oceanic and dust inputs increase to 60% and 15%, respectively, whereas inner gulf shore inputs decrease to 25%. The marine park area in the northeastern part of the GSJ constitutes an erosive environment linked to high proportions of quartz, plagioclase, and smectite (Figure 7), with a large contri-bution from the inner gulf shores (70%) to sediment composition. Furthermore, the southeastern part of the gulf can also be considered a distinct sedimentary
! ! ! ! ! ! ! ! ! ! ! ! !!! ! ! ! ! ! !!!!!!! !! ! ! ! ! ! ! ! ! ! ! ! ! ! ! ! ! ! ! ! ! ! ! ! ! ! ! ! ! ! ! ! ! ! ! ! ! ! ! ! ! ! ! 66°W 46°S 0 30 60 Kilometers
¹
20 m40 m 60 m 80 m 100 m < Comodoro Rivadavia Río Chico Río Deseado 67°W 65°W 45°S 47°SSedimentary regions Transport pathways
Aeolian transport - Dust Northward shelf current - Rivers Coastal erosion - Runoff Central - Depositional environment
Coastal park - Erosive environment SE Gulf - High oceanic influence
Chlorite Illite Smectite Clays + Tephras Quartz + Plagioclase Quartz + Plagioclase Quartz Clays Smectite
FIGURE 7. Schematic map of the main sedimentary regions and transport
path-ways identified in the Gulf of San Jorge area. The sedimentary regions were
determined according to the authors’ interpretations and previous results from Fernández et al. (2003). The bulk terrigenous inputs are illustrated with filled arrows, and the terrigenous clay inputs are depicted with dotted arrows. Note that the spatial distribution of the samples does not follow a regular and homo-geneous pattern, leading to potentially underrepresented areas.
region enriched in quartz, illite, and chlo-rite minerals and highly influenced by external/ oceanic inputs related to the northward-flowing continental shelf current (85%; Figure 7). Finally, in the absence of current major fluvial inputs, these results highlight the combined con-tributions of various sediment sources and transport mechanisms that must be taken into account when investigating recent and past sediment distributions and their interactions with biogeochem-ical processes in the GSJ. It is necessary to keep in mind that fluvial inputs were significant (Kokot, 2004) during past glaciations and deglaciations following sea level changes and glacial meltwater pulses, thus adding other possible sedi-ment sources to the sedisedi-mentary budget during these periods.
SUPPLEMENTARY MATERIALS
Supplementary materials are available online at
https://doi.org/10.5670/oceanog.2018.401.
REFERENCES
Andrews, J., G. Kristjánsdóttir, D.D. Eberl, and A. Jennings. 2013. A quantitative x-ray diffraction inventory of volcaniclastic inputs into the marine sediment archives off Iceland: A contribution to the Volcanoes in the Arctic System programme. Polar
Research 32(1):11130, https://doi.org/10.3402/polar. v32i0.11130.
Andrews, J.T., and C. Vogt. 2014. Source to sink: Statistical identification of regional variations in the mineralogy of surface sediments in the west-ern Nordic Seas (58°N–75°N; 10°W–40°W). Marine
Geology 357:151–162, https://doi.org/10.1016/ j.margeo.2014.08.005.
Bertrand, S., K.A. Hughen, J. Sepulveda, and S. Pantoja. 2012. Geochemistry of surface sed-iments from the fjords of Northern Chilean Patagonia (44–47°S): Spatial variability and implica-tions for paleoclimate reconstrucimplica-tions. Geochimica
et Cosmochimica Acta 76:125–146, https://doi.org/ 10.1016/j.gca.2011.10.028.
Corbella, H., and L.E. Lara. 2008. Late Cenozoic quaternary volcanism in Patagonia and Tierra del Fuego. Developments in Quaternary
Sciences 11:95–119, https://doi.org/ 10.1016/ S1571-0866(07)10006-3.
Coronato, A.M., F. Coronato, E. Mazzoni, and M. Vázquez. 2008. The physical geography of Patagonia and Tierra del Fuego. Developments
in Quaternary Sciences 11:13–55, https://doi.org/ 10.1016/S1571-0866(07)10003-8.
Crespi-Abril, A.C., A.M.I. Montes, G.N. Williams, and M.F. Carrasco. 2016. Uso de sensores remotos para la detección de eventos de transporte eólico de sedimentos hacia ambientes marinos en Patagonia.
Meteorologica 41(2):33–47.
Crespi-Abril, A.C., G. Soria, A. De Cian, and C. López-Moreno. 2018. Roaring forties: An analysis of a decadal series of data of dust in Northern Patagonia. Atmospheric Environment 177:111–119,
https://doi.org/10.1016/ j.atmosenv.2017.11.019.
Cuitiño, J.I., R.A. Scasso, R. Ventura Santos, and L.H. Mancini. 2015. Sr ages for the Chenque Formation in the Comodoro Rivadavia region (Golfo San Jorge Basin, Argentina): Stratigraphic impli-cations. Latin American Journal of Sedimentology
and Basin Analysis 22(1):13–28.
de Mahiques, M.M., C.C.G. Tassinari, S. Marcolini, R.A. Violante, R.C.L. Figueira, I.C.A. da Silveira, L. Burone, and S.H. de Mello e Sousa. 2008. Nd and Pb isotope signatures on the Southeastern South American upper margin: Implications for sediment transport and source rocks. Marine
Geology 250(1):51–63, https://doi.org/ 10.1016/ j.margeo.2007.11.007.
Diekmann, B., G. Kuhn, V. Rachold, A. Abelmann, U. Brathauer, D.K. Fütterer, R. Gersonde, and H. Grobe. 2000. Terrigenous sediment supply in the Scotia Sea (Southern Ocean): Response to Late Quaternary ice dynamics in Patagonia and on the Antarctic Peninsula. Palaeogeography,
Palaeoclimatology, Palaeoecology 162(3):357–387,
https://doi.org/10.1016/S0031-0182(00)00138-3. Dominguez, E., C. Iglesias, and M. Dondi. 2008. The
geology and mineralogy of a range of kaolins from the Santa Cruz and Chubut Provinces, Patagonia (Argentina). Applied Clay Science 40(1):124–142,
https://doi.org/10.1016/ j.clay.2007.07.009. Eberl, D.D. 2003. User Guide to RockJock-A Program
for Determining Quantitative Mineralogy from X-Ray Diffraction Data. US Geological Survey, Open-File Report 03-78.
Fernández, M., J.I. Carreto, J. Mora, and A. Roux. 2005. Physico-chemical charac-terization of the benthic environment of the Golfo San Jorge, Argentina. Journal of the
Marine Biological Association of the United Kingdom 85(6):1,317–1,328, https://doi.org/10.1017/ S002531540501249X.
Fernández, M., A. Roux, E. Fernández, J. Caló, A. Marcos, and H. Aldacur. 2003. Grain-size analysis of surficial sediments from Golfo San Jorge, Argentina. Journal of the
Marine Biological Association of the United Kingdom 83(6):1,193–1,197, https://doi.org/10.1017/ S0025315403008488.
Gaiero, D.M., F. Brunet, J.-L. Probst, and P.J. Depetris. 2007. A uniform isotopic and chemical signature of dust exported from Patagonia: Rock sources and occurrence in southern environments. Chemical
Geology 238:107–120, https://doi.org/10.1016/ j.chemgeo.2006.11.003.
Gaiero, D.M., P.J. Depetris, J.-L. Probst, S.M. Bidart, and L. Leleyter. 2004. The signature of river-and wind-borne materials exported from Patagonia to the southern latitudes: A view from REEs and impli-cations for paleoclimatic interpretations. Earth
and Planetary Science Letters 219(3):357–376,
https://doi.org/ 10.1016/S0012-821X(03)00686-1. Gaiero, D.M., J.-L. Probst, P.J. Depetris, S.M. Bidart,
and L. Leleyter. 2003. Iron and other transition metals in Patagonian riverborne and windborne materials: geochemical control and transport to the southern South Atlantic Ocean. Geochemica
et Cosmochimica Acta 67(19):3,603–3,623,
https://doi.org/ 10.1016/S0016-7037(03)00211-4. Gamboa, A., J. Montero-Serrano, G. St-Onge,
A. Rochon, and P.-A. Desiage. 2017. Mineralogical, geochemical, and magnetic signatures of surface sediments from the Canadian Beaufort Shelf and Amundsen Gulf (Canadian Arctic). Geochemistry,
Geophysics, Geosystems 18(2):488–512,
https://doi.org/ 10.1002/ 2016GC006477.
Gut, B. 2008. Geology, climate and soils of Patagonia. Pp. 9–18 in Trees in Patagonia. Springer Science & Business Media.
Herron, M.M. 1988. Geochemical classification of ter-rigenous sands and shales from core or log data.
Journal of Sedimentary Research 58(5):820–829,
https://doi.org/10.1306/212F8E77-2B24-11D7-8648000102C1865D.
Isla, F.I., N. Iantanos, and E. Estrada. 2002. Playas reflectivas y disipativas macromareales del Golfo San Jorge, Chubut. Revista de La Asociación
Argentina de Sedimentología 9(2):155–164. Kilian, R., and F. Lamy. 2012. A review of
gla-cial and Holocene paleoclimate records from southernmost Patagonia (49–55°S). Quaternary
Science Reviews 53:1–23, https://doi.org/10.1016/ j.quascirev.2012.07.017.
Kokot, R.R. 2004. Erosión en la costa patagónica por cambio climático. Revista de La Asociación
Geológica Argentina 59(4):715–726. López-Escobar, L., R. Kilian, P.D. Kempton, and
M. Tagiri. 1993. Petrography and geochemistry of Quaternary rocks from the Southern Volcanic Zone of the Andes between 41°30' and 46°00'S, Chile.
Andean Geology, 20(1):33–55. Marinoni, L., M. Setti, and F. Soggetti. 1997.
Mineralogy of sea-bottom sediments from the Strait of Magellan. Bolletino di Geofisica Teorica ed
Applicata 38:281–292.
Martínez, O.A., and A. Kutschker. 2011. The “Rodados Patagónicos” (Patagonian shingle formation) of eastern Patagonia: Environmental conditions of gravel sedimentation. Biological Journal of the
Linnean Society 103(2):336–345, https://doi.org/ 10.1111/ j.1095-8312.2011.01651.x.
Montes, A., S.S. Rodríguez, and C.E. Domínguez. 2017. Geomorphology context and characteri-zation of dunefields developed by the southern westerlies at drying Colhué Huapi shallow lake, Patagonia Argentina. Aeolian Research 28:58–70,
https://doi.org/ 10.1016/j.aeolia.2017.08.001. Montes, A., S. Rodríguez, C. San Martín, and J. Allard.
2015. Migración de campos de dunas en caña-dones costeros de Patagonia: Geomorfología e implicaciones paleoclimáticas. Revisita de la
Sociedad Geologica de España 28(2):65–76. Nagai, R.H., P.A.L. Ferreira, S. Mulkherjee,
M.V. Martins, R.C.L. Figueira, S.H.M. Sousa, and M.M. Mahiques. 2014. Hydrodynamic con-trols on the distribution of surface sediments from the southeast South American continen-tal shelf between 23°S and 38°S. Continencontinen-tal
Shelf Research 89:51–60, https://doi.org/10.1016/ j.csr.2013.09.016.
Palma, E.D., R.P. Matano, and A.R. Piola. 2008. A numerical study of the Southwestern Atlantic Shelf circulation: Stratified ocean response to local and offshore forcing. Journal of
Geophysical Research 113(C11), https://doi.org/ 10.1029/2007JC004720.
Pankhurst, R.J., P.T. Leat, P. Sruoga, C.W. Rapela, M. Márquez, B.C. Storey, and T.R. Riley. 1998. The Chon Aike province of Patagonia and related rocks in West Antarctica: A silicic large igneous prov-ince. Journal of Volcanology and Geothermal
Research 81(1):113–136, https://doi.org/10.1016/ S0377-0273(97)00070-X.
Petschick, R., G. Kuhn, and F. Gingele. 1996. Clay mineral distribution in surface sediments of the South Atlantic: Sources, transport, and relation to oceanography. Marine Geology 130(3):203–229,
https://doi.org/ 10.1016/0025-3227(95)00148-4. Pierce, J.W., and F.R. Siegel. 1979. Suspended
par-ticulate matter on the southern Argentine shelf.
Marine Geology 29(1):73–91, https://doi.org/ 10.1016/0025-3227(79)90103-8.
Potter, P.E. 1994. Modern sands of South America: Composition, provenance and global signifi-cance. Geologische Rundschau 83(1):212–232,
Oceanography
| December 2018 | https://doi.org/10.5670/oceanog.2018.401Preda, M., and M.E. Cox. 2005. Chemical and min-eralogical composition of marine sediments, and relation to their source and transport, Gulf of Carpentaria, Northern Australia. Journal of Marine
Systems 53(1):169–186, https://doi.org/10.1016/ j.jmarsys.2004.05.003.
Prospero, J.M., P. Ginoux, O. Torres, S.E. Nicholson, and T.E. Gill. 2002. Environmental characteriza-tion of global sources of atmospheric soil dust identified with the Nimbus 7 Total Ozone Mapping Spectrometer (TOMS) absorbing aerosol product.
Reviews of Geophysics 40(1):2–31, https://doi.org/ 10.1029/2000RG000095.
Raigemborn, M., M. Brea, A. Zucol, and S. Matheos. 2009. Early Paleogene climate at mid latitude in South America: Mineralogical and paleobo-tanical proxies from continental sequences in Golfo San Jorge basin (Patagonia, Argentina).
Geologica Acta: An International Earth Science Journal 7(1–2):125–145, https://doi.org/ 10.1344/ 105.000000269.
Saukel, C., R. Stein, C. Vogt, and V.P. Shevchenko. 2010. Clay-mineral and grain-size distributions in surface sediments of the White Sea (Arctic Ocean): Indicators of sediment sources and trans-port processes. Geo-Marine Letters 30(6):605–616,
https://doi.org/ 10.1007/ s00367-010-0210-2. Spagnoli, F., G. Bartholini, E. Dinelli, and P. Giordano.
2008. Geochemistry and particle size of sur-face sediments of Gulf of Manfredonia (Southern Adriatic Sea). Estuarine, Coastal and Shelf
Science 80(1):21–30, https://doi.org/10.1016/ j.ecss.2008.07.008.
Sylwan, C.A. 2001. Geology of the Golfo San Jorge Basin, Argentina. Geología de la Cuenca del Golfo San Jorge, Argentina. Journal of Iberian
Geology 27:123–158.
Violante, R.A., C.M. Paterlini, S.I. Marcolini, I.P. Costa, J.L. Cavallotto, C. Laprida, W. Dragani, N.G. Chapori, S. Watanabe, and V. Totah. 2014. The Argentine continental shelf: Morphology, sed-iments, processes and evolution since the Last Glacial Maximum. Geological Society, London,
Memoirs 41(1):55–68, https://doi.org/10.1144/M41.6.
ACKNOWLEDGMENTS
The authors would like to sincerely thank the cap-tain, crew, and scientific participants of the COR1404 (MARES and MARGES) expedition on board the R/V Coriolis II. Financial support for MARES and MARGES expeditions was provided by the Ministerio de Ciencia, Tecnología e Innovación Productiva (MINCyT), Provincia de Chubut and Consejo Nacional de Investigaciones Científicas y Técnicas (CONICET). This research was funded by the Natural Sciences and Engineering Research Council of Canada (NSERC) through Discovery grants to G. St-Onge and J.-C. Montero-Serrano and by the Fond de recher-che du Québec – Nature et Technologies (FRQNT) through a team grant to G. St-Onge, J.-C. Montero-Serrano, and A. Rochon. We also acknowledge the financial support of the Canadian Foundation for Innovation (CFI) and Economic Development Canada for the acquisitions of the PANalytical X-ray diffrac-tometer (X’Pert Powder) and the X-ray fluorescence (Epsilon 3-XL), respectively. We acknowledge the use of imagery from the NASA Worldview
applica-tion (https://worldview.earthdata.nasa.gov/)
oper-ated by the NASA/Goddard Space Flight Center Earth Science Data and Information System (ESDIS) proj-ect. The authors thank Pierre Larouche of Fisheries and Oceans Canada for providing water column sam-ples. We are thankful to Claude Belzile and Quentin Beauvais (UQAR-ISMER) for SEM image acquisi-tion and technical support. Finally, we are grateful to reviewers John T. Andrews and Federico Spagnoli for their constructive reviews.
AUTHORS
Pierre-Arnaud Desiage (desiage.pierre.arnaud@
gmail.com) is PhD student and Jean-Carlos
Montero-Serrano is Professor, both at the Institut des sciences de la mer de Rimouski, Université du Québec à Rimouski, Rimouski, Québec, Canada.
Guillaume St-Onge is Professor and Canada Research Chair in Marine Geology, Institut des sciences de la mer de Rimouski, Université du Québec à Rimouski, Rimouski, Québec, Canada.
Augusto César Crespi-Abril is Associate Professor, Universidad Nacional de la Patagonia San Juan Bosco (UNPSJB), Puerto Madryn, Argentina, and Research Scientist, Centro para el Estudio de los Sistemas Marinos, Centro Nacional Patagónico (CENPAT), Consejo Nacional de Investigaciones Científicas y Técnicas (CONICET), Puerto Madryn,
Argentina. Erica Giarratano is Research Scientist
CENPAT, CONICET, Puerto Madryn, Argentina.
Mónica Noemí Gil is Associate Professor, UNPSJB, Puerto Madryn, Argentina, and Senior Professional CENPAT, CONICET, Puerto Madryn, Argentina.
Miguel J. Haller is Professor Emeritus UNPSJB, Puerto Madryn, Argentina, and Senior Researcher CENPAT, CONICET, Puerto Madryn, Argentina.
ARTICLE CITATION
Desiage, P.-A., J.-C. Montero-Serrano, G. St-Onge, A.C. Crespi-Abril, E. Giarratano, M.N. Gil, and M.J. Haller. 2018. Quantifying sources and trans-port pathways of surface sediments in the Gulf of San Jorge, central Patagonia (Argentina).
Oceanography 31(4), https://doi.org/10.5670/ oceanog.2018.401.
Prior to the grain size, bulk mineralogi-cal, and geochemical analyses, samples (<2 mm) were pretreated with 10 ml of hydrogen peroxide (H2O2; 30%) and 10 ml of hydrochloric acid (HCl; 0.5 N) for at least 72 hours to remove organic mat-ter and biogenic carbonate. Next, an ali-quot of this sediment sample was ground using a micronizing mill (McCrone) and 5 ml of ethanol for approximatively 10 minutes until a homogeneous mixture of grain <10 µm was obtained. The mix-ture was oven-dried at 60°C and ground again in an agate mortar to prevent aggre-gations of fine particles due to drying. Aliquots of these homogenized sediment samples were used for bulk mineralogical and geochemical analyses.
The observations of tephra using a JEOL 6460LV SEM were performed on the 300–63 µm and <63 µm fractions of the BV01, BV06, and BC11 samples. Before sieving, the samples were pre-treated with 10 ml of hydrogen peroxide (H2O2; 30%) for 24 hours and rinsed with distilled water at least five times. Finally, the samples were oven-dried at 60°C. GRAIN-SIZE ANALYSIS
The grain-size analysis of sediment sam-ples was carried out on detrital fraction using a Beckman Coulter Particle Size Analyzer LS 13 320 (0.04–2,000 µm). Deflocculation was performed by succes-sive washing with distilled water and the samples were mechanically shaken for 12 hours before measurement. Grain-size distribution and statistical parameters were processed with the GRADISTAT software using the geometric (µm) and logarithmic (φ) method of moments (Blott and Pye, 2001). The end-mem-ber modeling algorithm (EMMA; Dietze et al., 2012) was applied to the grain-size data. The EMMA algorithm is used to unmix the original grain-size distribution
(Figure 2b) in order to extract
meaning-ful EM grain-size distributions and thus
to estimate the processes (transport con-ditions) related to the EM grain-size dis-tributions (Dietze et al., 2012). The char-acteristics and detailed procedures of the EMMA method used for this study are presented in Dietze et al. (2012) and Dietze and Dietze (2013).
SOURCE SAMPLES
In order to quantify potential sources of sediment in the GSJ, 13 terrestrial and riverine samples were retrieved in August 2016 (Figure 1a,b); nine of them were
col-lected on the shore of the GSJ (topsoil and beach sediments), two at the mouths of the Chubut and Deseado Rivers (river bank and beach sediments, respectively), and two in the Bajo de Sarmiento area (topsoil sediments from the dry bed of Lake Colhué Huapí [NS1] and 10 km to the east of the lake, close to dune fields formed by the southern westerlies [NS2; Montes et al., 2017]). A marine sur-face sediment sample (0–2 cm sediment depth) from Magellan Strait was also analyzed. The latter was recovered with a CASQ gravity corer (MD07-3131) during the MD 159 PACHIDERME expedi-tion on board R/V Marion Dufresne II
(Figure 1a; February 2007).
BULK MINERAL ANALYSIS
The random powder samples were side-loaded into holders and analyzed by X-ray diffraction (XRD) using a PANalytical X’Pert Powder diffractometer. The sam-ples were measured between 5° and 65° 2θ in steps of 0.02° and a counting time of 2 seconds per step. Bulk mineral associa-tions were analyzed following the quanti-tative method developed by Eberl (2003) and Eberl and Smith (2009) and used in other Late Quaternary marine stud-ies that deal with sediment mineralogy (e.g., Andrews et al., 2015, 2016; Andrews and Vogt 2014). For the quantification of the major mineralogical components, the XRD scans were converted into mineral
weight percentages (wt.%) using the stan-dardless option of the Excel macro-pro-gram Rockjock v11 (Eberl, 2003; Eberl and Smith, 2009). This program uses a full-pattern fitting method that permits the quantification of the whole-sediment mineralogy with an error of approxi-matively ±3 wt% at 50 wt% of a mineral (Eberl, 2003). To verify the quality of this fitting procedure, a degree-of-fit (DOF = minimum absolute difference) statistic was calculated between the measured and simulated XRD patterns. The DOF values obtained with our samples were satisfy-ing. They were within a range of 0.072 to 0.442 with an average of 0.165 for the 95 samples. Polytypes of illite, smectite, pla-gioclase feldspars, and K-feldspars are reported as a total amount (e.g., Andrews and Vogt, 2014; Andrews et al., 2015, 2016). This qXRD method came in sec-ond in the international “Reynolds Cup” quantitative mineral analysis competition (Omotoso et al., 2006). The calculated total mineral wt% was normalized to sum to 100%. We present the wt % data for 12 minerals (Table S2), but we focus on 11 minerals and exclude carbonates and bio-tite because of their restricted occurrence
(Table S5).
Likewise, we used the nonlin-ear unmixing Excel macro program SedUnMixMC (Andrews and Eberl, 2012; Andrews et al., 2015, 2016) to obtain a quantitative understanding of the surface changes in sediment prove-nance. We ran SedUnMixMC on the nor-malized (100%) data for the 11 key min-erals (Table S5) that represented more than 99% of the overall mineral con-centration in the sediment samples. SedUnMixMC allows up to six sources to be examined as potential contributors to sediment composition. Based on sur-face geology (e.g., Pankhurst and Rapela, 1995; Pankhurst et al., 1998; see Physical Setting section in main text) and sedi-ment transport pathways (e.g., Matano