Montréal Mars 2001
Série Scientifique
Scientific Series
2001s-18Perspectives on IT Outsourcing
Success: Covariance Structure
Modelling of a Survey of
Outsourcing in Australia
Anne C. Rouse, Brian Corbitt,
CIRANO
Le CIRANO est un organisme sans but lucratif constitué en vertu de la Loi des compagnies du Québec. Le financement de son infrastructure et de ses activités de recherche provient des cotisations de ses organisations-membres, d’une subvention d’infrastructure du ministère de la Recherche, de la Science et de la Technologie, de même que des subventions et mandats obtenus par ses équipes de recherche.
CIRANO is a private non-profit organization incorporated under the Québec Companies Act. Its infrastructure and research activities are funded through fees paid by member organizations, an infrastructure grant from the Ministère de la Recherche, de la Science et de la Technologie, and grants and research mandates obtained by its research teams.
Les organisations-partenaires / The Partner Organizations
•École des Hautes Études Commerciales •École Polytechnique
•Université Concordia •Université de Montréal
•Université du Québec à Montréal •Université Laval •Université McGill •MEQ •MRST •Alcan inc. •AXA Canada •Banque du Canada
•Banque Laurentienne du Canada •Banque Nationale du Canada •Banque Royale du Canada •Bell Québec
•Bombardier •Bourse de Montréal
•Développement des ressources humaines Canada (DRHC)
•Fédération des caisses populaires Desjardins de Montréal et de l’Ouest-du-Québec •Hydro-Québec
•Imasco
•Industrie Canada
•Pratt & Whitney Canada Inc. •Raymond Chabot Grant Thornton •Ville de Montréal
© 2001 Anne C. Rouse, Brian Corbitt et Benoit A. Aubert. Tous droits réservés. All rights reserved. Reproduction partielle permise avec citation du document source, incluant la notice ©.
Short sections may be quoted without explicit permission, if full credit, including © notice, is given to the source.
ISSN 1198-8177
Ce document est publié dans l’intention de rendre accessibles les résultats préliminaires de la recherche effectuée au CIRANO, afin de susciter des échanges et des suggestions. Les idées et les opinions émises sont sous l’unique responsabilité des auteurs, et ne représentent pas nécessairement les positions du CIRANO ou de ses partenaires.
This paper presents preliminary research carried out at CIRANO and aims at encouraging discussion and comment. The observations and viewpoints expressed are the sole responsibility of the authors. They do not necessarily represent positions of CIRANO or its partners.
Perspectives on IT Outsourcing Success:
Covariance Structure Modelling of a Survey
of Outsourcing in Australia
*Anne C. Rouse
†, Brian Corbitt
‡, Benoit A. Aubert
§ Résumé / AbstractL'Australie a été un pionnier dans l'adoption de l'impartition pour les services informatiques. Toutefois, les résultats ont été mitigés. Avec plus de deux cent répondants, provenant des 1000 plus grandes entreprises australiennes, cette étude et une des plus larges et représentatives faites jusqu'à maintenant. Une analyse des structure de co-variance, de même qu'une anlayse factorielle confirmatoire jettent un regard neuf sur la notion de succès de l'impartition. L'étude met en lumière le caractère complexe et multi-dimensionel de ce succès.
Australia has been at the forefront of the adoption of outsourcing as a means for delivering IT services, but the success of IT outsourcing in Australia has been mixed. With two hundred and forty one responses from the top 1000 IT users in the country, the survey reported in this paper is one of the largest and most representative IT outsourcing studies in the world. Covariance structure modelling and confirmatory factor analysis has shed new light on the concept of outsourcing success, highlighting its complex, multidimensional nature. It has also confirmed many insights gained to date from qualitative research. Analysis also emphasises the importance to the outsourcing relationship of the management processes adopted by the client organization.
Mots Clés : Impartition, Australie, enquête, succès, services informatiques
Keywords: Outsourcing, Australia, survey research, success, information systems
*
Corresponding Author: Benoit A. Aubert, CIRANO, 2020 University Street, 25th floor, Montréal, Qc, Canada H3A 2A5 Tel.: (514) 985-4000 Fax: (514) 985-4039 email: aubertb@cirano.qc.ca
†
University of Melbourne
‡ Victoria University, Wellington, New Zealand § École des Hautes Études Commerciales and CIRANO
Introduction
IT outsourcing is often presented as an attractive business performance tool to improve productivity, reduce costs and increase competitiveness (Tettlebach, 2000). However, there is some evidence that outsourcing of IT is not achieving these expected outcomes. As business organizations become more global and adopt internet technologies as business process, many will obviously look at outsourcing those services. They will then be seeking up to date information on best practice in this area. This study was prompted by the need to understand the elements of success, and the relationship between these, so as to be able to test some hypotheses related to best practice.
Before such hypotheses can be tested, it is necessary to have a reliable and robust measure of success. Despite the decade of research into IT outsourcing, only one measure of success has been developed: Grover, Cheon and Teng’s (1996) 9 item outsourcing success (OS) instrument. Cheon developed this as part of his doctoral studies into IT outsourcing. Lee and Kim (1998) also used it in their study of Korean outsourcing.
A number of single item measures have also been used to measure success, generally global measures of cost savings, satisfaction, or of vendor performance (e.g. Lacity and Willcocks, 2000; Kern, 1999, Karpathiou and Tanner, 1995). There has been no analysis of the psychometric properties of the single measures, while the psychometric properties of the OS were only partly established in Grover, Cheon and Teng’s paper (1996). The OS scale was not subject to second generation statistical analysis (such as confirmatory factor analysis) so there is limited evidence for the unidimensionality of that scale. Furthermore, in that paper, the psychometric properties were reported for only part of the scale, raising the possibility that the full scale was not unidimensional. This means that its high reported reliability (Cronbach’s alpha of between .90 and .93) may reflect largely method variance, and hence be misleading.
The bulk of IT outsourcing research has involved case studies, which cannot generalize statistically. Of the few quantitative studies into IT outsourcing, many have been based on relatively simple counts of the proportions of respondents indicating that they obtained various benefits or outcomes from outsourcing their IT services. In those studies where any global measures were used, the outcomes were often summed, on the assumption that the more outcomes that are positive, the more successful outsourcing is (Willcocks and Fitzgerald, 1994;Lacity and Willcocks, 2000; Deloittes, 1997). The problem with this approach is that it takes no account of the fact that respondents may weigh outcomes in different ways. Just because, for example, a respondent indicates that they obtained access to some services they could not provide in house, does not mean that their organization is satisfied with the outsourcing arrangement. Nor is this an indicator of the extent to which the client would be likely to continue with the vendor in the future. This simple additive approach also ignores the fact that outsourcing is a fee for service arrangement, and so the overall evaluation is likely to be the result of a trade off between the service aspects, and the fee, or cost aspects. Using additive approach can be misleading in other ways. In a survey in the municipal sector, Aubert, Patry and Rivard (1999) found that while many cities encountered problems with their suppliers, they still intended to renew the contracts. This can either mean that it was too difficult to bring service provision back in house, or that these problems were deemed less important than the problems they would have encountered if they were relying on in-house provision.
The cost element is particularly important, as one of the major argument mounted for outsourcing by vendors is that, because of their increased managerial skills and greater
economies of scope and scale, they can reduce the cost of IT services to the client organization. Yet the Australian study (Seddon, Rouse, Reilly, Cullen and Willcocks, 2000) indicated that only 7% of respondents reported significant cost reductions from outsourcing, and only 42% reported any reductions at all. In a survey of large Canadian organizations, Aubert, Patry and Rivard (1999) reported that 49% of respondents experienced cost increases after outsourcing IT activities.
The various measures of outsourcing success included in the Seddon, et al study showed that the Australian responses to outsourcing were mixed. While fifty per cent of respondents indicated that they were satisfied with their arrangements, a third were dissatisfied. In attempting to understand why satisfaction was poor in many cases, the authors again came up against the need to develop a robust and reliable measure of IT outsourcing success. In developing a measure of outsourcing success, ideally what is needed is a mixture of measures of individual facets of outsourcing, and a global measure. This latter measure should capture the global evaluation by the client decision-makers who are involved in choosing whether to continue outsourcing, and whether to continue to remain with the current vendor.
The Seddon, et al (2000) study included both types of measures: simple outcomes and Likert-like evaluation items adapted from, and extending, the earlier OS scale. This provided an opportunity to examine the relationship between the two types of measures, and to develop a more comprehensive and reliable overall measure of outsourcing success. Consequently, the authors tested several alternative models using structural equation modelling (SEM, also known as covariance structure analysis). A number of models that might have been expected to be appropriate showed poor fit for the data. The model that did fit the data has some important implications for the relationship between vendor and client that are discussed in the paper.
The outsourcing success scale
Grover, Cheon and Teng (1996) developed their scale on the basis of their argument that the success of outsourcing involved three types of benefits: strategic, technical and economic. Those authors later included an additional dimension of overall satisfaction , although it is not clear why they excluded the measure of overall satisfaction from their report of the psychometric properties of their scale. Their final instrument was made up of the 9 items in Table 1.
Grover, Cheon and Teng’s (1996) arguments for these dimensions were developed largely from a technical/economic view of IT outsourcing. From this viewpoint, outsourcing is seen as a governance-choice issue – a variation of the ‘make or buy’ decision. This viewpoint concentrates on the capacity of outsourcing to deliver IT services more cheaply than can be done in-house. Lacity and Hirschheim (1993), emphasized that IT outsourcing is essentially a ‘fee for service’ arrangement. This sends a warning to some who tend to focus on price reduction while overlooking the quality of the services delivered. Any measure of success has to take both aspects into account. Lacity and Hirschheim insisted on the importance of complete contracts that articulated the service component clearly.
Table 1: Dimensions and Items from the Outsourcing Success Scale (adapted from Grover et al, 1996 pp 90-93)
Dimension of outsourcing success
Item
(strongly disagree, strongly agree, 7 anchors) Strategic benefits We have been able to refocus on core business
We have enhanced our IT competence
Technical benefits We have increased access to key information technologies We have reduced the risk of technological obsolescence Economic benefits We have enhanced economies of scale in human resources
We have increased access to skilled personnel
We have enhanced economies of scale in technological resources
We have increased control of IS expenses
Overall Satisfaction We are satisfied with our overall benefits from outsourcing
This ‘fee for service’ view is also implicit in the measures of success used by Willcocks and his colleagues (Willcocks and Fitzgerald,1994; Willcocks and Currie, 1996, Lacity and Willcocks, 2000). Their measures of success included a range of ‘service’ elements and a range of cost-related elements. A similar approach was used by Karpathou and Tanner (1995) and DeLoittes Consulting (1997).
The problem with measures like those listed is that they were largely based on a series of dichotomous items – whether respondents obtained [the outcome] or did not obtain [the outcome]. The measure of success used by Lacity and Willcocks (1998) in their meta analysis of outsourcing case studies was also a dichotomous judgement (made by the authors on the basis of extensive case analysis) as to whether cost savings were, or were not, experienced by the client. Using dichotomous items such as these does not lead to understanding about client trade offs, or even about the scope of the outcomes. A company saving 20% of its IT budget through an outsourcing deal while experiencing some quality downgrade might be very unsatisfied with the agreement.
Despite the fact that many surveys have implicitly considered outsourcing success in terms of service and cost reduction, neither cost nor service elements were measured directly in the Grover, Cheon and Teng OS scale. However, one of their economic measures was ‘control of expenses’ which is related to, but not the same as, cost reductions. Grover, Cheon and Teng considered service (in the form of a variation of the servqual measure) to be a determinant of success rather than an integral aspect or facet of success. They argued too, that relationship quality was a determinant, rather than element of outsourcing success. Grover, Cheon and Teng established that increased levels of outsourcing led to increased success measures only in certain circumstances, but argued that vendor service quality and elements of partnership were important for outsourcing success.
Methodology
To answer questions about IT outsourcing best practice, a self-administered survey of 241 Australian CIOs was carried out in 1999/2000. The sample (n = 1000) was highly representative of the largest 1600 organizations in Australia, having been developed from the update of an earlier complete census published by Strategic Marketing (1995). While a small
number of respondents (21%) had less than 500 employees, the survey largely represents medium and large organizations, i.e. those with 500 + employees. The response rate for the survey was 24%, which is highly satisfactory. This was an omnibus survey, involving one of the authors, a consulting company, and a number of other researchers (see Seddon, et al, 2000; Deloittes, 2000). The analyses reported here were carried out using AMOS 4 covariance structure analysis software, and the reliability and factor analysis procedures in SPSS 10.
In an attempt to tie together the two approaches to measuring outsourcing success, the authors hypothesized that outsourcing success would be a function of both service and cost reductions (H1). Inserted into the survey were two sets of measures of outsourcing success: a group of 4-anchor outcome measures, and a group of 7-anchor evaluation measures:
4- anchor measures of outsourcing outcomes: The set of outsourcing outcome measures
were similar to those used in the earlier surveys of Willcocks and Fitzgerald (1994), repeated by Willcocks and Currie (1996); Lacity and Willcocks (2000). These were worded so that comparisons could be made with earlier consulting surveys conducted by others in the team (Deloittes, 1995; 1997) - Examples are shown in Table 2 below. The dichotomous values used by Willcocks and Fitzgerald (1994 and later adaptations) and Deloittes (1997) were expanded to four anchors:
Worse No change Some improvement Significant improvement
7-anchor measures of outsourcing success: The second set of measures were based on the
Grover, Cheon and Teng (1996) instrument, with the addition of two further measures of overall satisfaction: satisfaction with vendor performance, and satisfaction with value for money in the arrangements. These items involved Likert scales adapted from the original OS measures, but using slightly different wording, e.g.‘Outsourcing IT has enhanced our organisation’s IT competence‘. Anchors were ‘strongly disagree’ and ‘strongly agree’.
Analyses
The initial intention had been to use confirmatory factor analysis (CFA) of both sets to establish the underlying structure, then to test H1. This was possible for those 7-anchor items related to the OS scale, where 194 respondents completed all items.The eighteen items meant that a sample size of 180 was required. However, there was a very high rate of missing values for the 4-anchor outcomes measures. This meant that if items with missing values were deleted, only 76 responses remained – too few to do confirmatory factor analysis. Therefore, different strategies were chosen to investigate the 4-anchor measures and the 7-anchor measures. They are presented in the two following sub-sections.
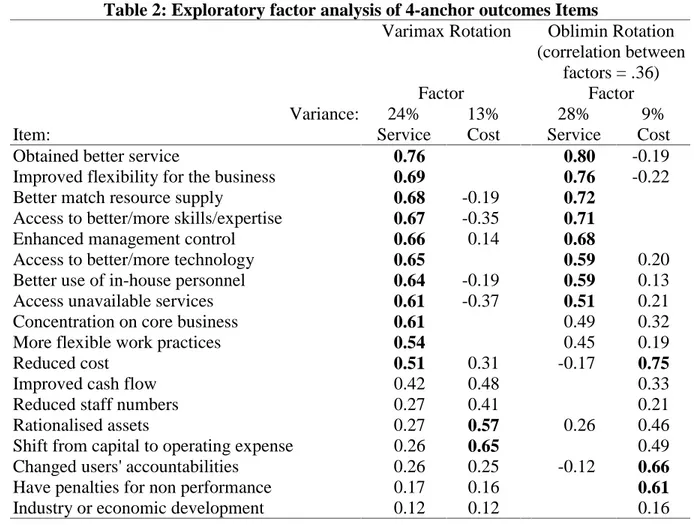
Measures of Cost Reduction and Service: Instead of CFA, exploratory factor analysis of
these 76 responses was done. The goodness of fit statistic suggested a 2 factor model, accounting for 37% of the variance, fit the data. The loadings suggested a service factor and a financial management factor, as had been expected. These are illustrated in Table 2 below, which reports both the orthogoal and the oblique rotations. For clarity, loadings of less that .10 have not been included in the table.
The large number of missing values in the financial management measure (up to 74 of those responding to the question) prevented the initial evaluation of success as a quality – price relationship. However, the single cost reduction item had a high response rate (n = 177). It was used as an indicator of the ‘fee’ aspect of the ‘fee for service’in order to pursue the analysis. But because this was a single item, no measure of reliability could be obtained.
The authors then subjected the items loading onto the service factor to one-factor congeneric modelling (OFCM), a form of confirmatory factor analysis, using AMOS 4’s maximum likelihood estimation routine. This modelling tested the unidimensionality of the service measure using the procedure suggested by Bagozzi (1981) and Rowe and Holmes-Smith (1994). After listwise deletion of missing values (leaving n = 146) the full data set was used on the basis that splitting the data would have resulted in too few cases for the number of items.
Table 2: Exploratory factor analysis of 4-anchor outcomes Items
Varimax Rotation Oblimin Rotation (correlation between
factors = .36)
Factor Factor
Variance: 24% 13% 28% 9%
Item: Service Cost Service Cost
Obtained better service 0.76 0.80 -0.19
Improved flexibility for the business 0.69 0.76 -0.22
Better match resource supply 0.68 -0.19 0.72
Access to better/more skills/expertise 0.67 -0.35 0.71
Enhanced management control 0.66 0.14 0.68
Access to better/more technology 0.65 0.59 0.20
Better use of in-house personnel 0.64 -0.19 0.59 0.13
Access unavailable services 0.61 -0.37 0.51 0.21
Concentration on core business 0.61 0.49 0.32
More flexible work practices 0.54 0.45 0.19
Reduced cost 0.51 0.31 -0.17 0.75
Improved cash flow 0.42 0.48 0.33
Reduced staff numbers 0.27 0.41 0.21
Rationalised assets 0.27 0.57 0.26 0.46
Shift from capital to operating expense 0.26 0.65 0.49
Changed users' accountabilities 0.26 0.25 -0.12 0.66
Have penalties for non performance 0.17 0.16 0.61
Industry or economic development 0.12 0.12 0.16
OFCM compared three alternative psychometric models: a parallel scores model, a tau-equivalent model, and a congeneric model. These models, which are discussed at length in Joreskog (1971) and Bagozzi (1980), are grounded in classical test theory. As a result of the OFCM, two items were deleted. The goodness of fit indicators for the three models were compared and indicated that the best fit was obtained by the parallel scores model ( χ2
= 17.98, df (9), p = .035; GFI = .94, AGFI = .93; RMSEA = .07, NFI= 91, TLI = .97). Despite the ordinal nature of the variables, the resulting six-item scale had a construct reliability (rho) of .86, a coefficient alpha of .82, and a variance accounted for of .5.
The items in the resulting service measure were: • Obtained better service
• Better match of resources to supply • Access to better/more skills/expertise • Access to better/more technology • Better use of in-house personnel
• Access to services unavailable in-house
Measure of Outsourcing Success: One factor congeneric modelling was then done on the
expanded OS measure (the 9 items adapted from the OS scale, plus the two additional satisfaction items described earlier). Only half the sample was used for the initial test (n = 98) allowing replication in the other half. As mentionned in Aubert, Rivard and Patry (1996), a ten to one respondent to item ratio (which would mean an n>110) is preferred for such analysis, but a less stringent ratio of five to one is often accepted. In this case, the nine to one ratio is slightly under the most stringent criterion but much higher than the five to one acceptable one.
This analysis indicated that a single latent trait did not fit the data in either the test or confirmatory samples (χ2 =
615.93, df (109), GFI = .72, AGFI = .66, NFI = .68, TLI =.72). A check of the model underlying the original Grover et al instrument (without the two extra satisfaction items) indicated that the single factor posited by those authors did not fit the data either (χ2
=155.53, df (36) p = 0.00, GFI =.84, AGFI =74, TLI= .78).
The original OS model, reported in Grover et al (1996), had not included the satisfaction item in the discussion of psychometric properties. Consequently, an alternative two-factor model was tested. In this model, the OS was made up of two correlated factors, an overall success measure comprising 3 items, and another factor comprising the other success measures. This too did not fit the data (χ2
= 115.59, df (44) p = 0.00, GFI = .82, AGFI = .73 NFI = .78, TLI = .81). It was clear from this analysis that the OS measure involved more than two dimensions, indicating that outsourcing success was more complex than had, to date, been envisaged. The original hypothesis, H1, could not be pursued, because of the lack of unidimensionality in the hypothesized outsourcing success dependent variable.
Creating a Richer Measure of Outsourcing Success
Since the OS measure was neither unidimensional, nor bidimensional, exploratory factor analysis was used to gather data about the underlying structure of the 7-anchor elements. This revealed that the factor structure, shown below, roughly mirrored the dimensions argued for by Grover, Cheon and Teng (1994). Both a VARIMAX orthogonal and an OBLIMIN oblique rotation were undertaken. The oblique solution is reported in Table 3 below, as it had fewer cross loadings. For clarity, loadings of less that .10 have not been included in the table.
Interpreting the items loading on these five factors, the authors assigned the labels used in the second row of the table. Three of the factors (#2 ‘technology benefits’,#5 ‘strategic benefits of outsourcing’ and #4 ‘economies of scale’) corresponded to the original dimensions of technical, strategic and economic benefits suggested by Grover, Cheon and Teng (1994). However, the loading on these factors are different from those hypothesized in Grover, Cheon and Teng (1996). These authors saw both control of expenses and access to skilled personnel as economic benefits. The factor loadings above suggest that control of expenses has more in common with the items described by Grover et al as strategic benefits.
Table: 3 Pattern matrix for exploratory factor analysis of 7-anchor evaluation items (n=196) Factor: 1 2 3 4 5 Factor labels Items: Satisfaction with outsourcing Technology benefits Skilled personnel Economies of scale Strategic benefits of outsourcing Vendor performance 0.908 -0.132
Overall satisfaction with
outsourcing 0.817 0.160
Value for money 0.795 0.126 0.128
Avoidance of technological
obsolescence 0.983
Access to key information
technologies 0.508 -0.160 0.217
Access to skilled personnel 0.114 0.168 -0.776 0.129 0.142
HR economies of scale 0.934
Technical economies of scale 0.129 0.542
IT competence -0.140 0.778
Capacity to refocus on cure
business 0.121 0.135 0.571
Control of IT expenses 0.177 0.160 0.310 0.107 0.393
A fourth factor (#1 ‘satisfaction with outsourcing’) corresponded to the hypothesized outsourcing satisfaction factor discussed earlier. The fifth factor (#3 ‘skilled personnel’) had only one item loading heavily onto it: access to skilled personnel, which Grover et al (1994) had suggested was one of the economic benefits of outsourcing.
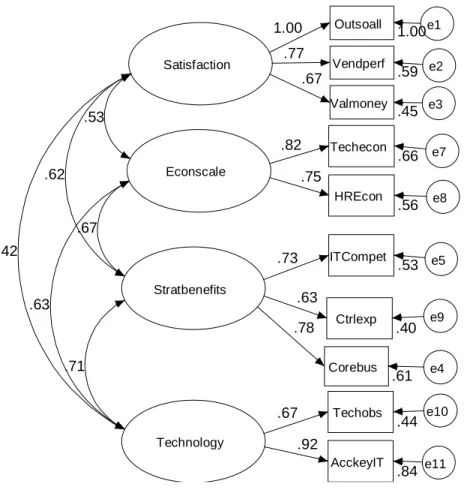
The model, shown in Figure 1 below, is drawn from the EFA, and the earlier arguments of Grover, Cheon and Teng (1996). The parameters are based on the results of the CFA. To arrive at this model it was necessary to exclude the item: access to skilled personnel, which did not fit with the rest of the measures. This model was a good fit for the data suggesting the original theoretical dimensions posited by Grover et al in their earlier paper were distinct aspects of outsourcing success. The goodness of fit indicators for this four-factor model are illustrated in Table 4.
The χ2
difference test indicated that a single factor model was rejected in favor of this model (∆χ2= 149.68, ∆df (44), p >.001), as did a bootstrap procedure using the Akaike information
criterion. This suggests discriminant validity of the four facets, as does the correlations between factors, which are all lower than .85.
Table 4: Fit measures for four factor model (exploratory sample)
χ2 Df p χ2/
df GFI AGFI NFI TLI RMSEA
45.31 31 0.047 1.46 0.91 0.85 0.91 0.95 0.07
When the resulting model was administered to the confirmatory sample, it was not expected to fit equally well. While this was the case, the fit indicators (χ2
= 57.60 df (30) p = .002, GFI = .90 AGFI .81, NFI = .90, TLI = . 92, RMSEA = .09) still suggested the model was a reasonable fit, despite the significant χ2
. The factor loadings in the confirmatory sample were similar to those in the initial sample. Overall these results imply that the CFA model would generalize acceptably to other samples.
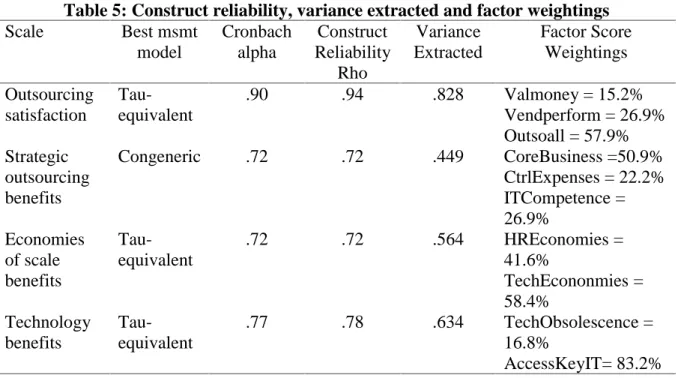
The CFA modelling did not provide information about the relationship between the elements, and, in particular, did not establish whether there were causal links between the correlated latent traits. Nor did it determine which measurement models fit best for the individual factors (latent traits). To establish the most reliable measurement model, and to confirm the unidimensionality, reliability and validity of the individual scales one factor congeneric modeling was again carried out. The following table summarises the results of this analysis.
Table 5: Construct reliability, variance extracted and factor weightings
Scale Best msmt model Cronbach alpha Construct Reliability Rho Variance Extracted Factor Score Weightings Outsourcing satisfaction Tau-equivalent .90 .94 .828 Valmoney = 15.2% Vendperform = 26.9% Outsoall = 57.9% Strategic outsourcing benefits Congeneric .72 .72 .449 CoreBusiness =50.9% CtrlExpenses = 22.2% ITCompetence = 26.9% Economies of scale benefits Tau-equivalent .72 .72 .564 HREconomies = 41.6% TechEcononmies = 58.4% Technology benefits Tau-equivalent .77 .78 .634 TechObsolescence = 16.8% AccessKeyIT= 83.2%
Structural Model Relating the Various Facets of Success
The original aim of the research was to demonstrate that outsourcing success was a function of both service quality and cost. Since CFA had determined that outsourcing success is a construct more complex than anticipated, the original goal of the research had to be adapted. In particular, since the various components of success are not independent, it was important to test whether there was likely to be a causal relationship between earlier, or antecedent facets of outsourcing success (such as access to skilled personnel, or technology benefits) and other, later facets of success such as global satisfaction. A two step process was used, as
recommended by Kline (1998), Anderson and Gerbing (1988), and Rowe and Smith-Holmes (1994). The parameters determined by the CFA and OFCG (i.e. the measurement model) were input into a second, structural model. The relationship and service quality literature suggests that a measure of overall satisfaction is a good indicator of overall relationship success, and of likely intention to continue in the relationship (Anderson and Sullivan, 1993; Rust and Zahorik, 1993). The other aspects of outsourcing success identified in the earlier CFA were treated as predictor variables in relation to this global satisfaction measure, on the assumption that increased benefits would lead to increased satisfaction.
On the basis of the latent traits identified in the measurement model, and the theory underlying earlier measures of success, it was hypothesized that outsourcing satisfaction would be a function of service, cost reduction and strategic benefits (H2). It was also
hypothesized that service would be a function of the availability of skilled personnel, and of technology benefits (access to key technologies, and avoiding technological obsolescence) (H3). These are important to the quality of service that the vendor can supply to the client,
and are often argued for in practitioners‘ literature.
Finally it was hypothesized that Strategic benefits (related to core competencies, cost control and technical competence) would be a function of access to skilled personnel, technology
benefits, economies of scale, and cost reduction (H4). These hypotheses, together with some
other plausible paths added for completeness (eg access to personnel → satisfaction, and technology benefits → satisfaction (H5)) were incorporated into an initial structural model.
When the resulting model was examined using AMOS, the fit was not particularly good (χ2
= 21.15 df(5), p = 0,001, AGFI= .76, TLI = .80, RMSEA = .15), and a number of the ‘plausible‘ and hypothesised relationships were not statistically significant at the .05 level, namely:
H1 Cost reduction → Satisfaction H4 Access to personnel → Strategic benefits H5 Technology benefits → Satisfaction H5 Access to personnel → Satisfaction
Revised structural model
As well as being a relatively poor fit for the data, the initial structural model (not shown) lacked parsimony, so a strategy of reducing the number of paths was initiated: A revised model omitting the non statistically significant paths was developed. Since it was implausible that cost reduction would have no impact at all on satisfaction, it was hypothesized that cost reduction would be a predictor for both service and strategic benefits (H6),and would
therefore influence satisfaction indirectly. The outsourcing literature (in, for example, Lacity and Willcocks, 1998 ) argues that the vendor’s economies scale, and management capacity can lead to both cost reduction and better service. Thus cost reduction would be seen, in this second model, as an enabler for strategic value.
The second model (not shown) was a significant improvement on the initial hypothesised model (∆χ2
= 16.685∆df (2), p > .001) but the fit indicators (χ2 = 4.467 df (7), p =.725, NFI = .99, TLI = 1.022, RMSEA = 0.00) suggested the data was now overfitted. Since the path between economies of scale and satisfaction ( p = .043) was statistically significant only at the .05 level, this path was set to zero, resulting in a model which did fit the data well and
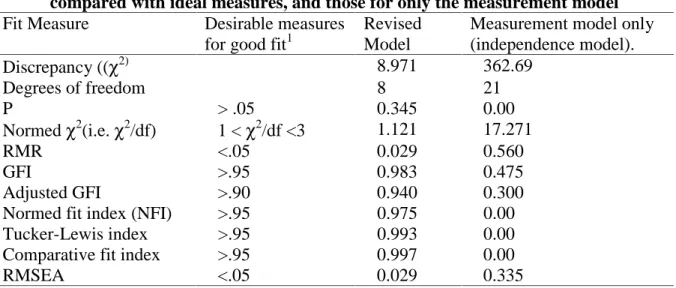
was not overfitted. This revised model is shown in Figure 2. The goodness of fit indicators are shown in Table 6, below.
Table 6: Fit measures for the structural equation shown in Figure 2 (Revised Model ), compared with ideal measures, and those for only the measurement model
Fit Measure Desirable measures for good fit1
Revised Model
Measurement model only (independence model). Discrepancy ((χ2) 8.971 362.69 Degrees of freedom 8 21 P > .05 0.345 0.00 Normed χ2(i.e. χ2 /df) 1 < χ2/df <3 1.121 17.271 RMR <.05 0.029 0.560 GFI >.95 0.983 0.475 Adjusted GFI >.90 0.940 0.300
Normed fit index (NFI) >.95 0.975 0.00
Tucker-Lewis index >.95 0.993 0.00
Comparative fit index >.95 0.997 0.00
RMSEA <.05 0.029 0.335
The model shown in Figure 2 had an R2 of .67, indicating that these six variables predict 67% of the variance in outsourcing satisfaction, a reassuringly high proportion. The total effects (direct plus indirect) of the various outsourcing benefits on global satisfaction are shown in Table 7: This illustrates that the greatest effect on satisfaction is from strategic benefits, followed by service. The other outsourcing benefits each has approximately the same total effect, with access to skilled personnel having the least effect on satisfaction when the other predictors are taken into account.
INSERT FIGURE 2 SOMEWHERE AROUND HERE
Table 7: SEM estimates of standardized total effects
(read as row variable effect on column variable)
-Strategic benefits Service Outsourcing satisfaction
Strategic benefits 0.585
Service 0.377
Cost reductions 0.163 0.402 0.247
Technology benefits 0.431 0.252
Economies of scale 0.411 0.240
Access skilled personnel 0.571 0.215
Discussion
To summarise the hypothesis testing: H2 was partially confirmed, as there was no significant
direct path between cost reduction and outsourcing satisfaction, although the other two predictors (service and strategic benefits) had path coefficients significant at the .01 level. H3,
too, was partially confirmed, in that there was a statistically significant path from access to
skilled personnel to service, but not from technological benefits to service. H4 was partially
confirmed: there was no significant path between access to skilled personnel and strategic
benefits, but the other hypothesized paths were statistically significant. H5 was rejected,
indicating that that though plausible, there was no direct relationship betwen either access to
skilled personnel, nor technology benefits and outsourcing satisfaction. H6 was confirmed:
cost reduction was a predictor for both service and strategic benefits. These findings are reflected in the model shown in Figure 2.
The study has established that outsourcing satisfaction is a function of both service and, indirectly, cost reduction, in addition to those items in the original OS instrument developed by Grover, Cheon and Teng (1996). All of the OS benefits identified by Grover et al (1996) contribute significantly, if in some cases, indirectly, to outsourcing satisfaction, although the most important of these is strategic benefits. The study has also confirmed the usefulness of a short, global measure of IT outsourcing satisfaction, while suggesting caution for managers focusing too much on cost reduction when assessing outsourcing. But beyond that, the analysis has shed some light on the causal relationships between facets of outsourcing success.
From the analysis, it appears that the influence of cost reduction on overall satisfaction is an indirect one, mediated by both the service provided by the vendor, and by the client’s own capacity to realize the strategic benefits outsourcing may bring. This is encouraging, as much of the IT outsourcing research to date has emphasized the cost reduction aspects of outsourcing (e.g. Lacity and Willcocks, 1998), whereas this is only one aspect of the value provided to clients, and of the ultimate realization of the strategic benefits of outsourcing. The analysis has highlighted that outsourcing success is a more complex, and more multi-faceted construct than had been presented before. Furthermore, the model above shows that the relationship between facets of outsourcing success is not necessarily simple. The significant, positive regression path between cost reduction and service confirms that cost savings are an important aspect of the value proposition expected by clients. Clients expect both service and cost savings. This is almost certainly in part a response to the promises made by vendors and outsourcing proponents. Similarly clients perceive access to skills and expertise to be a part of the vendor’s value proposition, as evidenced by the loading of this item on the service latent trait. This is also consistent with the many claims that this is one of the benefits of using external vendors. But the analysis reveals that access to skilled personnel, on its own, does not lead directly to increased satisfaction, instead the relationship is mediated by the service provided by the vendor. This is apparently why deleting the access to skilled personnel item improved the fit of the original four-factor model of outsourcing success. In the Australian study, 70% reported getting this outcome from IT outsourcing, but at the same time reporting much lower levels of satisfaction. This model helps explain why this could occur.
The statistically significant path between strategic benefits and outsourcing success has some important implications for vendors. It implies that it is not enough for vendors to provide excellent service to clients. Client satisfaction will also be, in large part, a reaction to the extent to which this service can be turned into organizational consequences such as control of
costs, capacity to concentrate on the organization’s core competencies, and capacity to create IT solutions that meet organizational goals. These are, in the main, dependant on the client’s own capabilities to manage benefit realization, yet the vendor may need to assist the client to acquire this capability.
From the client’s point of view, the study emphasises the critical role of benefits realization, which is largely up to them. The client intent on maximising the success of outsourcing will need to pay careful attention to this aspect, as it is the most important of the benefits in relation to achieving satisfactory outcomes. The study also validates the advice given by both Lacity and Hirschheim (1993, 1995) and Willcocks and his colleagues on the basis of their case studies. It is critical that clients actively manage the outsourcing arrangement, invest in careful analysis of their needs, and communicate effectively with both the vendor and internal clients. If this is not done, the outsourcing arrangement is likely to be a disappointing one. Finally, one note of caution: Ideally the structural model presented here would have been developed on a sub sample and retested on the remaining data set. Unfortunately the sample size prevented this strategy. Further study should consequently validate the relationships uncovered in this study.
References
ANDERSON, JAMES C. and GERBING, DAVID W. (1988) Structural equation modeling in practice: A review and recommended two-step approach. Psychological Bulletin. 103(3):411-423.
AUBERT, BENOIT A.; RIVARD, SUZANNE, and PATRY, MICHEL (1996). Development of measures to assess dimensions of IS operation transactions. Omega, International Journal of Management Science. 24(6 ):661-680.
--- (1999a). Chapter 3.3: Impartition des services informatiques au Canada: Une comparaison 1993-1997. in: MICHEL POITEVIN, editor. Impartition Fondements et analyse. Montreal: Canada: Presses de l’universite Laval, pp. 203-220.
--- (1999b) Chapter 3.6: Impartition des services municipaux au Canada: Un bilan. in: MICHEL POITEVIN, editor. Impartition Fondements et analyse. Montreal: Canada: Presses de l’universite Laval ; pp. 265-282.
BAGOZZI, RICHARD P. (1980) Causal models in marketing. New York: John Wiley and Sons.
DELOITTE CONSULTING (2000). Report 2000 on Information Technology Outsourcing Practices in Australia. Melbourne: Australia: Deloitte, Touche, Tohmatsu.
DELOITTE CONSULTING GROUP (1997). Information technology outsourcing: A Comprehensive Analysis of IT Outsourcing in Australia. Melbourne: DeLoitte, Touche Tomahtsu.
GROVER, VARUN; CHEON, MYUN JOONG, and TENG, JAMES T. C.(1996). The effect of service quality and partnership on the outsourcing of information systems functions. Journal of Management Information Systems. Spring; 12(4):89-116.
HOLMES-SMITH, PHILIP and ROWE, KENNETH J.(1994). The development and use of congeneric models in school effectiveness research:Improving the reliability of composite and latent variavles for fitting multilevel and structural equation models. Paper presented in. Proceedings of the 1994 International Congress for School Effectiveness and Improvement; Melbourne. Victoria, Australia.
JORESKOG, KARL G. (1971). Statistical analysis of sets of congeneric tests. Psychometrika. 443-447.
KARPATHIOU, VASSILI and TANNER, KERRY.(1995). Information Technology Outsourcing in Australia: Final Report of the 1993/1994 RMIT Survey. Melbourne: RMIT University Department of Business Computing.
KLINE, REX B.(1998). Principles and practice of structural equation modeling. New York: Guilford Press.
KERN, THOMAS.(1999). Relationships in IT outsourcing: An exploratory research study of a conceptual framework. Unpublished doctoral thesis.Oxford University, UK: Oxford. LACITY, MARY C. and HIRSCHHEIM, RUDY.(1993). Information systems
outsourcing:Myths, metaphors and realities. Chichester, England: Wiley.
LACITY, MARY C. and WILLCOCKS, LESLIE.(1998). An empirical investigation of information technology sourcing practices: Lessons from experience. MIS Quarterly.(Sept) 363-392.
LACITY, MARY C. and WILLCOCKS, LESLIE P. (2000). Inside information technology outsourcing: A state-of-the-art report. Oxford, UK: Templeton College.
LEE, JAE-NAM and KIM, YOUNG-GUL. (1999) Effect of partnership quality on IS outsourcing: Conceptual framework and empirical valudation. Journal of Management Information Systems. 15(4 Spring):29-61.
SCHUMAKER, R. E. and LOMAX, R. G. (1996). A beginner’s guide to structural equation modelling. Hillsdale: NJ: Erlbaum.
SEDDON, PETER; ROUSE, ANNE; REILLY, COLIN; CULLEN, SARA, and WILLCOCKS, LESLIE. (2000). Report on IT sourcing practices in Australia, Part 1:April 2000. Melbourne: Australia: Department of Information Systems: University of Melbourne..
STRATEGIC PUBLISHING GROUP. (1995). MIS 3001: A survey of the largest computer using organisations in Australia and New Zealand. Sydney, Australia: Strategc Publishing Group.
TETTELBACH, B. (2000). CIO Update: How Measurement Can Help in Evaluations of IT Outsourcing.Gartner Group IGG-05032000-04, 3 May 2000.
WILLCOCKS, LESLIE and LACITY, MARY C. (1998). Strategic sourcing of information systems. Chichester, UK: Wiley.
WILLCOCKS, LESLIE and CURRIE, WENDY L. (1996). Information technology in public services: Towards the contractual organization? OXIIM Working Paper RDP 96/2. Templeton College, Oxford: Oxford University.
WILLCOCKS, LESLIE and FITZGERALD, GUY. (1994). A business guide to information technology outsourcing. London: Business Intelligence.
Satisfaction 1.00 Outsoall e1 1.00 .59 Vendperf e2 .77 .45 Valmoney e3 .67 Stratbenefits .53 ITCompet .73 .40 Ctrlexp .63 .44 Techobs .84 AcckeyIT Technology .92 .67 .61 Corebus Econscale .66 Techecon .56 HREcon .82 .75 .62 .42 .53 .71 .67 .63 .78 e7 e8 e5 e9 e4 e10 e11
Figure 1: Four factor model CFA – fitted to exploratory sample
tech serv satn strat costr staff econ .57 .40 .43 .40 .16 .58 .38 ns .54 .23 .27 .50 .55
Liste des publications au CIRANO *
Cahiers CIRANO / CIRANO Papers (ISSN 1198-8169)
99c-1 Les Expos, l'OSM, les universités, les hôpitaux : Le coût d'un déficit de 400 000 emplois au Québec — Expos, Montréal Symphony Orchestra, Universities, Hospitals: The Cost of a 400,000-Job Shortfall in Québec / Marcel Boyer
96c-1 Peut-on créer des emplois en réglementant le temps de travail? / Robert Lacroix 95c-2 Anomalies de marché et sélection des titres au Canada / Richard Guay, Jean-François
L'Her et Jean-Marc Suret
95c-1 La réglementation incitative / Marcel Boyer
94c-3 L'importance relative des gouvernements : causes, conséquences et organisations alternative / Claude Montmarquette
94c-2 Commercial Bankruptcy and Financial Reorganization in Canada / Jocelyn Martel 94c-1 Faire ou faire faire : La perspective de l'économie des organisations / Michel Patry
Série Scientifique / Scientific Series (ISSN 1198-8177)
2001s-18 Perspectives on IT Outsourcing Success: Covariance Structure Modelling of a Survey of Outsourcing in Australia / Anne C. Rouse, Brian Corbitt et Benoit A. Aubert
2001s-17 A Theory of Environmental Risk Disclosure / Bernard Sinclair-Desgagné et Estelle Gozlan
2001s-16 Marriage Market, Divorce Legislation and Household Labor Supply / Pierre-André Chiappori, Bernard Fortin et Guy Lacroix
2001s-15 Properties of Estimates of Daily GARCH Parameters Based on Intra-Day Observations / John W. Galbraith et Victoria Zinde-Walsh
2001s-14 A Ricardian Model of the Tragedy of the Commons / Pierre Lasserre et Antoine Soubeyran
2001s-13 Carbon Credits for Forests and Forest Products / Robert D. Cairns et Pierre Lasserre
2001s-12 Estimating Nonseparable Preference Specifications for Asset Market Participants / Kris Jacobs
2001s-11 Autoregression-Based Estimators for ARFIMA Models / John W. Galbraith et Victoria Zinde-Walsh
2001s-10 Heterogeneous Returns to Human Capital and Dynamic Self-Selection / Christian Belzil et Jörgen Hansen
* Vous pouvez consulter la liste complète des publications du CIRANO et les publications elles-mêmes sur notre site Internet à l'adresse suivante :