Lichen-Spruce Woodland Early Indicators of Ecological
Resilience Following Silvicultural Disturbances in
Québec’s Closed-Crown Forest Zone
Esteban Gonzalez1, François Hébert2*, Jean-François Boucher1, Pascal Sirois1, Daniel Lord1
1Département des Sciences Fondamentales, Université du Québec à Chicoutimi, Saguenay, Canada; 2Direction de la Recherche
Forestière, Ministère des Ressources Naturelles, Québec, Canada.
Email: esteban.gonzalez@uqac.ca,Jean-Francois_Boucher@uqac.ca,Pascal_Sirois@uqac.ca,Daniel_Lord@uqac.ca,
*francois.hebert@mrn.gouv.qc.ca
Received January 6th, 2013; revised February 18th, 2013; accepted February 24th, 2013
ABSTRACT
Lichen woodlands (LW) located in the closed-crown boreal forest are not a successional stage moving towards a closed black spruce feathermoss stand (FM), but an alternative stable state, due to their previous forest history, and the occur- rence of LWs located nearby closed-crown FM stands. Therefore, afforestation in those LWs through site preparation and plantation could shift back LW into FM stands. We implemented an experimental design with different combina- tions of silvicultural treatments in both site types (LW, FM). We monitored the evolution of plant diversity and the physiology of three bio-indicators (Picea mariana, Kalmia angustifolia, Rhododendron groenlandicum) in different microsites created by the silvicultural treatments. The return to the initial composition was noticed only two years after treatments, especially in the LW stands, thus indicating a higher level of early ecosystem resilience in LWs compared to FM stands. Mean species cover, especially in the FM stands, decreased the most in the skid trails created by logging, probably due to a lack of acclimation of bryophytes to open stand conditions. Conversely, ericaceous shrubs and lichens found in the LWs were already acclimated to open stand conditions, which give to LWs a restructuring advantage com- pared to FM plant communities after silvicultural treatments. Overall, FM and LW short-term resilience was similar, indicating equally efficient ecosystem reorganization in both stands. The comparable early resilience in managed LW and FM stands, in terms of plant biodiversity, contradicts the presumed fragility of LW stands, especially in this case where LWs are assumed to be an alternative stable state created by compound disturbances. Silvicultural treatments maintained the functional group diversity in LWs, a key element for ecosystem resilience. Therefore, this study support the idea that plantation following site preparation in LWs could be a valuable management strategy to reach several objectives, such as increasing forest carbon sinks.
Keywords: Afforestation; Black Spruce; Kalmia angustifolia; Rhododendron groenlandicum; Logging; Picea mariana;
Vegetation Recovery; Scarification; Silviculture
1. Introduction
Historically, the resilience of ecosystems mainly drew the attention of theoretical ecologists [1]. However, as stressors like forest management and climate change have become increasingly recognized as potential threats to biodiversity, the interest of forest ecologists and man- agers in ecosystem resilience is now growing substan- tially [2]. The traditional concept of resilience refers to the stability of an ecosystem near its equilibrium steady-state and its capacity to return to this steady-state following disturbance. This view of resilience is termed engineering resilience [3] and is only theoretically rele-
vant in disturbance-driven ecosystems where the “equi- librium state” is rarely reached [4-6]. A more contempo- rary definition of resilience, ecological resilience, refers to the amount of disturbance that an ecosystem can en- dure before it modifies its organizing processes and re- structures to an alternative state [1,6-7].
An alternative stable state is an ecosystem that can persist (i.e., pass through one or several turnovers) under the same environmental and climatic conditions as an- other different ecosystem type, and is generally charac- terized by system state variables like species diversity, abundance, and composition. The shift to an alternative stable state occurs if a threshold limit of the biotic mechanisms ensuring ecosystem resilience is exceeded
by the severity and/or frequency of disturbances [5,6]. Fire is involved in many cases of alternative stable states in various vegetation systems around the world [5]. In the boreal forest, studies showed evidence of the phe- nomenon where fire is the main disturbing event [4,6].
Black spruce (Picea mariana [Mill.] B.S.P.) feather- moss (FM) stands are common in the closed-crown forest zone of the North American boreal forest, which extends from Alaska to Newfoundland [4,8]. Successful black spruce regeneration after wildfire, the main stand-re- placement driver of those stands, depends on seed bank quality (seed number and viability) and fire severity [9,10]. However, regeneration may be unsuccessful in the following circumstances: a spruce budworm (Cho-
ristoneura fumiferana [Clem.]) outbreak shortly followed
by a wildfire, or two back to back fire events, therefore compromising post fire seed production-related regen- eration, and favouring competing vegetation encroach- ment by ericaceous shrubs and lichens [11-13]. This leads to the formation of an open lichen-spruce wood- lands (LWs) scattered within the closed-crown forest zone [4]. Between 1950 and 2002, a 9% increase in LWs has been documented in Eastern Canada [10].
It has been concluded that LWs, within the close- crown boreal forest, are not a successional stage moving towards a closed FM forest, but rather an alternative sta- ble state, because of their previous moss forest history, and the occurrence of adjacent LWs and closed-crown FM stands [4,6]. A natural shift from LW to a closed-crown FM forest is theoretically possible with a sufficient and healthy seed bank, and a wildfire intense enough to remove the lichen mat [14]. However, histori- cal records have so far failed to demonstrate this possi- bility [6].
Silviculture could promote LWs shift to closed-crown FM stands, in particular where past presence of the latter is demonstrated or where biophysical conditions to this forest conversion are assembled [15]. This human-in- duced conversion of open to closed-crown stands can help realize at least two goals: restore the historical tree density in the boreal forest zone [4,6,10,16], and contrib- ute to climate change mitigation through the afforestation of non-forest areas [17-19]. Afforestation efforts in the boreal zone, where manageable open woodlands such as LWs are theoretically abundant in both North America and Russia [19,20], could represent an eventual signifi- cant mitigation measures, especially because land use change in boreal territories generates very few conflicts with other human activities, thanks to the uninhabi- ted—and unsuitable for cultivation—nature of the boreal forest [17,19]. However, very few field validations of the support capacity of LWs (and boreal open woodlands in general) to afforestation presently exist, so that this theo-
retical mitigation potential can get closer to a field-sup- ported feasibility.
Actually, information is scarce about the effects of logging or site preparation practices on LWs productivity and resilience. Hébert et al. [21] showed that scarifica- tion improved water relations and growth of black spruce and jack pine (Pinus banksiana Lamb.) planted seedlings, during the establishment phase, close to levels encoun- tered in seedlings planted on FM stands with a higher intensity of site disturbance (logging + scarification). However, the effect of different intensities of silvicul- tural disturbances on stand ecological resilience still needs to be addressed to assess the capacity of LWs to support afforestation. Biodiversity can enhance ecosys- tem resilience, and ecosystem shifts are common where human actions are eroding biological diversity [22]. In many habitats, understory vegetation comprises the vast majority of plant biodiversity and contributes to a wide variety of ecosystem functions [23]. Silviculture affects biodiversity through changes of species composition and abundance, which in turn modifies plant biodiversity [24]. Silviculture also influences species physiology, which can be used as a plant productivity indicator [21,25,26]. Therefore, one could use both plant biodiversity, through measurement of vegetation recovery, and productivity of key species, through measurement of plant traits, to compare the ecological resilience of contrasting ecosys- tems after disturbance, such as LWs and FM stands after silvicultural treatments [21].
The objectives of this study were therefore (1) to test and compare the effect of various levels of silvicultural treatments on plant biodiversity and physiology of key species in afforested LWs and reforested closed crown FM stands, two co-existing but contrasting stand types and, (2) to assess and compare the effect of silvicultural treatment intensity on plant biodiversity and physiology of key species in afforested LWs and reforested closed-crown FM stands. A field-based experimental design was implemented with different combinations of silvicultural treatments (logging and scarification) in each site type. We then monitored the evolution of plant diversity and the physiology of three bioindicators (Picea
mariana, Kalmia angustifolia, Rhododendron groen- landicum) in different microsites created by the silvicul-
tural treatments, during the establishment phase.
2. Material and Methods
2.1. Site Description
A total of six experimental sites were established in the northeastern North American boreal forest. Four sites were located at the border between the balsam fir/white birch (South) and black spruce/feathermoss (North) bio-
climatic domains (49˚42'579''N, 71˚20'512''W), and two in the spruce/feathermoss domain (50˚17'822''N, 72˚02'664''W) [27]. Mean annual temperature for this region between 1971-2000 was 0˚C (± 1.3) with a mean annual precipita- tion of 961.3 mm (33% as snow) [28]. Soils were humo-ferric podzols (Humods Spodosols) located on a coarse till glacial deposit (>1 m), with a mor humus (depth between 5 and 33 cm), and sandy loam texture (<1 m), except for one site that was established on a flu- vioglacial outwash.
Each site included a lichen-spruce open woodland stand (LW) adjacent to a closed crown black spruce- feathermoss stand (FM), both with similar slope, aspect, soil drainage, tree dominant height, and age since fire (between 70 - 90 years). The LW had a crown cover of less than 25% and FM crown cover was between 60% and 80%. For each stand type, the overstory was domi- nated by black spruce (BS), associated with jack pine, white birch (Betula papyrifera Marsh.), and trembling aspen (Populus tremuloides Michx.). The understory included ericaceous shrubs like Kalmia angustifolia L. (KA), Rhododendron groenlandicum (Oeder) Kron & Judd (RG), Vaccinium angustifolium Ait., Vaccinium
myrtilloides Michx., and Gaultheria hispidula L. Mühl.
[21].
2.2. Experimental Design
The experimental design was a six-block factorial, each of the six sites corresponding to one experimental block (statistical replication). Each experimental block in- cluded a 2 ha LW stand adjacent to a 2 ha FM stand. The stands were logged and scarified in summer 2005. Care- ful logging around advance growth (CLAAG) was used as the harvesting method [26]. In every block, a supple- mentary 1 ha strip of each stand type was kept free of any silvicultural treatment to serve as a control. Every harvested stand (main plot) was then divided randomly in two sub-plots of 1.2 and 0.8 ha. The 0.8 ha sub-plot was scarified with a hydraulic TTS disk scarifier.
Five microsite types were classified on the basis of site disturbance intensity induced by silvicultural treatments. The microsite categories were (from the lowest to highest level of disturbance): non perturbed (NP), logging strips in the non-scarified plots (S0LS), skid trails in the non- scarified plots (S0ST), non-disturbed strips in the scarified plots (S1NS), and scarification furrows (S1SF). Three 4 m2 sampling plots were randomly assigned to each microsite type, for a total of 30 sampling plots per experimental block. One set of measurements was made before silvi- cultural treatments for every stand type (LW, FM) × treatment (NP, S0, S1) combination, using three repre- sentative 4 m2 sampling plots per pre-identified combi-
nation area.
For vegetation cover and biodiversity indexes, stand type (LW or FM) was considered as the main plot, mi- crosites in the silvicultural treatments as the sub-plot, and sampling time as the sub sub-plot. Due to a limited daily time frame available for physiological measurements, the main plot was the sampling time with stand type as the sub-plot and silvicultural treatments as the sub sub-plot. 2.3. Vegetation Cover and Diversity
Measurements
An exhaustive vegetation inventory was performed in each 4 m2 sampling plot for the shrub (height < 1 m), herbaceous, and moss layers. After adequate species iden- tification, % cover of each taxon was evaluated visually. Vegetation cover was monitored during four measure- ment periods: just before silvicultural treatments in 2005 (day 0), after silvicultural treatments in 2005 (day 110), 2006 (day 501), and 2007 (day 801)—the term “day” used hereinafter corresponds to the average day of each measurement period. The vegetation surveys were per- formed by the same observer within each individual ex- perimental block. Taxa count and abundance served for biodiversity index calculations. Selected indexes were: total vegetation cover (N in %), species richness (S), Pielou’s index of non-randomness (J’), and the Shan- non-Wiener diversity index (H’) [29].
2.4. Physiological Measurements
Black spruce (BS), Kalmia (KA), and Rhododendron (RG) were chosen as bio-indicators of plant resilience in re- sponse to disturbance from silvicultural practices. Net photosynthesis (A) was measured on current year needles of an excised shoot of one black spruce layer (<1 m in height), and on current foliage of one excised Kalmia stem selected randomly in each experimental unit (S0, S1 and NP). A was measured on day 0, 110, 501, and 801. Excised shoots were placed in a sealed bag containing a wet sponge, and maintained in ambient light before measurements within 15 min following excision. Data were collected on sunny or partly cloudy days. Meas- urements were carried out with a LI-6400 portable pho- tosynthesis system (LI-COR, Inc. Lincoln, NE, USA) equipped with a 0.25 L conifer chamber cuvette. A halo- gen lamp was placed at 30 cm above the cuvette to pro- vide saturating light conditions when necessary (>1200 µmol photons m−2·s−1). Ambient CO
2 was fixed at 400 ppm and the block temperature was set at 25˚C. Net photosynthesis was measured between 11:00 and 15:00 eastern saving time. Sampling on day 0 differed slightly from post disturbance measurements, with two black spruce and two Kalmia samples measured for each stand
type (LW and FM) in every block for a total of eight samples per block (48 total). For every post disturbance sampling period, two samples per experimental unit (S0, S1 and NP), per species (black spruce and Kalmia), and per stand type (LW and FM) were collected for a total of 24 samples per block (144 total). Random sampling was done one species at a time and within a short interval for all experimental units of every block, to minimize the impact of time on treatments and/or stand types within a block.
A sub-sample of ten black spruce needles, selected for
A, was stored in a freezer until foliar area determination,
following the methodology described in Hébert et al. [21]. For Kalmia, two leaves, which served for A deter- mination, were scanned on a flatbed scanner, and leaf area was determined by software analysis (ImageJ, Na- tional Institute of Mental Health, Bethesda, MD, USA). Needles and leaves were then dried at 65˚C for 48 hours to calculate leaf mass per unit of area (LMA). We ob- tained one LMA measurement per sampling date and per experimental unit (S0-S1-NP); LMA was used to esti- mate foliar area of black spruce and Kalmia enclosed in the cuvette.
After each A measurement, two sub-samples of black spruce, Kalmia, and Rhododendron foliage were col- lected in each experimental unit and pooled to measure foliar nutrient concentrations (N, P, K, Ca, Mg). Each sample was dried at 65˚C for 48 hours and ground to a 40-mesh size prior to analyses. Total Kjeldahl N (TKN) was analyzed colorimetrically by spectrophotometry (Quickchem 8000, Lachat Instruments, Loveland, CO, USA), preceded by a H2SO4-Se-K2SO4 digestion [30]. P, K, Ca, Mg were extracted with a Mehlich III solution and measured by inductively coupled plasma analysis ICAP- 61E (Inductively Coupled Argon Plasma-Optical Emis- sion Spectrometry, Thermo Fisher Scientific, Waltham, MA, USA).
2.5. Statistical Analyses
Mean vegetation cover of bio-indicators (BS, KA, RG), and biodiversity indexes (N, S, J’, and H’) were submit- ted to a repeated analysis of variance (ANOVAR) [31]. Three covariance matrixes (unstructured (UN), Com- pound Symmetry (CS), and Huynh-Feldt (HF)) were tested and the best choice was based on Akaike (AIC) and Schwarz (BIC) estimation parameters [32]. A priori contrasts were used when interactions were considered significant. The contrasts were aimed to see if stand types differed over time and between microsites. ANO- VAR was performed with the MIXED procedure in the SAS software (SAS Institute Inc., Cary, NC, USA).
An ANOVA was used for physiological variables and
was executed with the REML procedure in the JMP 7.0 software (SAS Institute Inc., Cary, NC, USA). Normality and homoscedasticity of variance were verified for all data by examining visual distribution of the data and by analysis of residues [33]. The natural logarithmic (ln(x + 1)) was applied when necessary, and untransformed data were presented. A significance level of 0.05 was used for statistical analyses.
Multivariate analyses were used to find vegetation differences between stand types and their variation in time. A Bray-Curtis similarity matrix was produced through a fourth-root data transformation [34]. This transformation down-weighted the importance of very abundant species and took rare species into account [29]. Species assemblages by non-metric multidimensional scaling (nMDS) were formed from the dissimilarity ma- trix. Dissimilarity is a function of distance between groups; the most different groups having a higher distance be- tween each other. MDS representation precision was quan- tified by Kruskal stress values [31]; a low value indicat- ing a more precise bi-dimensional representation, and a va- lue higher than 0.3 representing a random representation [29]. All MDS matrices were produced with the PRI- MER software 5.2.2 (PRIMER-E Ltd., Lutton, UK). No significance threshold was set for the dissimilarity matrices.
3. Results
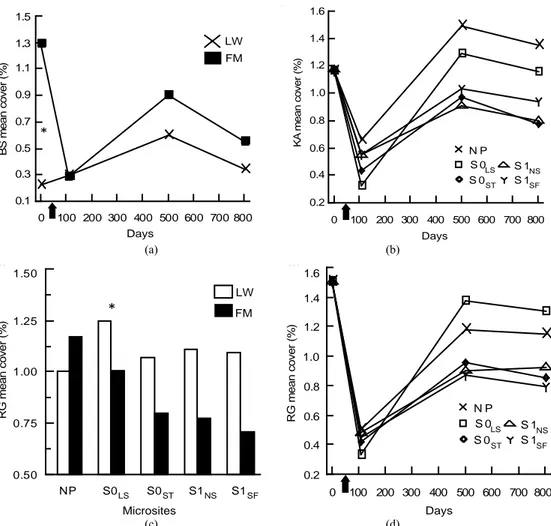
3.1. Mean Vegetation Cover: Bio-Indicators For black spruce (BS), we found a significant interac- tion between site type and time (Table 1). BS cover was significantly higher in the FM compared to LW before silvicultural treatment and decreased afterwards to a le- vel similar to LW (Figure 1(a)). For Rhododendron (RG) mean cover, the interaction between site type and mi- crosite was significant (Table 1). RG cover in S0LS was higher in the open lichen woodlands (LW) (Figure 1(c)). For Kalmia (KA) and RG, cover in the S0LS was around 0.3% on day 110 and rose to 1% on day 501. After that, KA cover was similar in all microsites and RG cover was still the highest for S0LS (Figures 1(b) and (d)).
3.2. Species Assembly
Non-metric multidimensional scaling (nMDS) exhibited two distinct data groups. The first group was composed of LW data points and was located in the upper part of the frame, and the second was located in the lower part of the frame, and mainly consisted of FM data points (Figure 2(a)). Stand type response varied over time: a high variation was observed in the LWs between day 0 and 110. This variation decreased between day 501 and 01, data points converging back to day 0 values (Figure 8
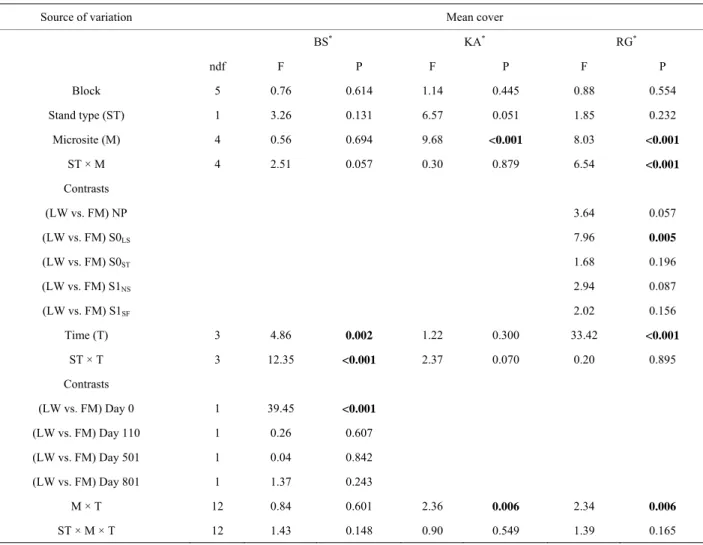
Table 1. Summary of ANOVA results for species mean cover (%) of regenerating black spruce layers and ericaceous shrubs submitted to various silvicultural treatments in lichen-spruce woodlands and black spruce-feathermoss stands. BS = Black spruce, KA = Kalmia angustifolia, RG = Rhododendron groenlandicum, LW = lichen-spruce woodland, FM = black spruce-feathermoss stand, NP = non perturbed, S0LS = logging strips in the non-scarified plots, S0ST = skid trails in the
non-scarified plots, S1NS = non-disturbed strips in the scarified plots, S1SF = scarification furrows.
Source of variation Mean cover
BS* KA* RG* ndf F P F P F P Block 5 0.76 0.614 1.14 0.445 0.88 0.554 Stand type (ST) 1 3.26 0.131 6.57 0.051 1.85 0.232 Microsite (M) 4 0.56 0.694 9.68 <0.001 8.03 <0.001 ST × M 4 2.51 0.057 0.30 0.879 6.54 <0.001 Contrasts (LW vs. FM) NP 3.64 0.057 (LW vs. FM) S0LS 7.96 0.005 (LW vs. FM) S0ST 1.68 0.196 (LW vs. FM) S1NS 2.94 0.087 (LW vs. FM) S1SF 2.02 0.156 Time (T) 3 4.86 0.002 1.22 0.300 33.42 <0.001 ST × T 3 12.35 <0.001 2.37 0.070 0.20 0.895 Contrasts (LW vs. FM) Day 0 1 39.45 <0.001 (LW vs. FM) Day 110 1 0.26 0.607 (LW vs. FM) Day 501 1 0.04 0.842 (LW vs. FM) Day 801 1 1.37 0.243 M × T 12 0.84 0.601 2.36 0.006 2.34 0.006 ST × M × T 12 1.43 0.148 0.90 0.549 1.39 0.165
Note: Bold indicates significance (P < 0.05). ndf = numerator degrees of freedom. *Ln-transformed data.
2(b)). This trend was less apparent for FM stands, where
distances between day 110, 501, and 801 were more ho- mogenous (Figure 2(c)).
3.3. Biodiversity Indexes
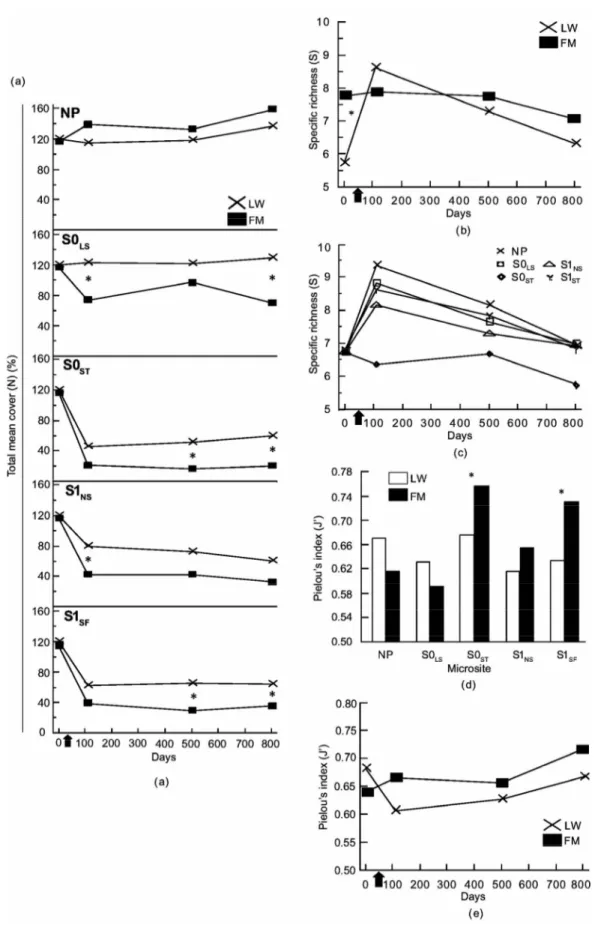
The ANOVA revealed a significant triple interaction between site type, microsite, and time for total mean cover (N) (Table 2). Contrasts showed a difference in N between LWs and FMs on day 801 for S0LS, S0ST, and S1SF (Table 2, Figure 3(a)). For species richness (S) and Pielou’s evenness (J’), we found a significant interaction between site type and time (Table 2). Species richness (S) was higher in FM stands and the initial gap between stand types decreased after silvicultural treatments (Fi-
gure 3(b)). Otherwise, S increase in LWs between day 0
and 110 was around 132%, but an inverse trend was
noted between day 501 and 801 (Figure 3(b)). The S0ST microsite had the lowest species richness, regardless of stand type and for all three sampling dates after silvicul- tural treatments (Figure 3(c)). For J’, stand type × mi- crosite interaction showed an advantage in favour of FM stands in S0ST and S1SF (Table 2, Figure 3(d)). Through- out the study, J’ variation showed similar trends between stand types (Figure 3(e)).
3.4. Physiological Variables
For BS, foliar N and P foliar concentrations were sig- nificantly higher in the S0 and S1 treatments and the dif- ferences were constant throughout days 110, 501, and 801 (Table 3, Figure 4(a), (b)). Foliar P and Mg con- centrations were significantly higher in FM stands com- pared to LWs (P: LW = 1.15 g·kg−1 0.40, FM =
BS m e a n c o v e r (% ) 0.1 0.3 0.5 0.7 0.9 1.1 1..3 1.5 0 100 200 300 400 500 600 700 800 LW FM * Days a) b) 0.2 0.4 0.6 0.8 1.0 1.2 1.4 1.6 0 100 200 300 400 500 600 700 800 N P S 0 LS S 0ST S 1 NS S 1SF K A m e a n c o v e r (% ) Days (a) (b) 0.50 0.75 1.00 1.25 1.50 NP S0LS S0ST S1NS S1SF Microsites LW FM * R G m e a n c o v e r (% ) 0.2 0.4 0.6 0.8 1.0 1.2 1.4 1.6 0 100 200 300 400 500 600 700 800 Days R G m e an cover ( % ) c) d) N P S 0LS S 0ST S 1NS S 1SF (c) (d)
Figure 1. Site type × time, site type × microsite, and microsite × time effects on black spruce (BS), Kalmia angustifolia (KA) and Rhododendron groenlandicum (RG) mean cover. Analysis performed on ln-transformed data; de-transformed data are presented. See Table 1 for abbreviations. Arrow on the X-axis represents the execution of the silvicultural treatments.
1.29 g·kg−1 0.46; Mg:LW = 0.85 g·kg−1 0.11, FM = 0.93 g·kg−1 0.19). However, silvicultural treatment application decreased the difference between stand types for K (Table 3, Figure 4(c)).
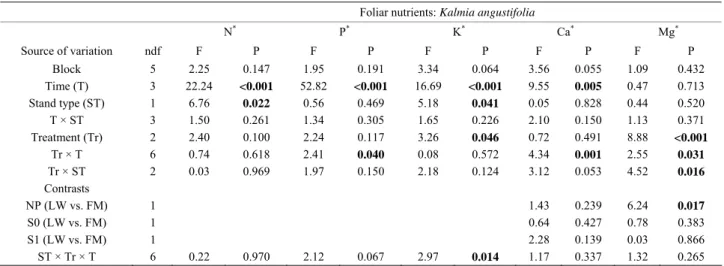
Kalmia foliar N concentrations were ≈10% higher in
FM stands, regardless of the silvicultural treatment (Ta-
ble 4, Figure 5(a)). Foliar P concentrations increased
over the years, with slightly higher concentrations in the scarified plots after 801 days (Figure 5(b)); the same trend was also found for KA foliar K in the FM stands (Figure 5(c)). On the other hand, we noticed a slight de- crease in foliar Ca concentrations over time (Figure
5(d)). Finally, Mg foliar concentrations increased over
time, but only in NP (Figure 5(e)). Similar results were found for RG (Table 5, results not shown).
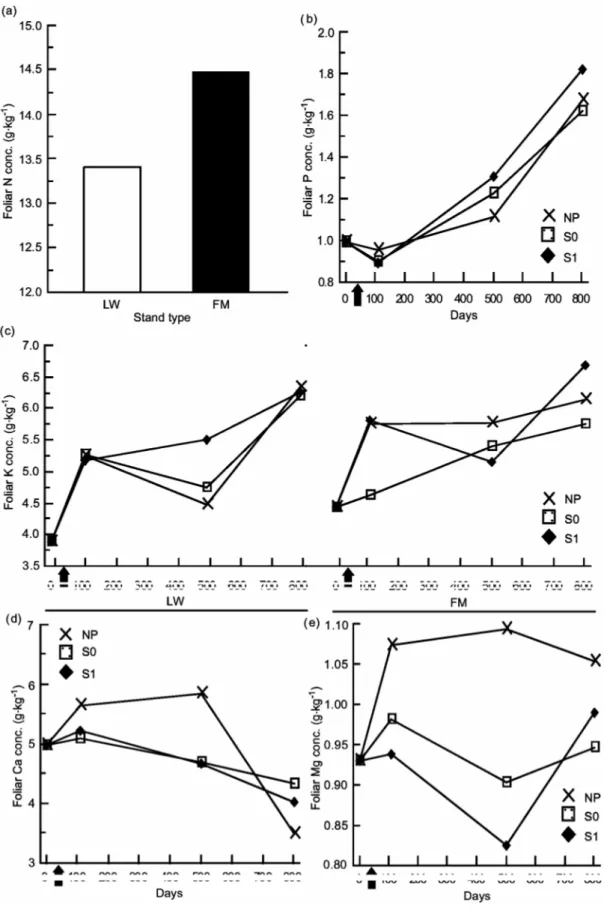
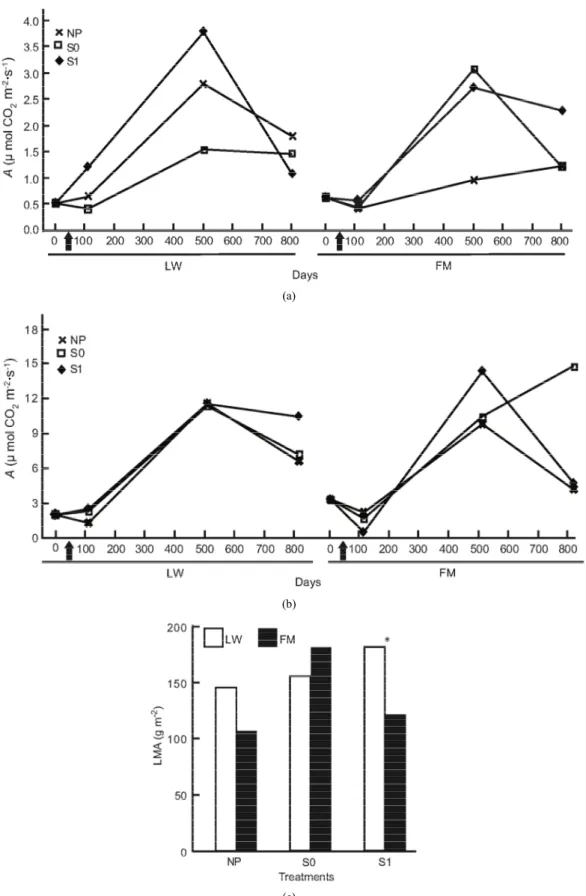
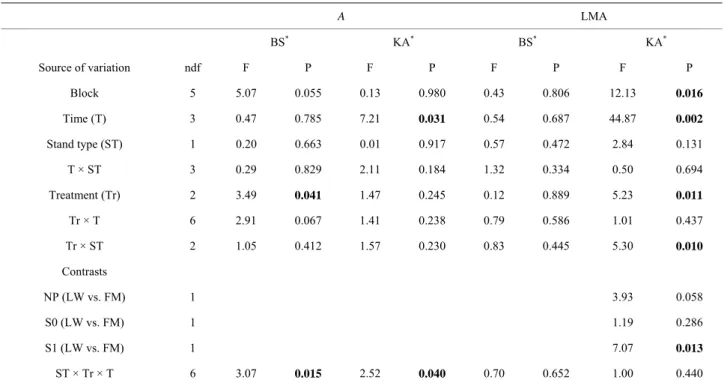
For BS in LWs, photosynthetic rates had increased by day 501, but no difference was found at the end of the experiment (Table 6, Figure 6(a)). In the FM stands, the increase on day 501 in the S1 treatment was still noticed for BS (Table 6, Figure 6(a)). For KA, photosynthetic
rates in all treatments had increased significantly by day 501, and decreased slightly at the end of the experiment in the LWs (Figure 6(b)). The same trend was measured in FM stands, but KA photosynthetic rates in the S0 mi- crosite increased from day 501 (Figure 6(b)). Leaf mass per unit area for KA differed only in the S1 treatment, with a higher value in the LWs (Figure 6(c)). Lastly, we found a significant positive relation between photosyn- thesis and LMA for KA (R2adj. = 0.46, P < 0.001).
4. Discussion
4.1. Plant Community Response to Silvicultural Treatments
The decline in black spruce cover in the black spruce- feathermoss (FM) stands coupled with a slight increase in black spruce cover in the lichen-spruce woodlands (LW) indicates that silvicultural treatments induced a more adverse short-term effect in the FM stands. On the other hand, the degree of co er change for Kalmia, with v
(a) (b) (c)
Figure 2. Non-metric multidimensional scaling (MDS) for species mean cover surveyed between 2005 and 2007, based on stand types (a), time in lichen-spruce woodlands (b), and time in the black spruce feathermoss stands (c). n = 300 (a), n = 180, 90, 180, 150 for day 0, 110, 501, 801 (b, c). See table 1 for abbreviations.
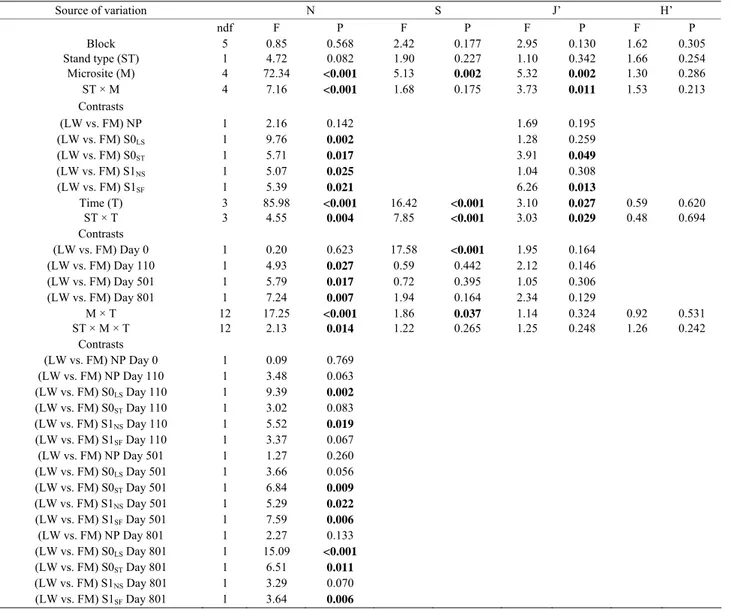
Table 2. Summary of ANOVA results for total mean cover (N), species richness (S), Pielou’s index (J’), and Shannon-Wiener index (H’). Refer to Table 1 for abbreviations.
Source of variation N S J’ H’ ndf F P F P F P F P Block 5 0.85 0.568 2.42 0.177 2.95 0.130 1.62 0.305 Stand type (ST) 1 4.72 0.082 1.90 0.227 1.10 0.342 1.66 0.254 Microsite (M) 4 72.34 <0.001 5.13 0.002 5.32 0.002 1.30 0.286 ST × M 4 7.16 <0.001 1.68 0.175 3.73 0.011 1.53 0.213 Contrasts (LW vs. FM) NP 1 2.16 0.142 1.69 0.195 (LW vs. FM) S0LS 1 9.76 0.002 1.28 0.259 (LW vs. FM) S0ST 1 5.71 0.017 3.91 0.049 (LW vs. FM) S1NS 1 5.07 0.025 1.04 0.308 (LW vs. FM) S1SF 1 5.39 0.021 6.26 0.013 Time (T) 3 85.98 <0.001 16.42 <0.001 3.10 0.027 0.59 0.620 ST × T 3 4.55 0.004 7.85 <0.001 3.03 0.029 0.48 0.694 Contrasts (LW vs. FM) Day 0 1 0.20 0.623 17.58 <0.001 1.95 0.164 (LW vs. FM) Day 110 1 4.93 0.027 0.59 0.442 2.12 0.146 (LW vs. FM) Day 501 1 5.79 0.017 0.72 0.395 1.05 0.306 (LW vs. FM) Day 801 1 7.24 0.007 1.94 0.164 2.34 0.129 M × T 12 17.25 <0.001 1.86 0.037 1.14 0.324 0.92 0.531 ST × M × T 12 2.13 0.014 1.22 0.265 1.25 0.248 1.26 0.242 Contrasts (LW vs. FM) NP Day 0 1 0.09 0.769 (LW vs. FM) NP Day 110 1 3.48 0.063 (LW vs. FM) S0LS Day 110 1 9.39 0.002 (LW vs. FM) S0ST Day 110 1 3.02 0.083 (LW vs. FM) S1NS Day 110 1 5.52 0.019 (LW vs. FM) S1SFDay 110 1 3.37 0.067 (LW vs. FM) NP Day 501 1 1.27 0.260 (LW vs. FM) S0LSDay 501 1 3.66 0.056 (LW vs. FM) S0ST Day 501 1 6.84 0.009 (LW vs. FM) S1NS Day 501 1 5.29 0.022 (LW vs. FM) S1SF Day 501 1 7.59 0.006 (LW vs. FM) NP Day 801 1 2.27 0.133 (LW vs. FM) S0LS Day 801 1 15.09 <0.001 (LW vs. FM) S0ST Day 801 1 6.51 0.011 (LW vs. FM) S1NSDay 801 1 3.29 0.070 (LW vs. FM) S1SF Day 801 1 3.64 0.006 Note: Bold indicates significance (P < 0.05). ndf = numerator degrees of freedom.
Figure 3. Site type × microsite, site type × time, microsite × time, and site type × microsite × time effects on total mean cover (a), Specific richness (b, c), Pielou’s index (d, e). See Table 1 for abbreviations.
Table 3. Summary of ANOVA results for black spruce foliar nutrient concentrations. LW = lichen spruce woodlands, FM = black spruce-feathermoss stand, NP = non perturbed, S0 = harvested, S1 = harvested + scarified.
Foliar nutrients: Black spruce
N* P* K* Ca* Mg* Source of variation ndf F P F P F P F P F P Block 5 0.23 0.939 1.72 0.237 0.22 0.942 0.60 0.703 1.30 0.353 Time (T) 3 6.98 0.013 23.43 <0.001 7.23 0.012 5.14 0.029 1.30 0.340 Stand type (ST) 1 34.19 <0.001 14.95 0.002 5.33 0.038 0.01 0.901 5.59 0.034 T × ST 3 3.19 0.059 1.18 0.357 0.58 0.639 1.35 0.300 1.36 0.299 Treatment (Tr) 2 5.71 0.006 12.84 <0.001 1.27 0.460 0.79 0.460 2.68 0.078 Tr × T 6 3.38 0.007 5.72 <0.001 0.77 0.597 0.39 0.882 1.04 0.410 Tr × ST 2 0.44 0.643 0.84 0.437 6.75 0.003 0.33 0.723 0.54 0.585 Contrasts NP (LW vs. FM) 1 15.60 0.001 S0 (LW vs. FM) 1 0.87 0.361 S1 (LW vs. FM) 1 0.82 0.374 ST × Tr × T 6 0.85 0.540 1.39 0.236 1.93 0.094 0.20 0.204 0.88 0.515
Note: Bold indicates significance (P < 0.05). ndf = numerator degrees of freedom. *Ln-transformed data.
6 7 8 9 10 0 100 200 300 400 500 600 700 800 NP S0 S1 Fol iar N co n c . (g kg -1) Days ) c) 0.6 0.9 1.2 1.5 1.8 2.1 2.4 0 100 200 300 400 500 600 700 800 NP S0 S1 Days F oli ar P c onc. ( g k g -1) 3 4 5 6 7 8 N P S0 S1 Treatments LW FM
*
F o lia r K co nc . ( g kg -1) (a) (b) (c)Figure 4. Treatment × time and site type × treatment effects on black spruce foliar nutrient concentrations. Analysis per- formed on In-transformed data; de-transformed data are presented. See Table 3 for abbreviations.
Table 4. Summary of ANOVA results for Kalmia angustifolia foliar nutrient concentrations. Refer to Table 3 for abbrevia- tions.
Foliar nutrients: Kalmia angustifolia
N* P* K* Ca* Mg* Source of variation ndf F P F P F P F P F P Block 5 2.25 0.147 1.95 0.191 3.34 0.064 3.56 0.055 1.09 0.432 Time (T) 3 22.24 <0.001 52.82 <0.001 16.69 <0.001 9.55 0.005 0.47 0.713 Stand type (ST) 1 6.76 0.022 0.56 0.469 5.18 0.041 0.05 0.828 0.44 0.520 T × ST 3 1.50 0.261 1.34 0.305 1.65 0.226 2.10 0.150 1.13 0.371 Treatment (Tr) 2 2.40 0.100 2.24 0.117 3.26 0.046 0.72 0.491 8.88 <0.001 Tr × T 6 0.74 0.618 2.41 0.040 0.08 0.572 4.34 0.001 2.55 0.031 Tr × ST 2 0.03 0.969 1.97 0.150 2.18 0.124 3.12 0.053 4.52 0.016 Contrasts NP (LW vs. FM) 1 1.43 0.239 6.24 0.017 S0 (LW vs. FM) 1 0.64 0.427 0.78 0.383 S1 (LW vs. FM) 1 2.28 0.139 0.03 0.866 ST × Tr × T 6 0.22 0.970 2.12 0.067 2.97 0.014 1.17 0.337 1.32 0.265 Note: Bold indicates significance (P < 0.05). ndf = numerator degrees of freedom. *Ln-transformed data.
Figure 5. Site type, site type × treatment, treatment × time, and site type × treatment × time effects on Kalmia angustifolia foliar nutrient concentrations. Analysis performed on ln-transformed data; de-transformed data are presented. See Table 3 for abbreviations.
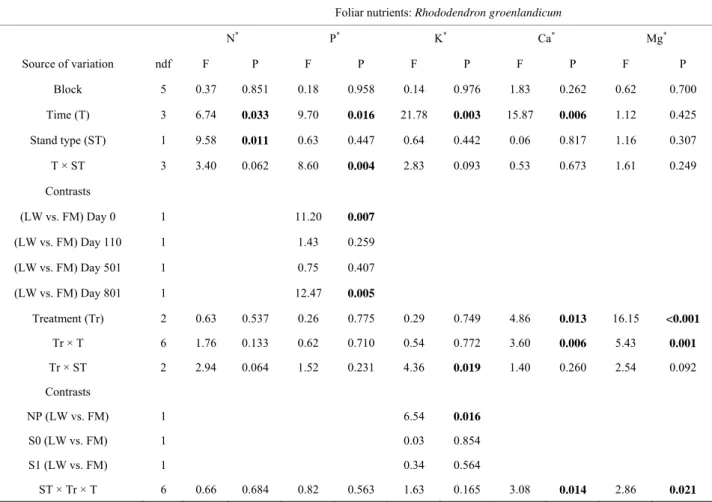
Table 5. Summary of ANOVA results for Rhododendron groenlandicum foliar nutrient concentrations. Refer to Table 3 for abbreviations.
Foliar nutrients: Rhododendron groenlandicum
N* P* K* Ca* Mg* Source of variation ndf F P F P F P F P F P Block 5 0.37 0.851 0.18 0.958 0.14 0.976 1.83 0.262 0.62 0.700 Time (T) 3 6.74 0.033 9.70 0.016 21.78 0.003 15.87 0.006 1.12 0.425 Stand type (ST) 1 9.58 0.011 0.63 0.447 0.64 0.442 0.06 0.817 1.16 0.307 T × ST 3 3.40 0.062 8.60 0.004 2.83 0.093 0.53 0.673 1.61 0.249 Contrasts (LW vs. FM) Day 0 1 11.20 0.007 (LW vs. FM) Day 110 1 1.43 0.259 (LW vs. FM) Day 501 1 0.75 0.407 (LW vs. FM) Day 801 1 12.47 0.005 Treatment (Tr) 2 0.63 0.537 0.26 0.775 0.29 0.749 4.86 0.013 16.15 <0.001 Tr × T 6 1.76 0.133 0.62 0.710 0.54 0.772 3.60 0.006 5.43 0.001 Tr × ST 2 2.94 0.064 1.52 0.231 4.36 0.019 1.40 0.260 2.54 0.092 Contrasts NP (LW vs. FM) 1 6.54 0.016 S0 (LW vs. FM) 1 0.03 0.854 S1 (LW vs. FM) 1 0.34 0.564 ST × Tr × T 6 0.66 0.684 0.82 0.563 1.63 0.165 3.08 0.014 2.86 0.021 Note: Bold indicates significance (P < 0.05). ndf = numerator degrees of freedom. *Ln-transformed data.
respect to the silvicultural treatment applied, was similar between stand types. Two years following treatments, the highest decrease had happened in the most intensely dis- turbed microsites, especially in the scarified ones. Scari- fication is well known to reduce Kalmia cover in black spruce plantations by producing barriers against rhizome extension: Kalmia underground organs are located at the interface of the organic horizon and mineral layer instead of in the mineral soil [35]. However, absolute cover val-ues between site types and microsites were similar, with relatively low mean cover measured overall.
Haeussler et al. [36] stated that there are three ways to reduce biological diversity through forest management: 1) by the displacement of indigenous species in favour of non-native species, 2) by diminishing forest overstory and understory diversity at the stand scale, and, 3) by inducing changes in species composition that lead to a decreased spatial heterogeneity. Our results clearly showed that silvicultural treatments did not reduce plant diversity in either stand type based on those criteria. We admit that MDS analyses revealed variations in plant
diversity for both stand types. However, the return to the initial composition was noticed only two years after treatments, especially in the LWs, thus indicating a higher level ecosystem resilience in LW.
Besides the plant bio-indicators selected, our results outlined a difference between responses of the plant community in LW and FM stands to logging and site preparations. Total mean cover of all species decreased drastically after logging in the skid trails, especially in the FM stands. Also, mean cover in LWs was higher at the end of the experiment. Skid trails are the microsites most affected by silviculture in terms of vegetation composition [37,38]. The higher decrease in total plant cover in the FM skid trails is due to a lack of acclimation by bryophyte species, which are more abundant in FM stands, an abrupt increase in light availability due to log- ging, and higher water stress [39-41]. Conversely, erica- ceous shrubs and lichens found in the LWs are already acclimated to open stand conditions, which gave LWs a restructuring advantage over FM plant communities after sil icultural treatments. An increase in specific richness v
(a)
(b)
(c)
Figure 6. Site type × treatment, and site type × treatment × time on black spruce (a), and Kalmia angustifolia (b, c) physio-logical parameters. A = photosynthesis, LMA = leaf mass per unit area. Analysis performed on ln-transformed data; de-transformed data are presented. See table 3 for abbreviations.
Table 6. Summary of ANOVA results for black spruce (BS) and Kalmia angustifolia (KA) photosynthesis (A) and leaf mass per unit of area (LMA). Refer to Table 3 for abbreviations.
A LMA BS* KA* BS* KA* Source of variation ndf F P F P F P F P Block 5 5.07 0.055 0.13 0.980 0.43 0.806 12.13 0.016 Time (T) 3 0.47 0.785 7.21 0.031 0.54 0.687 44.87 0.002 Stand type (ST) 1 0.20 0.663 0.01 0.917 0.57 0.472 2.84 0.131 T × ST 3 0.29 0.829 2.11 0.184 1.32 0.334 0.50 0.694 Treatment (Tr) 2 3.49 0.041 1.47 0.245 0.12 0.889 5.23 0.011 Tr × T 6 2.91 0.067 1.41 0.238 0.79 0.586 1.01 0.437 Tr × ST 2 1.05 0.412 1.57 0.230 0.83 0.445 5.30 0.010 Contrasts NP (LW vs. FM) 1 3.93 0.058 S0 (LW vs. FM) 1 1.19 0.286 S1 (LW vs. FM) 1 7.07 0.013 ST × Tr × T 6 3.07 0.015 2.52 0.040 0.70 0.652 1.00 0.440
Note: Bold indicates significance (P < 0.05). ndf = numerator degrees of freedom. *Ln-transformed data. after logging in the LWs, followed by a short-term return
to the initial richness after treatments, was also found by Robert & Zhu [24] in mixedwood stands. MDS analysis suggests a faster return of the initial species composition in the LWs, despite the higher early variation in species composition, compared to the FM stands. The general decrease of mean cover after two years in both stand types can also be explained by allelopathy and other negative interferences caused by the presence of erica- ceous shrubs, which could inhibit the establishment of plant species and decrease site productivity [25,42,43].
Contrary to Mallik [44], Kalmia cover was not related to community species diversity, as expressed by the Shannon-Wiener index (H’) that was similar between stand types and silvicultural treatments. However, this index may not be adequate to evaluate the response to disturbance [24], because plant species reorganization at ecosystem level is more related to functional groups, rather than individual species that exert a direct control on the species composition [41,43]. Therefore, silvicul- tural treatments did not affect the stand plant cover composition, and H’ was not related to site productivity. Finally, Pielou’s index revealed a higher variation among microsites in the FM, further supporting that FM vegeta- tion is more affected by silvicultural treatments.
Even if slight differences in plant community response to silvicultural treatments were found between stand
types, we argue that FM and LW short-term resilience is similar, indicating equally efficient ecosystem reorgani- zation in both types of stand. In direct response to one of the initial questions of this study, the FM and LW vege- tation communities did not change after silvicultural treatments. Therefore, the LW ecosystem resilience ob- served is not showing a lack of tolerance to anthropo- genic disturbances, at least on the short-term basis. 4.2. Plant Physiological Response to Silvicultural
Treatments
The lower pre-disturbance values for bio-indicators traits in LWs were expected. The lower foliar nutrient concen- trations in the LWs, especially for black spruce nitrogen, can be related to the higher density of ericaceous shrubs, which negatively influence nutrient absorption [44-46]. Hébert et al. [25] also showed that the presence of erica- ceous shrubs not only decreased N available in the min- eral soil, but also negatively affected black spruce ad- vanced regeneration physiology ten years after logging. Conversely, the higher foliar nitrogen concentration in both ericaceous shrub species in the FM stands can result from a higher N pool in the FM organic and mineral ho- rizon, Kalmia and Rhododendron being able to assimilate organic forms of nitrogen [47,48]. Furthermore, the short-term acclimation of Kalmia leaves in the FM skid trails, revealed by higher LMA and photosynthesis val-
ues, can explain the higher foliar N found in FM stands. By comparison, the absence of difference for LMA and photosynthesis after disturbance indicates that leaves in LWs were already acclimated to high light availability.
A plant response showing a partial reversion in stand productivity in LWs was also perceptible from the early (one year after treatment) leaf-level photosynthesis re- sponse to treatments for both black spruce regeneration and Kalmia shrubs. However, this response was miti- gated after two years for black spruce, suggesting a pos- sible trade-off mechanism where the increased site pro- ductivity also led to higher plant competition, especially where ericaceous species dominate [49]. Both leaf-level photosynthesis and LMA responses to treatments were more sustained in Kalmia two years after treatments than in black spruce, as observed in Rhododendron dominated stands [26].
4.3. Management Implications
LWs have traditionally been considered as fragile eco- systems that could not support sustained tree growth [50-53]. The evidence for this was partly based on LWs located in the unproductive Taiga zone [27] where LWs are commonly found, and which result from a limited postfire tree regeneration caused by an unfavourable cli- mate [4]. The LWs of our study are located in the pro- ductive closed-crown forest zone, where scattered LWs are adjacent to prevailing FM stands sharing similar site conditions (soil deposits, drainage, etc.) [6,10]. However, Hébert et al. [21] showed the importance of site prepara- tion for improving seedling growth and water relations in LWs. Leaf traits of bio-indicators and plant community responses suggest a potential for silvicultural treatments to increase site productivity in LWs, but additional work is needed to scale these results up to site-level metrics of productivity.
The comparable early resilience in managed LWs and FM stands, in terms of plant biodiversity, contradicts the presumed fragility of LW stands, especially in this case where LWs are assumed to be an alternative stable state created by compound disturbances [6,10]. Silvicultural treatments maintained the functional group diversity in LWs, a key element for ecosystem resilience [54]. Since fragility cannot be quantified [55], this term should be avoided in managed LWs, unless the protection of wild animals is the ultimate goal (e.g. the woodland caribou,
Rangifer tarandus caribou, [52,56]).
Considering that LWs in the closed-crown boreal for- est are an alternative stable state, forest management that could favour an increase in both natural and artificial black spruce regeneration needs to be scrutinized. On a landscape basis, Girard et al. [10] noticed a recent
in-crease in the creation rate of LWs within Québec’s closed crown boreal forest. Those LWs were created by a succession of disturbance events, like wildfires, spruce budworm epidemics, but also by logging, resulting in a decreased resilience of the spruce-feathermoss biocli- matic domain, since no evidence of a natural shift of LWs back to FM stands has been found [6,14]. The re- sults of this study support the idea that plantation fol- lowing site preparations in LWs could be considered a valuable management strategy, at least based on the early site resilience response to silvicultural treatments. Moreover, adequate silvicultural strategies may maintain the resilience of desired states and transform the unde- sirable states [57]. The afforestation of boreal open woodlands such as LWs is also interesting when consid- ering the greenhouse gas mitigation potential it repre- sents in both North America and Russia [18-20], in spite of possible limitations that also need to be addressed [53,58] in addition to the need for long-term evaluation of the site resilience to disturbance and plantation pro- ductivity.
5. Acknowledgements
This research was funded by a Fonds de Recherche pour la Nature et des Technologies du Gouvernement du Québec (FQRNT) grant to D. Lord, and the Carbone boréal project. We thank Virginie Blais, Solveil Bourque, Pierre-Luc Gaudreault, Silvie Paquette, Marc Tremblay and Pascal Tremblay for their field assistance.
REFERENCES
[1] E. H. Hamilton and S. Haeussler, “Modeling Stability and Resilience after Slashburning across a Sub-Boreal to Subalpine Forest Gradient in British Columbia,”
Cana-dian Journal of Forest Research, Vol. 38, No. 2, 2008, pp.
304-316. doi:10.1139/X07-098
[2] M. D. Morecroft, H. Q. P. Crick, S. J. Duffield and N. A. Macgregor, “Resilience to Climate Change: Translating Principles into Practice,” Journal of Applied Ecology, Vol. 49, No. 4, 2012, pp. 547-551.
[3] C. S. Holling, “Resilience and Stability of Ecological Systems,” Annual Review of Ecology, and Systematics, Vol. 4, 1973, pp. 1-23.
doi:10.1146/annurev.es.04.110173.000245
[4] S. Payette, “Fire as a Controlling Process in the North American Boreal Forest. A Systems Analysis of the Global Boreal Forest,” Cambridge University Press, Cambridge, 1992.
[5] M. G. Turner, W. H. Romme, R. H. Gardner, V. O’Neill and T. K. Kratz, “A Revised Concept of Landscape Equi- librium: Disturbance and Stability on Scaled Landsca- pes,” Landscape Ecology, Vol. 8, No. 3, 1993, pp. 213- 227. doi:10.1007/BF00125352
[6] J. P. P. Jasinski and S. Payette, “The Creation of Alterna- tive Stable States in the Southern Boreal Forest, Québec, Canada,” Ecological Monographs, Vol. 75, No. 4, 2005, pp. 561-583. doi:10.1890/04-1621
[7] M. Scheffer, S. Carpenter, J. A. Foley and C. Folke, “Catastrophic Shifts in Ecosystems,” Nature, Vol. 413, No. 6856, 2001, pp. 591-596. doi:10.1038/35098000
[8] J. S. Rowe, “Forest Regions of Canada,” Information Canada, Ottawa, 1972.
[9] H. St-Pierre, R. Gagnon and P. Bellefleur, “Régénération Après Feu de L'épinette Noire (Picea mariana) et du Pin Gris (Pinus banksiana) Dans la Forêt Boréale, Québec,”
Canadian Journal of Forest Research, Vol. 22, No. 4,
1992, pp. 474-481. doi:10.1139/x92-062
[10] F. Girard, S. Payette and R. Gagnon, “Rapid Expansion of Lichen Woodlands within the Closed-Crown Boreal Forest Zone over the Last 50 Years Caused by Stand Dis- turbances in Eastern Canada,” Journal of Biogeography, Vol. 35, No. 3, 2008, pp. 529-537.
doi:10.1111/j.1365-2699.2007.01816.x
[11] S. Payette, N. Bhiry, A. Delwaide and M. Simard, “Ori- gin of the Lichen Woodland at Its Southern Range Limit in Eastern Canada: The Catastrophic Impact of Insect Defoliators and Fire on the Spruce-Moss Forest,” Cana-
dian Journal of Forest Research, Vol. 30, No. 2, 2000, pp.
288-305. doi:10.1139/x99-207
[12] H. Le Goff, and L. Sirois, “Black Spruce and Jack Pine Dynamics Simulated under Varying Fire Cycles in the Northern Boreal Forest of Quebec, Canada,” Canadian
Journal of Forest Research, Vol. 34, No. 12, 2004, pp.
2399-2409. doi:10.1139/x04-121
[13] C. S. Brown and J. F. Johnstone, “Once Burned, Twice Shy: Repeat Fires Reduce Seed Availability and Alter Substrate Constraints on Picea mariana Regeneration,”
Forest Ecology and Management, Vol. 266, No. 1, 2011,
pp. 34-41. doi:10.1016/j.foreco.2011.11.006
[14] F. Girard, S. Payette and R. Gagnon, “Origin of the Li- chen-Spruce Woodland in the Closed-Crown Forest Zone of Eastern Canada,” Global Ecology and Biogeography, Vol. 18, No. 3, 2009, pp. 291-303.
doi:10.1111/j.1466-8238.2009.00449.x
[15] M. Veilleux-Nolin and S. Payette, “Influence of Recent Fire Season and Severity on Black Spruce Regeneration in Spruce-Moss Forests,” Canadian Journal of Forest
Research, Vol. 1327, No. 7, 2012, pp. 1316-1327.
doi:10.1139/x2012-098
[16] R. Gagnon and H. Morin, “Les Forêts D’épinette Noire du Québec: Dynamique, Perturbations et Biodiversité,”
Le Naturaliste Canadien, Vol. 125, No. 3, 2001, pp. 26-35.
[17] G. J. Nabuurs, O. Masera, K. Andrasko, Benitez-Ponce, R. Boer, M. Dutschke, E. Elsiddig, J. Ford-Robertson, P. Frumhoff, T. Karjalainen, O. Krankina, W. A. Kurz, M. Matsumoto, W. Oyhantcabal, N. H. Ravindranath, M. J. Sanz Sanchez and X. Zhang, “Forestry,” In: B. Metz, O. R. Davidson, P. R. Bosch, R. Dave and L. A. Meyer, Eds.,
Climate Change 2007: Mitigation (Contribution of
Working Group III to the 4th Assessment Report of the Intergovernmental Panel on Climate Change), Cambridge
University Press, Cambridge, 2007, pp. 541-584.
[18] S. Gaboury, J.-F. Boucher, C. Villeneuve, D. Lord and R. Gagnon, “Estimating the Net Carbon Balance of Boreal Open Woodland Afforestation: A Case-Study in Québec’s Closed-Crown Boreal Forest,” Forest Ecology and Mana-
gement, Vol. 257, No. 2, 2009, pp. 483-494.
doi:10.1016/j.foreco.2008.09.037
[19] J.-F. Boucher, P. Tremblay, S. Gaboury and C. Villeneu- ve, “Can Boreal Afforestation Help Offset Incompressible GHG Emissions from Canadian Industries?” Process Sa-
fety and Environmental Protection, Vol. 90, No. 6, 2012,
pp. 459-466. doi:10.1016/j.psep.2012.10.011
[20] A. Shvidenko, S. Nilsson and V. Roshkov, “Possibilities for Increased Carbon Sequestration through the Imple- mentation of Rational Forest Management in Russia,”
Water, air, and Soil Pollution, Vol. 94, No. 1-2, 1997, pp.
137-162. doi:10.1007/BF02407099
[21] F. Hébert, J.-F. Boucher, P. Y. Bernier and D. Lord, “Growth Response and Water Relations of 3-Year-Old Planted Black Spruce and Jack Pine Seedlings in Site Pre- pared Lichen Woodlands,” Forest Ecology and Manage-
ment, Vol. 223, No. 1-3, 2006, pp. 226-236.
doi:10.1016/j.foreco.2005.11.005
[22] A. O. Awiti, “Biological Diversity and Resilience: Les- sons from the Recovery of Cichlid Species in Lake Victo- ria,” Ecology and Society, Vol. 16, No. 1, 2011, pp. 1-11. [23] E. K. Dodson, D. W. Peterson and R. J. Harrod, “Under-
story Vegetation Response to Thinning and Burning Res- toration Treatments in Dry Conifer Forests of the Eastern Cascades, USA,” Forest Ecology and Management, Vol. 255, No. 8-9, 2008, pp. 3130-3140.
doi:10.1016/j.foreco.2008.01.026
[24] M. R. Roberts and L. Zhu, “Early Response of the Herba- ceous Layer to Harvesting in a Mixed Coniferous—De- ciduous Forest in New Brunswick, Canada,” Forest
Ecology and Management, Vol. 155, No. 1-3, 2002, pp.
17-31. doi:10.1016/S0378-1127(01)00544-8
[25] F. Hébert, N. Thiffault, J.-C. Ruel and A. D. Munson, “Ericaceous Shrubs Affect Black Spruce Physiology In- dependently from Inherent Site Fertility,” Forest Ecology
and Management, Vol. 260, No. 2, 2010, pp. 219-228.
doi:10.1016/j.foreco.2010.04.026
[26] F. Hébert, N. Thiffault, J.-C. Ruel and A. D. Munson, “Comparative Physiological Responses of Rhododendron
groenlandicum and Regenerating Picea mariana Follow-
ing Partial Canopy Removal in Northeastern Quebec, Canada,” Canadian Journal of Forest Research, Vol. 40, No. 9, 2010, pp. 1791-1802. doi:10.1139/X10-124
[27] J.-P. Saucier, J.-F. Bergeron, P. Grondin and A. Robitail- le, “Les Régions Écologiques du Québec Méridional,” Ministère des Ressources Naturelles du Québec, Ste-Foy, Québec, 2000.
[28] Environment Canada, “Climatic Normals and Means, Chute-des-Passes, Year 1971-2000,” Atmospheric Envi- ronment Service, Environment Canada, 2008.
[29] K. R. Clarke and R. M. Warwick, “Change in Marine Communities: An Approach to Statistical Analysis and Interpretation,” Plymouth Marine Laboratory, Plymouth,
1994.
[30] T. Sen Tran and R. R. Simard, “Mehlich III-Extractable Elements,” In: M. L. Carter, Ed., Soil Sampling and
Methods of Analysis, Lewis Publishers, Boca Raton, 2003,
pp. 43-49.
[31] Q. P. Quinn and M. J. Keough, “Experimental Design and Data Analysis for Biologists,” Cambridge University Press, Cambridge, 2002.
doi:10.1017/CBO9780511806384
[32] R. D. Wolfinger and M. Chang, “Comparing the SAS GLM and MIXED Procedures for Repeated Measures,” In: Proceedings of Twentieth Annual SAS Users Group
Conference, SAS Institute, Cary, 1995, p. 11.
[33] J. Devore and R. Peck, “Introductory Statistics,” 2nd Edition, West Publishing Company, St-Paul, 1994. [34] J. R. Bray and J. T. Curtis, “An Ordination of the Upland
Forest Communities of Southern Wisconsin,” Ecological
Monographs, Vol. 27, No. 4, 1957, pp. 151-164.
doi:10.2307/1942268
[35] N. Thiffault, A. D. Munson, R. Fournier and R. Bradley, “La Relation Éricacées—Conifères Bonheur D’oppres- sion?” Le Naturaliste Canadien, Vol. 129, No. 2, 2005, pp. 57-61.
[36] S. Haeussler, P. Bartemucci and L. Bedford, “Succession and Resilience in Boreal Mixedwood Plant Communities 15-16 Years after Silvicultural Site Preparation,” Forest
Ecology and Management, Vol. 199, No. 2-3, 2004, pp.
349-370. doi:10.1016/j.foreco.2004.05.052
[37] B. Harvey and S. Brais, “Effects of Mechanized Careful Logging on Natural Regeneration and Vegetation Com- petition in the Southeastern Canadian Boreal Forest,” Ca-
nadian Journal of Forest Research, Vol. 32, No. 4, 2002,
pp. 653-666. doi:10.1139/x02-006
[38] S. G. Newmaster, W. C. Parker, F. W. Bell and J. M. Paterson, “Effects of Forest Floor Disturbances by Me- chanical Site Preparation on Floristic Diversity in a Cen- tral Ontario Clearcut,” Forest Ecology and Management, Vol. 246, No. 2-3, 2007, pp. 196-207.
doi:10.1016/j.foreco.2007.03.058
[39] G. Brumelis and T. Carleton, “The Vegetation of Post- Logged Black Spruce Lowlands in Central Canada. II. Understorey Vegetation,” Journal of Applied Ecology, Vol. 26, No. 1, 1989, pp. 321-339. doi:10.2307/2403670
[40] N. J. Fenton, K. A. Frego and M. R. Sims, “Changes in Forest Floor Bryophyte (Moss and Liverwort) Commu- nities 4 Years after Forest Harvest,” Canadian Journal of
Botany, Vol. 81, No. 7, 2003, pp. 714-731.
doi:10.1139/b03-063
[41] R. G. Bloom and A. U. Mallik, “Indirect Effects of Black Spruce (Picea mariana) Cover on Community Structure and Function in Sheep Laurel (Kalmia angustifolia) Dominated Heath of Eastern Canada,” Plant and Soil, Vol. 265, No. 1-2, 2004, pp. 279-293.
doi:10.1007/s11104-005-0508-4
[42] S. H. Yamasaki, J. W. Fyles and B. D. Titus, “Interac- tions among Kalmia angustifolia, Soil Characteristics, and the Growth and Nutrition of Black Spruce Seedlings
in Two Boreal Newfoundland Plantations of Contrasting Fertility,” Canadian Journal of Forest Research, Vol. 32, No. 12, 2002, pp. 2215-2224. doi:10.1139/x02-119
[43] A. U. Mallik, “Conifer Regeneration Problems in Boreal and Temperate Forests with Ericaceous Understory: Role of Disturbance, Seedbed Limitation, and Keystone Spe- cies Change,” Critical Reviews in Plant Sciences, Vol. 22, No. 3-4, 2003, pp. 341-366. doi:10.1080/713610860
[44] A. U. Mallik, “Black Spruce Growth and Understory Spe- cies Diversity with and without Sheep Laurel,” Agronomy
Journal, Vol. 93, No. 1, 2001, pp. 92-98.
doi:10.2134/agronj2001.93192x
[45] A. Wallstedt, A. Coughlan, A. D. Munson, M. C. Nilsson and H. A. Margolis, “Mechanisms of Interaction between
Kalmia angustifolia Cover and Picea mariana
Seed-lings,” Canadian Journal of Forest Research, Vol. 32, No. 11, 2002, pp. 2022-2031. doi:10.1139/x02-124
[46] N. Thiffault, V. Roy, G. Prégent, G. Cyr, R. Jobidon and J. Ménétrier, “La Sylviculture des Plantations Résineuses au Québec,” Le Naturaliste Canadien, Vol. 127, No. 1, 2003, pp. 63-80.
[47] A. D. Munson and V. R. Timmer, “Soil-Nitrogen Dyna- mics and Nutrition of Pine Following Silvicultural Treat- ments in Boreal and Great-Lakes-St-Lawrence Planta- tions,” Forest Ecology and Management, Vol. 76, No. 1-3, 1995, pp. 169-179. doi:10.1016/0378-1127(95)03547-N
[48] S. Yamasaki, J. W. Flyes, K. N. Egger and B. D. Titus, “The Effect of Kalmia angustifolia on the Growth, Nutri-tion, and Ectomycorrhizal Symbiont Community of Black Spruce,” Forest Ecology and Management, Vol. 105, No. 1-3, 1998, pp. 197-207.
doi:10.1016/S0378-1127(97)00285-5
[49] N. Thiffault, B. D. Titus and A. D. Munson, “Black Spruce Seedlings in a KalmiaVaccinium Association: Microsite Manipulation to Explore Interactions in the Field,” Canadian Journal of Forest Research, Vol. 34, No. 8, 2004, pp. 1657-1668. doi:10.1139/x04-046
[50] K. A. Kershaw and W. R. Rouse, “Studies on Li-chen-Dominated Systems. I. The Water Relations of
Cladonia alpestris,” Canadian Journal of Botany, Vol. 49,
No. , 1971, pp. 1389-1399. doi:10.1139/b71-195
[51] K. A. Kershaw, “Studies on Lichen-Dominated Systems. XX. An Examination of Some Aspects of the Northern Boreal Lichen Woodlands in Canada,” Canadian Journal
of Botany, Vol. 55, No. 4, 1977, pp. 393-410.
doi:10.1139/b77-050
[52] R. Walsh, G. Rhéaume and P.-M. Marotte, “Cahier des Objectifs de Protection du Règlement sur les Normes D’intervention Dans les Forêts du Domaine Public (RNI),” Gouvernement du Québec, Ministère des Ressources Naturelles, Québec, 1997.
[53] N. Mansuy, S. Gauthier and Y. Bergeron, “Afforestation Opportunities When Stand Productivity Is Driven by a High Risk of Natural Disturbance: A Review of the Open Lichen Woodland in The eastern Boreal Forest of Cana- da,” Mitigation and Adaptation Strategies for Global
Change, Vol. 18, No. 2, 2012, pp. 1-20.
[54] T. Elmqvist, C. Folke, M. Nyström, G. Peterson, J. Ben- gtsson and B. Walker, “Response Diversity, Ecosystem Change, and Resilience,” Frontiers in Ecology and the
Environment, Vol. 1, No. 9, 2003, pp. 488-494.
doi:10.1890/1540-9295(2003)001[0488:RDECAR]2.0.C O;2
[55] C. Nilsson and G. Grelsson, “The Fragility of Ecosystems: A Review,” Journal of Applied Ecology, Vol. 32, No. 4, 1995, pp. 677-692. doi:10.2307/2404808
[56] R. Courtois, J.-P. Ouellet, L. Breton, A. Gingras and C. Dussault, “Effects of Forest Disturbance on Density, Space Use, and Mortality of Woodland Caribou,” Eco-
science, Vol. 14, No. 4, 2007, pp. 491-498.
doi:10.2980/1195-6860(2007)14[491:EOFDOD]2.0.CO;2
[57] C. R. Drever, G. Peterson, C. Messier, Y. Bergeron and M. Flannigan, “Can Forest Management Based on Natu- ral Disturbances Maintain Ecological Resilience?” Cana-
dian Journal of Forest Research, Vol. 36, No. 9, 2006, pp.
2285-2299. doi:10.1139/x06-132
[58] P. Y. Bernier, R. Desjardins, Y. Karimi-Zindashty, D. Worth, A. Beaudoin, Y. Luo and S. Wang, “Boreal Li- chen Woodlands: A Possible Negative Feedback to Cli- mate Change in Eastern North America,” Agricultural
and Forest Meteorology, Vol. 151, No. 4, 2011, pp. 521-