O
pen
A
rchive
T
OULOUSE
A
rchive
O
uverte (
OATAO
)
OATAO is an open access repository that collects the work of Toulouse researchers and
makes it freely available over the web where possible.
This is an author-deposited version published in :
http://oatao.univ-toulouse.fr/
Eprints ID : 6646
To link to this document :
DOI:10.1002/ceat.201100564URL :
http://dx.doi.org/10.1002/ceat.201100564To cite this version :
Dorobantu Bodoc, Mirunaand Prat, LaurentE.and Xuereb, Catherineand Gourdon, Christopheand Lasuye,
ThierryOnline Monitoring of Vinyl Chloride Polymerization in a Microreactor
Using Raman Spectroscopy.(2012) Chemical Engineering & Technology -CET, vol. 35 (4). pp. 705-712. ISSN 0930-7516
Any correspondance concerning this service should be sent to the repository
administrator: [email protected]
.
Miruna Dorobantu Bodoc1, Laurent Prat1,
Catherine Xuereb1, Christophe Gourdon1,
Thierry Lasuye2
1 Institutut National Polytechnique de Toulouse, Université de Toulouse, Laboratoire de Génie Chimique, Toulouse, France 2
Ineos ChlorVinyls, Mazingarbe, France
On-line Monitoring of Vinyl Chloride Polymerization Reaction
in Microreactor using Raman Spectroscopy
A novel capillary-based microfluidic device has been designed to follow the vinyl chloride polymerization reaction. The use of a co-flow generation system enabled obtaining monodisperse vinyl chloride droplets within 200 µm in diameter, each one being considered as a polymerization reactor. During polymerization VCM droplets were visualized with a high speed camera. At the end of the reaction PVC grains were observed with a Scanning Electron Microscopy technique. Real-time non-invasive Raman measurement has been performed on stationary vinyl chloride monomer droplets and has provided values of effective reaction orders n and effective rate constants k. This microdevice allowed the investigation in difficult conditions (pressure, temperature) with a minimal amount of reagents and consequently under safe conditions.
Keywords: Microreactor, Free Radical Polymerization, On-line Monitoring
1 Introduction
Microreactor technologies present several advantages compared to their macro-scale counterparts. For instance, due to their high surface-to-volume ratio (up to 4000 times more important than the conventional batch reactors) the specific exchange surfaces and the mass and heat transfer rates are substantially greater. This implies an enhanced heat control permitting to perform highly endothermic or exothermic reactions. The confined and laminar flow allows precise control over the size of the dispersed phase or the residence time. Another obvious advantage of the miniaturization is the small volume of reagents involved enabling to test dangerous reactions otherwise difficult to perform at laboratory scale.
Various applications of microreactors have increased in recent years [1,2]. Among the latter, new methods for accurately obtaining and controlling polymer particles with narrow size distribution have been described in the literature [3 - 6]. Polymerization in a two-phase dispersion system, such as suspension reactions, is the main method for obtaining polymer particles and several related studies have been conducted on this subject. Various authors proved droplet milifluidics to be an appropriate device for polymerization, further adding analytical tools which allow reaction monitoring [7].
The suspension polymerization of vinyl chloride (S-PVC) by a free-radical mechanism consists in dispersing liquid monomer under its autogeneous pressure into small droplets in a continuous aqueous phase containing surfactants and initiator. The protective colloids added inhibit the droplets to coalesce. The reaction starts by the thermo-decomposition of the organic initiator into the vinyl chloride monomer (VCM). As a consequence, the reaction proceeds in monomer droplets, which may be considered each as a bulk reactor. Because PVC is insoluble in its own monomer, VCM polymerization is a heterogeneous process involving several physical
transitions. The final PVC product is composed of primary particles and their agglomerates.
The kinetic monitoring of suspension polymerization is a challenging task due to the high
heterogeneity of the
reaction medium. Different techniques are present in the literature for the measurement of conversion during this type of reaction. Usually this parameter is obtained by gravimetry and only a relatively small number of works involve monitoring the suspension polymerization with techniques such as ultrasounds [8], calorimetry [9], NIR spectroscopy [10] or Raman spectroscopy [11]. Although considered as a common reaction, the S-PVC has never been studied at the micro scale. This might be due to the particularities of the operatory conditions (pressure, temperature) and to the toxic nature of the monomer. In this context the microtechnologies offer promising perspectives for the synthesis of PVC, since they imply generation of droplets with the same size, shape and chemical composition. The safety of the process would be granted by the small quantities of VCM involved and by the facility to evacuate the reaction heat.Raman spectroscopy seems as an appealing method for non-invasive kinetic investigation of suspension polymerization reaction. This technique offers information on both chemical structure as well as concentration within microdroplets, allowing real time tracking. Recent studies present the successful coupling to microfluidic devices in polymerization reactions [12]. However, literature does not reveal any research of this analysis method applied to S-PVC.
The main objective of this study was to implement a device allowing on-line monitoring of the S-PVC reaction on an isolated droplet in microchannel. This was accomplished by coupling a non-invasive Raman system enabling quantitative analysis of monomer/polymer droplets in microreactor. Also real time particle visualization was performed by connecting a high speed camera to the microchannel. First vinyl chloride monomer droplet behaviour images were therefore obtained.
2 Experimental Section
2.1 Materials
Vinyl chloride monomer (VCM) was supplied by Ineos ChlorVinyls, France in a 500 mL pressure cylinder (Swagelok). Partially hydrolyzed poly(vinyl acetate) (PVA) used as suspending agents were Gohensol KP08, 72.5% hydrolysis and Active 45, 45% hydrolysis and were provided by Nippon Gohsei Japan and respectively AKZO. Bis(tert-butylcyclohexyl) peroxydicarbonate (Perkadox 16W) used as initiator for the polymerization reaction was received from Sigma Aldrich.
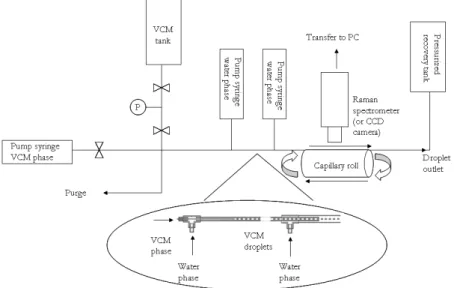
The experimental set-up used for the VCM polymerization is represented on Figure 1. The microreactor test bench was designed to allow a maximum working pressure of 30 bars and a 90°C working temperature. The components exposed to VCM, such as tubing or valves, obtained from Swagelok are all made of stainless steel. Water phase and VCM flows are ensured by neMesys high pressure syringe pumps equipped with high pressure stainless steel syringes. The reactor consists of fused silica capillary tube. The tube where the reaction is carried out was rolled up on a stainless steel support which allows guiding the capillaries in a precise order. This support was sunk in a water bath of controlled temperature by a thermostat. At the end of the microchannel a waste reactor was connected in order to recover any traces of unreacted VCM. Pressure is measured on VCM circuit and in the collecting vessel by pressure sensors with an accuracy of +/- 0.15% (Serv Instrumentation).
The water and VCM phase encounter in a co-flow generation device as shown in the zoom in Figure 1. The VCM generation is performed at the nozzle tip of a 50 µm ID (150 µm OD) fused silica capillary tube placed into another capillary tube of 250 µm ID (360 µm OD). Once droplets formed, they are flowing inside a 15 cm long microtube and they are ejected into a larger fused silica capillary of 520 µm ID (670 µm OD). A secondary water flow is injected. The system was chosen in order to ensure that droplets do not touch the microtube’s walls, producing therefore flow instabilities. The capillary length varied from 140 – 200 cm.
2.2 Sequence of operations
For the suspension polymerization, the entire circuit was first purged with nitrogen to avoid inhibition by oxygen. The suspending agents were added to the aqueous phase in quantities of respectively 90 ppm for Gohensol KP08 and 45 ppm Active 45 with respect to the water phase. The initiator was pre-dispersed into the VCM and then pushed into the microchannel in order to disperse the VCM phase into the water phase. The flow rates varied for the VCM phase between 0.2 – 0.5 mL/h and for the water phase: 2 – 5 mL/h. Once the hydrodynamic regime was established, a first Raman spectrum was acquired at ambient temperature serving as a reference measure. Afterwards the reactor is heated. As soon as the desired temperature is reached, the entire flow was stopped, the inlets and outlets are subsequently sealed and spectra is recorded at constant time intervals. The polymerization temperature is fixed at different values in a range between 58 to 70 °C. The pressure in the microreactor is between 10 to 16 bars. At the end of the experiment the circuit is cleaned with a PVC solvent and with the carrier fluid.
Droplet visualization is performed with a binocular Nikon SMZ-10 coupled with a high speed camera HCC -1000 (VDS Vosskühler GmbH) acquiring up to 1800 images/second. Light is ensured by fiber optics placed underneath the microchannel. Images are transferred to PC and processed with NV 1000 software (New Vision Technologies).
The spectra were obtained with a Raman spectrometer (RXN-1, Kaiser Optical System Inc., U.S.) characterized by a near-infrared laser diode (400 mW, 785 nm) as excitation source. The microfluidic device was placed under the probe head with non-contact sampling optics (10x) of the spectrophotometer. The data acquisition was carried out through a 5 mm window on the capillary channels. The probe head was focused above the microchannel by moving a y-z barrel micrometer. The acquisition time of each spectrum was of 120 seconds over 1 accumulation. This interval was chosen to give an acceptable signal-to-noise ratio for the acquired spectra.
Figure 1. Experimental set-up used for the vinyl chloride polymerization at microscale.
3.1 PVC particles visualization
The experimental set-up was designed to allow droplet visualization during the reaction by means of a CCD camera. It is possible as well to recover from the microchannel the polymerized grains and analyse them with a Scanning Electron Microscope (SEM) technique. By way of example, a VCM drop was monitored with a CCD camera at the first instants of the polymerization. The images corresponding to this experiment are presented in Figure 2. A change of colour at the droplet interface was clearly observed. After 2 minutes the interface starts to become cloudy, at 5 minutes a certain change in colour was noticed from white to grey and at about 7 minutes the droplet is almost black. After 10 minutes, the entire interface became completely black.
Figure 2. A VCM droplet during the first 10 minutes of reaction
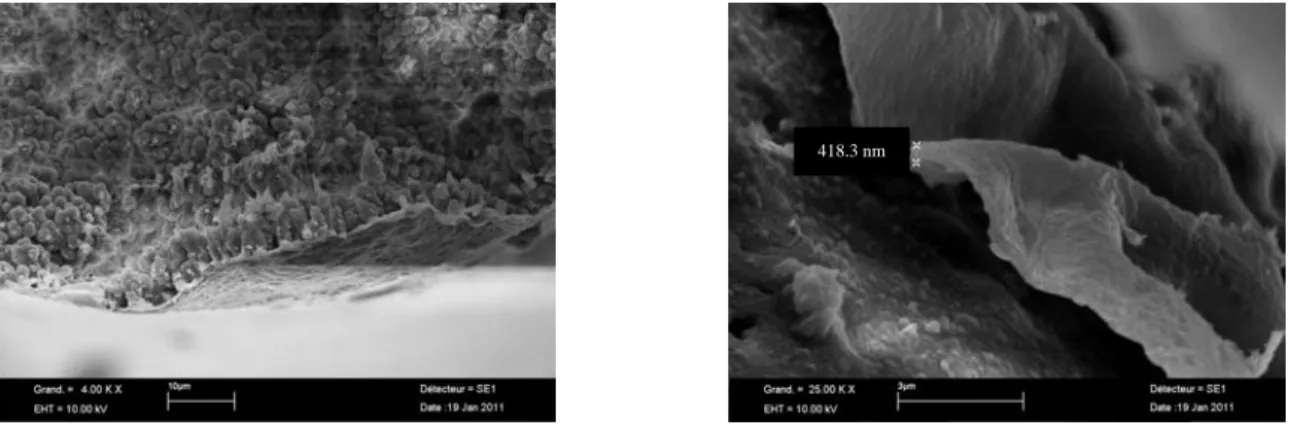
This change of colour was assigned to the formation of a skin around the droplet. The formation of the thin "skin" at the droplets interface is believed to take place at the very early stages of the polymerisation (about 2% conversion) due to the adsorption of the PVA on the VCM/water interface. The skin is believed to be formed of a graft copolymer (PVA-PVC) transforming the adsorbed stabiliser (PVA) into a rigid layer of about 10 nm thickness [13, 14]. The primary particles formed inside VCM droplets will aggregate at this ‘skin’ leading to the formation of a perricellular membrane of approximately 200 – 500 nm in thickness [15, 16]. The pericellular membrane is indeed present on the PVC particles obtained in microchannel at the end of the reaction and it was observed by means of SEM technique. The membrane’s surface is presented in Figure 3a and its thickness was measured at 418 nm (Figure 3b). During polymerization in batch reactors, primary particles move to the inner surface of the droplets by centrifugal forces caused by the agitation. These primary particles adhere and as they grow further they will finally coagulate with increasing monomer conversion. Consequently, a rigid layer is formed at the inner surface of the droplet covered by a PVA-PVC crosslinked skin at the outer surface of the droplet. The thickness of this layer probably depends on the agitation speed. If a higher agitation speed is used the skin will become thicker since more primary particles will move towards the inner surface of the particles driven by the centrifugal forces. Following this approach, in quiescent conditions as those in microchannel the perricellular membrane should have been thinner. However, its dimensions are strongly dependent on the PVA’s concentrations employed. In our experiments the PVAs concentrations were beyond the critical micelle concentration therefore one may suspect their influence on the membrane’s thickness.
The outside surface of the particles (PVA-PVC graft copolymer membrane) is relatively smooth as it may be noticed in both photos in Figure 3. The folds and hollows in the membrane are a consequence of the shrinkage of the monomer droplet during the reaction since the density of the PVC is greater than the one of VCM (ρPVC = 1,4 g.cm-3 ρMVC = 0,86 g.cm-3).
Figure 1. SEM images of the surface of the membrane surrounding the PVC particles obtained in microchannel (a) SEM measure of the membrane’s thickness (b).
The droplet’s evolution in micro channel during polymerization was monitored for 5 hours at 60°C and respectively 70°C. The images in Figure 4 show the evolution of the same droplet at different moments in time. For clearer view on the volume change, the droplets’ contour was outlined (white circle at instant 0 and at 5 hours). The measurements of diameters were carried by tracking the interface of the droplet in the capillary. The image processing software furnished the corresponding positions which
418.3 nm
were subsequently transformed from pixel units into micrometers by using the channel width as scale
.
For the volume calculations, droplets were considered as spheres.Figure 4. Droplet evolution during 5 hours of reaction at 60°C
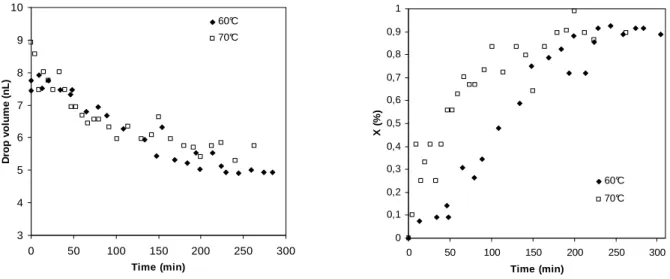
As expected, the droplet volume contracts due to the density difference between monomer and polymer. The volume decrease with time is presented in Figure 5a. We remark a decrease of about 30 % of the droplet volume during monitoring time.
Various authors [17], [18] evaluated some of the physical properties of the two-phase dispersion water/VCM. They took into consideration an expression for the volume contraction of the polymerizing droplet due to density changes. Both before mentioned authors suggest a droplet volume model that evolves with conversion X:
X
V
V
=
−
ε
1
0 (1) p m pρ
ρ
ρ
ε
=
−
with V, V0 the volumes respectively at conversion X and X=0, ε the shrinkage factor, ρm and ρp the monomer density and polymer
density respectively. 0 0,1 0,2 0,3 0,4 0,5 0,6 0,7 0,8 0,9 1 0 50 100 150 200 250 300 Time (min) X ( % ) 60°C 70°C
Figure 5. Polymerized droplet volume measurement (a), Monomer conversion estimated with equation 1 (b).
This type of calculation allows predicting droplet conversion only by the means of the measures performed on the pictures recorded with the CCD camera. The results are presented in Figure 5b. Nevertheless, it is important to underline the degree of uncertainty associated to this method. Therefore the results are only used to estimate a polymerization characteristic time.
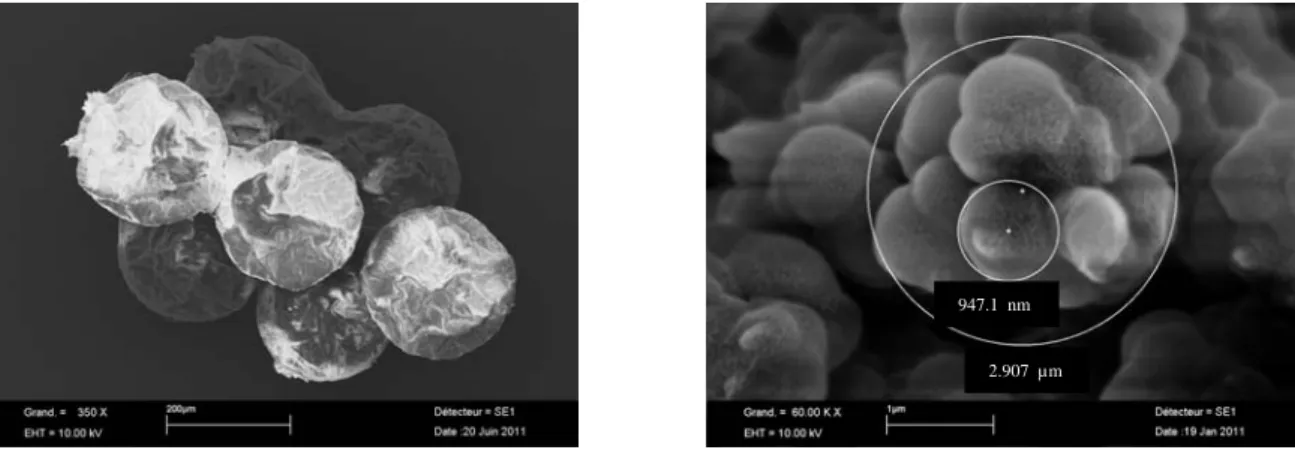
PVC grains recovered from the microreactor are around 200 µm in diameter as observed in Figure 6a. SEM pictures in Figure 6b were taken through a cross-section of a PVC grain. Normally, when conversion increases, the volume of free VCM inside the droplets decreases. Thus, the primary particles inside the droplets increase in size and fuse together determining the porous character of the droplet. The size of the primary particle was measured at about 1 µm in diameter (Figure 6b, small circle), value in good agreement with the average size mentioned in the literature [20]. The strong capillary forces that appear within the droplet enable the primary particles to fuse together. The result is the formation of a continuous open network of agglomerates of about 3µm in diameter (Figure 6b, large circle).
3 4 5 6 7 8 9 10 0 50 100 150 200 250 300 Time (min) D ro p v o lu m e ( n L ) 60°C 70°C
Figure 6. PVC grains recovered from the microreactor at the end of the reaction (a), cross-section of a PVC grain from the microreactor at the end of the reaction (b).
3.2 First kinetic analysis
In this section the on-line kinetic monitoring of vinyl chloride in the microdevice is presented and discussed. Figure 7a shows the spectrum of monomer droplets taken as reference measure.
0 20000 40000 60000 80000 100000 120000 140000 0 500 1000 1500 2000 2500 3000 3500 Raman shift (cm-1) R e fe re n c e s p e c tr a
Figure 7. Vinyl chloride monomer spectra at the initial time of reaction (a), and vinylic group area evolution with time (b).
Although the spectra were obtained on droplets in aqueous phase their quality is good enough and no fluorescence was detected. The Raman band specific of the vinylic group exhibits a strong signal at 1606 cm-1.
The low frequency at 395 cm-1 is attributed to the planar deformation mode of the C=C-Cl skeleton, the 707 cm-1 corresponds to the stretching of the C-Cl band, the responses in the 1200-1400 cm-1 area indicate the CH2 planar deformation or rocking modes
and the magnitudes in the 3000-3100 area are assigned to stretching modes of the C-H bonds.
Once the heating is started the reaction is initiated in the monomer droplets. During polymerization, monomer content decreases with conversion. Therefore the corresponding vinylic C=C related peak area undergoes an important decrease according to time, as represented in Figure 7b. Important variations are observed especially within the acquisitions at the end of the reaction. At high conversions, when the monomer concentration diminishes, the area becomes rather small and therefore more affected by the signal noise.
Figure 8a, illustrates the area under the vinyl stretching band as obtained from the spectra monitored over time. It can be noticed the decreasing tendency despite the severe signal distortions which might be due to the medium heterogeneity. Moreover, due to the heating, the capillary tube is subjected to dilatation, therefore moving out of focus. In both cases, the area of incidence of the Raman laser might be modified from a whole polymer particle, to a set of particles, a region containing both water and polymer or to a complete de-focusing. All these constraints make representative sampling more difficult. Therefore spectrum out of focus has been removed.
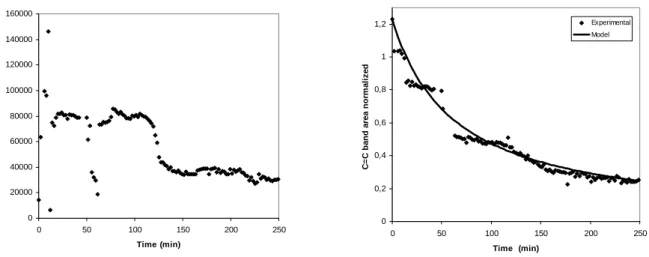
Afterwards, a criterion based on experimental observations was applied in the absence of a calibration method. C-Cl bond stretching (present in both monomer and polymer) was used as an internal standard and the area ratio of the C=C stretching mode to the C-Cl stretch was used to create a calibration for monomer predictions. This method based on peak area ratios was applied to the experimental values presented in Figure 8a (raw data) therefore leading to the values from Figure 8b (treated data). It can be observed that the area ratio decreases relatively continuously with time. The monomer concentration was assumed to be directly proportional to the normalized area of the vinylic peak in Figure 8b.
947.1 nm
Figure 2. Raw vinylic group stretching area evolution during 250 minutes at a temperature of 58°C (a), Vinylic group stretching area normalized to the C-Cl stretch band area during 250 minutes at 58 °C (b).
Several authors proposed complex kinetic models for the S-PVC including a two-phase polymerization scheme [19,20]. The objective of this study is to obtain basic kinetic data in order to validate the global approach of this work.
Therefore a simple kinetic model has been proposed in order to represent the experimental data. Note that in our calculation we assumed an ideal mixing. Given the important volume variations of the polymerizing droplet with conversion, this parameter was taken into account in the kinetic expressions.
The rate equation for irreversible reactions with variable volume was expressed as described in equation:
V
kM
dt
VM
d
=
n−
(
)
(2)where M is the monomer concentration, k is the effective rate constant and n the effective reaction order. Equation 1 was used for volume determination. This simple kinetic model was chosen to fit the experimental data and to characterize the results. Integrating the equation 2 between the limits one can have access to a linearized rate equation for n-order reactions:
[ ]
1
[ ]
1
(
1
(
2
)
)
0 0 2 0 2ε
V
M
V
kt
n
M
M
t n n t−
−
+
=
− − (3)where [M]t is the monomer concentration at the moment t calculated as the area of vinylic peak normalized by the C-Cl peak,
[M]0 is the initial monomer concentration, Vt corresponds to the polymerized droplet volume at the instant t and V0 is the initial
droplet volume. From the experimental data the coefficients n and k (equation 3) were determined using a fitting method applied in the Excel Solver. From the normalized peak areas, the molar conversion may be estimated with the following relationship:
)
(
)
(
)
(
)
(
1
]
[
]
[
1
)
(
0 0 0t
A
t
A
t
A
t
A
M
M
t
X
CCl M CCl M−
=
−
=
(4)where A(t) is the peak area at time t corresponding to monomer (M) or C-Cl bond (CCl) respectively.
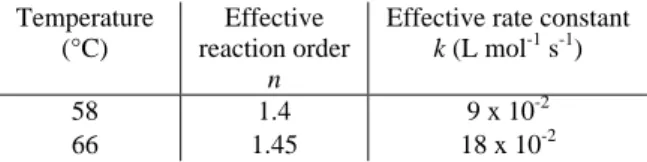
The experimental conversion and the calculated one versus time are compared in Figure 9 for two temperatures, 58 and 66 °C respectively. The solid line stands for the kinetic model issued from the equation 4. For the two temperatures the values of the reaction order n and the effective rate constant k are summarized in Table 1.
As expected, Figure 9 shows that the polymerization rate increases when the reaction temperature is increased. The simplified kinetic model proposed seems adapted to the experimental values. Several aspects need to be pointed out: at 66°C the model seems better adapted while for 58°C the evolutions of the two curves are not fully comparables. The experiments were ended when a threshold was attained. At that point we estimated the reaction was complete and therefore a conversion of 1 was assumed. Note the similar reaction times as those presented in Figure 5b. The kinetic results obtained with the volume contraction evaluation from 0 20000 40000 60000 80000 100000 120000 140000 160000 0 50 100 150 200 250 Time (min) C = C a re a 0 0,2 0,4 0,6 0,8 1 1,2 0 50 100 150 200 250 Time (min) C = C b a n d a re a n o rm a li z e d Experimental Model
Figure 9. Kinetic curves obtained at 58°C and 66°C. 0 0,1 0,2 0,3 0,4 0,5 0,6 0,7 0,8 0,9 1 0 50 100 150 200 250 Time (min) C o n v e rs io n T = 66°C T = 58°C Model
equation 1 have the same order of magnitude compared with the Raman on-line monitoring of conversion. However, a more in depth analysis is not suited because different polymerization temperatures were employed.
Temperature (°C)
Effective reaction order
n
Effective rate constant k (L mol-1 s-1)
58 1.4 9 x 10⁻²
66 1.45 18 x 10-2
Table 1. Reaction orders and rate constants at different working temperatures.
The effective rate constants obtained allow an estimation of the apparent activation energy ∆E for the S-PVC polymerization with the equation: 1 2 1 1 2
ln
1
1
k
k
R
T
T
E
−
−
−
=
∆
(5)A value of 80 kJ/mol resulted from calculation. It seems in agreement with some values reported in literature: activation energy of propagation in styrene polymerization (39 kJ/mol) [21], or in synthesis of polyurethanes (150 kJ/mol) [22]. For the vinyl chloride suspension polymerization, T.De Roo [23] furnished data on the activation energy of 24.9 kJ/mol for propagation and 54.3 kJ/mol for chain transfer. The value obtained in microreactor lies in the same magnitude order.
4 Conclusion
The main objective of this study was to implement a device allowing the study of S-PVC kinetics by means of an on-line analysis inside an isolated droplet in microchannel. This was accomplished using the Raman spectroscopy as a technique for quantitative analysis of monomer/polymer droplets in microreactor. A qualitative approach was also put in place by means of visualization of the PVC particles during or at the end of the reaction.
A microfluidic device was designed to allow high pressure and temperature conditions in a perfectly safe manner. The quantities of vinyl chloride monomer, which presents a highly toxic character, were minimised, therefore the process remained completely reliable at any time for the operator as well as for the ambient environment. A co-flow device was set up to enable monodisperse VCM droplet generation. An isolated monomer droplet was visualized during the reaction. Its volume contraction was evaluated in terms of reaction conversion. Fused silica capillaries allowed application of Raman analysis technique for monitoring of monomer droplets suspended in aqueous solution. Good quality data have been acquired using this spectroscopy method applied to small droplets of monomer. The relatively long acquisition time (2 minutes) is not a limiting factor for data acquiring because the monitoring is performed on a stationary droplet. After spectra normalization, the monomer conversion degree was estimated with an acceptable accuracy versus time. A first model of the polymerization kinetics was performed with satisfactory results. Further improvement of a mathematical calibration technique may increase the measurement accuracy. Also the development of a complex kinetic model is in progress. The latter is suited for confined S-PVC conditions as those in microreactor. At the end of the reaction PVC grains were collected away from the device and analysed. Their dimensions and shapes were in good agreement with published data from a morphological point of view.
Acknowledgements
The authors acknowledge Ineos ChlorVinyls for having funded this study.
Symbols used
V [nL] Monomer droplet volume at instant t
V0 [nL] Monomer droplet volume at instant t = 0
ε [ - ] Shrinkage factor X [ - ] Conversion degree ρp [kg m-3] Polymer density ρm [kg m -3 ] Monomer density
k [L mol-1 s-1] Effective rate constant
[M] [mol L-1] Monomer concentration at instant t [M]0 [mol L
-1
] Monomer concentration at instant t = 0
n [ - ] Reaction order
A (t) [ - ] Peak area at time t
A (t0) [ - ] Peak area at time t = 0
R [J mol-1K-1] Gas constant
References
[1] A.B.Theberge, F. Courtois, Y.Schaerli, M. Fischlechner, C. Abell, F.Hollfelder, T. S Huck, Angew. Chem. 2010, Int. Ed., 49, 5846-5868.
[2] N. Lorber, F. Sarrazin, P. Guillot, P. Panizza, A.Colin, B. Pavageau, C. Hany, P. Maestro, S. Marre, T. Delclos, C. Aymonier, P. Subra, L. Prat, C. Gourdon, E. Mignard, ,Lab on a Chip 2011, 11, 779- 787.
[3] A. Marcati, L. Prat, C. Serra, J. Tasseli, P. Dubreuil, Chem. Eng. Technol. 2009, 32(11), 1823–1830. [4] A. Marcati, C. Serra, M. Bouquey, L. Prat, 2010, Chem. Eng. Technol. 33(11), 1779-1787.
[5] C. Serra, N. Berton, M. Bouquey, L. Prat, G. Hadziioannou, Langmuir 2007, 23, 775-7750.
[6] M. Seo, Z. Nie, S. Xu, M. Mokb, P.C. Lewis, R. Graham, E. Kumacheva, Langmuir 2005, 21, 11614-11622. [7] F. Bally, C. Serra, V. Hessel, G. Hadziioannou, Macromol. React. Eng. 2010, 4, 543-561.
[8] P. Sladky, I. Pelant, L. Parma, Ultrasonics 1979, 17, 32-36.
[9] G. Maschio, I. Ferrara, C. Bassani, H. Nieman, Chem. Eng. Sci. 1999, 54, 3273 – 3282. [10] A. F. Santos, E. L. Lima, J. C. Pinto, J. Appl. Polym. Sci. 1998, 70, 1737 – 1746.
[11] J. C. Santos, M. M. Reis, R. A. Machado, A. Bolzan, C. Sayer, R. Giudici, H. H. Araujo, Ind. Eng. Chem. Res. 2004, 43, 7282 – 7289.
[12] N. Lorber, B. Pavageau, E. Mignard, Macromolecules 2010, 43, 5524 – 5529.
[13] M. W. Allsopp, Manufacturing and Processing of PVC, Applied Science Publishers, London 1982. [14] J. Eliassaf, J. Macromolec. Sci. 1974, 8 (2), 459-462.
[15] P.V. Smallwood, Polymer 1986, 27, 1609 – 1618.
[16] A. J. Davidson, D. E. Witehafer, J. Polym Sci.: Polym Phys. 1980, 18 (1), 51 – 69.
[17] C. Kiparissides, G. Daskalakis, D.S. Achilias, E. Sidiropoulou, Ind. Eng. Chem. Res. 1997,36, 1253-1267.
[18] D. Maggioris, A. Goulas, A. H. Alexopoulos, E. G. Chatzi, C. Kiparissides, Chem. Eng. Sci. 2000, 55, 4611 – 4627. [19] E. Sidiropoulou, C. Kiparissides, J. Macromol. Sci. Chem. 1990, A27 (3), 257 – 288.
[20] T. Y. Xie, A. E. Hamielec, P. E. Wood, D. R. Woods, Polymer 1991, 32, 537 – 548. [21] B. Yamada, M. Kageoka, T. Otsu, Macromolecules 1991, 24 (18), 5234 – 5236.
[22] J.M.E. Rodrigues, M.R. Pereira, A.G. de Souza, M.L. Carvalho, A.A. Dantas Neto, T.N.C. Dantas, J.L.C. Fonseca, Thermochimica Acta 2005, 427, 31-36.