Brodeur: Paris School of Economics (PSE), 48 Boulevard Jourdan, 75014 Paris, France
abel.brodeur@parisschoolofeconomics.eu
Connolly: Corresponding author. Université du Québec à Montréal, Département des sciences économiques,
C.P. 8888, Succ. Centre-ville, Montréal, QC, Canada H3C 3P8; CIRPÉE and CIRANO connolly-pray.marie@uqam.ca
Financial support from the Fonds Québécois de la Recherche sur la Société et la Culture is gratefully acknowledged. Thanks to participants of the « Journées du CIRPÉE 2010 » meetings and seminar participants at PSE. We are also grateful to Andrew Clark, Sarah Flèche, Pierre Fortin, Pierre Lefebvre and Claudia Senik. All errors are our own. Cahier de recherche/Working Paper 12-23
Do Higher Childcare Subsidies Improve Parental Well-being?
Evidence from Québec’s Family Policies
Abel Brodeur Marie Connolly
Abstract:
In this paper, we investigate the effect of a change in childcare subsidies on parental subjective well-being. Starting in 1997, the Canadian province of Québec implemented a generous program providing $5-a-day childcare to children under the age of 5. By 2007, the percentage of children attending subsidized day care had tripled and mothers’ labor force participation had increased substantially. Objectively, more labor force participation is seen as a positive improvement, bringing with it higher income, independence and bargaining power. Yet a decrease in women’s subjective well-being over previous decades has been documented, perhaps due to a Second Shift effect where women work more but still bear the brunt of housework and childrearing (Hochschild and Machung, 1989). Using data from the Canadian General Social Survey, we estimate a triple-differences model using differences pre- and post- reforms between Québec and the rest of Canada and between parents with young children and those with older children. Our estimates suggest that Québec’s family policies led to a small decrease in parents’ subjective well-being. Of note, though, we find large and positive effects for poor household families and high school graduates and negative effects for middle household income families. We find similar negative effects on life satisfaction for both men and women, but different effects on satisfaction with work-life balance. This suggests that fathers’ life satisfaction could be influenced by their wives’ labor supply while their work-life balance is not.
Keywords: Childcare, labor supply, subjective well-being, life satisfaction, happiness,
work-life balance
Section I. Introduction
The question of whether technological changes, higher real wages, rising educational attainment and lower fertility can cause an increase of women’s well-being are basic concerns for economists. Over the past few decades, women’s rights in areas such as child custody and labor force participation improved considerably, leading to a social change that objectively should have made women better-off. Yet puzzlingly, women in the United States were reporting lower levels of happiness in the 2000s than in the 1970s, both absolutely and relative to men (Blanchflower and Oswald, 2004; Stevenson and Wolfers, 2009). Using answers to subjective well-being questions from the American General Social Survey (AGSS),1 Stevenson and Wolfers (2009) showed that women are now reporting happiness levels that are similar or even lower than those of men. They called that phenomenon “the paradox of declining female happiness.” The authors also claimed and showed empirical evidence that this trend holds across much of Europe. Unfortunately, while they offer some possible explanations of this paradox, they fall short of providing definitive answers. By their own admission, they “do not purport to offer an answer to what is driving the decline in subjective well-being among women.” (Stevenson and Wolfers, 2009, p. 194) Many factors could have contributed towards a decline in women’s well-being. For instance, women might have a new reference group when evaluating their life satisfaction and thus compare their situation to men or to an ideal state. Another explanation is simply that there are divergent social roles and expectations for women, as existentialist and early feminist Simone de Beauvoir noted over half a century ago: “One is not born, but rather becomes, woman. No biological, psychic, or economic destiny defines the figure that the human female takes on in society; it is civilisation as a whole that elaborates this intermediary product between the male and the eunuch that is called feminine.” (de Beauvoir, 1949, p. 283)
1 Stevenson and Wolfers (2009) also used other data sets such as the Virginia Slim Survey of American
Women’s Opinion Polls to look into life satisfaction. Results were quite similar than those about happiness but the overall downward trend is larger for both sexes. On the other hand, Herbst (2011) showed that men and women reported the same decreases in life satisfaction and other indicators of well-being since the mid-1980s (using the DDB Needham Life Style Survey).
One of the most remarkable social changes over the last decades is the rise in the labor force participation rate of women. In the 1970s in Canada, less than half of women aged 25 to 64 had a job compared to around 65 percent in the 1990s (Beaudry and Lemieux, 1999). This increase is larger when considering participation rates (from 50 percent in the mid-1970s to 70 percent in the 1990s), and even more so when looking at mothers of at least one child under 6, whose employment rates rose from 31 percent in 1976 to 67 percent in 2004 (Baker et al., 2008). The Akerlof and Kranton (2000) identity model aids in understanding the impact of women’s movement on the labor market. Declining gender associations from tasks have two opposing consequences on the identity of men and women. While women’s utility from homemaking is decreasing, payoffs for traditional men occupations are rising. The decision to enter in the labor market is then a function of women’s identity. The upward trend in the female labor participation could be viewed as a switch in the payoffs of being employed. This lifestyle choice is obviously also driven by other factors like wages and fertility.
In this paper, we aim to contribute to the growing research on the determinants of well-being by investigating how subjective well-being was affected by a drastic change in the childcare subsidies policy of one of Canada’s provinces, Québec. In 1997, the Canadian province of Québec launched a major program of subsidized daycare. At the time, barely 74,057 childcare spaces were available at a reduced fee for Québec’s more than 445,000 children under the age of 5, for a coverage of less than 17%. By 2007, the number of subsidized spaces was nearly 200,000 for a total of 389,661 children under 5 in the population, equivalent to a 51% coverage (see Table 2 of Lefebvre and Merrigan, 2008). This policy was combined with $5-per-day before- and after-school day care for kindergarten and primary school children ($7 since 2004). As a result of the policy, women’s labor force participation increased by 13% and their annual hours worked increased by 22% (Lefebvre and Merrigan, 2008).
Québec’s childcare policy is particularly interesting to study because it goes to the heart of one of the possible explanations of the declining female happiness paradox: that increased labor force participation has a negative net effect on well-being. When not
coupled with a decrease in household production, more work time for women results in effect to working a Second Shift, as argued by sociologist Hochschild and co-author Machung (1989). They explained that: “[…] even when husbands happily shared the hours of work, their wives felt more responsible for home and children.” (Hochschild and Machung, 1989, p. 8) This extra burden, whether counted in minutes or in responsibility, could reasonably be expected to decrease subjective well-being. As discussed by Stevenson and Wolfers, “women may simply find the complexity and increased pressure in their modern lives to have come at the cost of happiness.” (Stevenson and Wolfers, 2009, p. 224)
A large body of literature investigates the balance between work and family (Beja 2012; Wright 1978). Men and women react differently to their labor force status. As argued by Booth and van Ours (2009), looking at part-time work and partner’s well-being gives us a clear portrait of the interaction within the family. In Australia, women report higher levels of life satisfaction if their partner works full-time while it is not the case for men. Gender differences have also been found in the relationships between work-family conflicts and life/job satisfaction (Kossek and Ozeki, 1998). This linkage is relatively stronger for women than for men because of the gender role socialization. Moreover, studies suggest that men segment their family and work more than women do (Andrews and Bailyn, 1993; Rothbard, 2001).
Investigating the causal impact of labor force participation on subjective well-being is difficult because of the endogenous character of labor supply: factors that make one happier may be correlated with decisions regarding work, which would bias estimates of the causal impact of interest. To get rid of this bias, it would be tempting to use Québec’s childcare policy change as an instrument for labor force participation. Unfortunately, we cannot ascertain the exogeneity of such an instrumental variable: the change in policy itself might be correlated with factors influencing women’s well-being.
In this paper, we propose to circumvent the issue and estimate the overall impact of a generous childcare policy change on the subjective well-being of Québec’s parents
of children under the age of 5 (the children targeted by the childcare subsidies). We study men as well as women to highlight potential gender differences. While we are not able to distinguish the precise mechanisms that influence parents’ well-being, we believe that knowing the effect of such a policy on well-being is of interest to policymakers and economists alike. Our study could also help to point future research in adequate directions by documenting an association between childcare subsidies and subjective well-being. Further studies could aim to disentangle the relationships between childcare policies, labor force participation and subjective well-being, which we do not allege to do in this paper.
The identification strategy in this article uses the fact that Québec was the only province to change its childcare policy, following the Québec’s government wish to fight family poverty by increasing mothers’ labor force participation and to enhance child development.2 Other provinces had a relatively small number of children attending subsidized daycare centers and this number did not change much over the period studies (see Lefebvre and Merrigan (2008), Table 3). Hence, we may verify if the subjective well-being of parents in Québec increased or decreased compared to parents elsewhere in Canada after the program, but the difference should be larger for parents who have a child under 5 years of age. This technique has been used to explain different phenomena using the same quasi-natural experiment by Lefebvre and Merrigan (2008) and Baker et
al. (2008). On the one hand, availability of childcare services has been shown to be
positively correlated with maternal labor supply by Lefebvre and Merrigan (2008). On the other hand, Baker et al. (2008) confirmed that result and tried to identify the consequences of an increase in the use of childcare and labor supply on the whole family. Mothers were reported to have more depression, there was a negative effect on their relationship satisfaction and there appeared to be, at least in the short term, a deterioration of young children’s outcomes.
2 These two objectives are not the only ones that this program wished to achieve. This province had a very
Our estimates suggest that Québec’s family policies led to a decrease in parents’ subjective well-being independently of the metric used (life satisfaction or happiness). Respondents with a child aged less than 5 who were living in the province of Québec saw a very small decrease in life satisfaction equivalent to 1/20th of a standard deviation after the introduction of the policy. Even though the effect is quite small, it is statistically significant and robust to many specification checks. The negative impact of Québec’s family policies is found for both mothers and fathers. We also explore these findings by socioeconomic group, finding large and positive effects for poor household families and high school graduates. We also find that Québec’s family policies affected negatively married people while unmarried individuals were positively affected. We find similar negative effects on life satisfaction for both men and women, but different effects on satisfaction with work-life balance. This suggests that fathers’ life satisfaction could be influenced by their wives’ labor supply but that their work-life balance could respond to an income effect.
The remainder of this article is structured as follows. After this introduction, we describe the data with detailed information on the particularity of the questions used. Section III presents Québec’s childcare policy and related literature. Section IV presents the methodology. In section V, we present our findings of the impact of the program on parents’ well-being. Section VI concludes.
Section II. Data
This paper proposes to use self-reported subjective well-being data. Kahneman and Krueger (2006) reported that, according to a tabulation of EconLit, over 100 papers were written analyzing well-being data in 2001-2005 compared to only four in 1991-1995. Many economists worry about the validity of subjective data. The order of the questions and the instantaneous mood at the time of the survey have been shown to affect the respondents’ answers. However, measurement error is found in most of the variables commonly used by economists and there is evidence that subjective well-being contains valuable information. For example, Kahneman (1999) reported that heart rate, activity
levels in the left versus right prefrontal lobe, digestive disorders, and headaches are found to be correlated with subjective well-being. Moreover, friends’ and family’s assessments of a person’s well-being are also positively correlated with self-reported well-being, as is the assessment of the person administering the interview. This empirical evidence justifies our choice to use subjective happiness and satisfaction data.
Our data come from Statistics Canada’s Canadian General Social Surveys (CGSS), the first wave of which appeared in 1985. The surveys had a target sample of 10,000 individuals until 1998, subsequently increasing until reaching about 22,000 for the 2010 survey. There are eight different Survey Programs (Health, Time Use, Victimization, Family, Social Engagement, Social support and Aging, Access to and Use of Information and Communication Technologies, and Education, Work and Retirement) which are repeated every five cycles or so. For instance, Family has been the General Social Survey Program for cycles 5, 10, 15 and 20 (1990, 1995, 2001 and 2006). In this study we use only some of the cycles (1986, 1989, 1991, 1996, 1998, 2003, 2005, 2006, 2008 and 2009 for the satisfaction question; 1989, 1990, 1991, 1996, 1998, 2003, 2005 and 2008 for the happiness question) because questions concerning life satisfaction and happiness are not asked every year. We do not use 2007 because the target population of that survey was individuals 45 years of age and older.
A possible limitation in the interpretation of the results is the language used in answering the surveys. More than 20% of the population in Canada speaks French (living mainly in the province of Québec). Hence, we have to be careful and verify if the evolution of the “French” questions is the same as the “English” ones. For instance, before 1998, the question on life satisfaction in the French questionnaire asked your feeling about “life in general” as opposed to “your life” in the English questionnaire (see Appendix Table 1). However, while this may be a serious concern when comparing time trends across provinces, it should be less of an issue given that we use a triple-differences methodology.
We restrict our sample of the CGSS to respondents aged 20 to 49 since they are the most likely to be affected by the policy change. To harmonize the datasets, we rescale the individual sampling weights from each cycle to sum up to one for each year. Life satisfaction and happiness questions changed over time both in their scale and syntax. Appendix Tables 1 and 2 give the exact wording and possible answers for each question used in our analysis. The life satisfaction question is generally worded “How do you feel about your life as a whole right now?” Unfortunately, in 1991 and 1996, the question switched to “Are you satisfied or dissatisfied with your life in general? Is that somewhat or very?” The scale started with a 4-point scale in 1985 and moved to a 10-point scale in 2003. Similarly, the happiness question (usually worded “Would you describe yourself as very happy, somewhat happy, somewhat unhappy, or very unhappy?”) changed over time and its scale switched from 4 to 5 possible answers for the years 1991, 1996 and 2008. For this reason and for the sake of comparability across time, we standardize life satisfaction and happiness for all respondents within each cycle to have a mean of zero and a standard deviation of one. We also verify the robustness of our findings by estimating alternative specifications like ordered probit models. Finally, well-being measures are coded as variables for which higher values indicates greater well-being.
Section III. Québec’s Childcare Policy and Related Literature
In this section, we review the evidence on the effects of Québec’s childcare policy provided in previous research; for a more detailed review, see Baker et al. (2008) and Lefebvre and Merrigan (2008). The provincial government of Québec initiated a childcare policy via the Ministry of the Family in 1997. Children who were 4 years old could go, by October 1997, to any accredited childcare facility where subsidized day care ($5-per-full-day fee policy) was provided. Progressively, accredited childcare facilities offered subsidized day care to younger and younger children until all children under 5 were eligible to attend subsidized care by 2000.3 The exact cost of this program is difficult to estimate but direct public subsidies to childcare services were around $1.4
3 The program has not been able to satisfy the demand for low-fee spaces. A large number of children were
billion for 2002-2003 (Lefebvre et al. 2011). The provincial government aimed to provide 200,000 spaces by 2006. In contrast, the number of subsidized-fee daycare spaces in the rest of Canada was relatively small compared to the province of Québec and barely changing over the period considered (see Lefebvre and Merrigan (2005) for a description of childcare use in the rest of Canada). This childcare policy was combined with many other programs related to the family. Full-time publicly provided kindergarten replaced half-day kindergarten, a new unified tax benefit contingent harmonized with the federal government’s child tax benefit, and also a subsidized before- and after-school day care for kindergarten and grade school children. Finally, formal qualifications were raised for the staff working in accredited childcare facilities.
Using the National Longitudinal Survey of Children and Youth (NLSCY), Baker
et al. (2008) estimated that the rise in childcare was associated, for women in two-parent
families, with an increase of 7.7 percentage points in employment in the province of Québec relative to the rest of Canada. This means that many women are using subsidized care without working since the impact of the program on labor supply is not as large as the impact on childcare utilization. Lefebvre and Merrigan (2008) reported similar findings concerning the increase in labor force participation. Using the Survey of Labour and Income Dynamics (SLID), they also found that the policy increased the annual number of hours worked by 114 hours for better educated and by 133 hours for less educated mothers. The pattern for annual weeks worked and annual earnings was quite similar.4 Lastly, Lefebvre et al. (2009) analyzed the dynamic labor effect of the program. Their study provided empirical evidence that the policy had long-term supply effects on mothers who benefited from the program.
Section IV. Methodology
Since subjective well-being measures are observed for Québec and the rest of Canada for years before and after the policy change, we use a triple-differences approach.
4 One exception is the increase in earnings which is very small for the less educated mothers. The authors
The simplest setup is where we compare young parents’ life satisfaction in Québec and in the rest of Canada, before and after the policy changes, to non-parents and parents of older children. The age of respondent’s youngest single child living in the household (which is not available in 1985) and the respondent’s province jointly determine a parent’s exposure to the program. One specific concern that is not fully addressed by our use of the Québec’s policies as a natural experiment is that we possibly capture only different trends between our control and treatment groups. One obvious advantage of the CGSS is that we do know the age of respondent’s youngest single child living in the household (between 0 and 25 years old). Hence, we are able to verify that families who do not benefit from the childcare policies are not influenced by it. For instance, all children born in 1992 or before were too old in 1998 when the first wave of the policies started. Thus, their parents did not take advantage from the program.
Studies using the NLSCY have to exploit a reference group that was only less affected, which might lead to a bias (Lefebvre and Merrigan, 2005; Baker et al., 2008). The identification assumption may be tested because parents that do not have a child in the age group 0-4 are not exposed to the program and should not differ from parents in a similar situation in other provinces. This technique will give more credibility to our results since we show that life satisfaction of families from Québec with a child in the household who is more than 4 years old (non-treated group) has not significantly changed after the policy change. Furthermore, the question of whether the language used by respondents could bias this study should not be an issue when using this framework.
Our econometric model is as follows:
SWBit = α + β1 Québecit + β2 Child04it + β3 Post1998i + β4 Québecit × Child04it
+ β5 Québecit × Post1998i + β6 Child04it × Post1998i
+ β7 Québecit × Child04it × Post1998i + ζXit + tt+ εit (1)
where SWB is the outcome variable (standardizes life satisfaction or standardized happiness) for respondent i in year t, Québec is an indicator which is set to 1 if the respondent lives in this province, Child04 indicates whether the individual is a parent of a
child who is less than five years old, and Post1998 is a variable that takes the value 1 if the year of the survey is after 1998. The interaction of Québec and Child04 determines the treated group, while the additional interaction with Post1998 shows the effect of the treatment. The coefficient of interest here is thus β7. Xit is a vector containing additional
regressors known to be predictors of subjective well-being such as the age group, educational attainment, declared religion, religion attendance, marital status, household income level group and immigrant status. A time trend is added to the specification in case other time-varying factors correlated with the implementation of the program would explain our results. The interpretation relies on the identification condition that there are no other time-varying shocks that affect the life satisfaction of young parents in Québec or in the rest of Canada. All regressions are weighted using Statistics Canada’s sampling weights, rescaled as described in the Data section.
Section V. Findings
A. Main Results
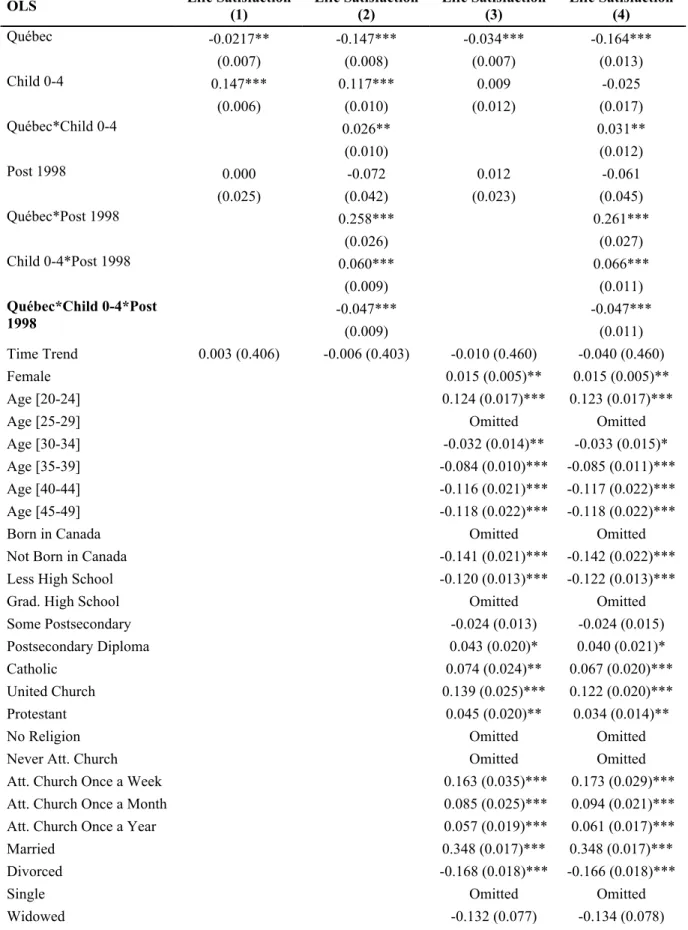
In this section, we report estimates of equation (1) using ordinary least squares (OLS), but alternative specifications like ordered probit models yield similar findings and for brevity are not presented here. Columns 1 and 3 of Table 1 first show the relationship between life satisfaction and the variables that will allow us to determine the treated group and the effect of the treatment. Both columns corroborate the finding of Barrington-Leigh (2010) that respondents in Québec report historically lower levels of life satisfaction compared to the rest of Canada. This relationship is statistically significant both in column 1 where socioeconomic characteristics are not taken into account and in column 2 where they are controlled for. Barrington-Leigh (2010) reported that subjective well-being in the early 1980s was much lower in Québec than in any other province, but has since converged with the rest of the country. Québec’s economic performance does not seem to explain this evolution adequately. The author argued that cultural norms and social context could explain what he dubbed the “Québec Convergence” but demanded further investigation.
Other results in columns 1 and 3 show that having at least one child in the age-group 0-4 is positively associated with life satisfaction. Adding controls reduces the size of the coefficient but a positive and significant relationship still holds. In column 3, women report higher levels of life satisfaction. Being married, being born in Canada, attending church, and being young are all positively associated with the dependent variable. Since a part of the effect of childcare is to increase household income, we do not control for it in our specification.5
Columns 2 and 4 of Table 1 present our estimates of the effect of Québec’s family policy on the life satisfaction of parents of young children (less than five years old) living in this province. These columns present our basic estimates of equation (1) by introducing all possible interactions between Québec, Child04 and Post1998. The coefficient of interest, β7, is on the seventh row. Columns 2 and 4 show respectively the
impact of the program without and with control variables. In both cases, the estimated coefficient is negative and statistically significant at the 5% level. This means that respondents with a child aged less than 5 who were living in the province of Québec saw a very small decrease in life satisfaction equivalent to 1/20th of a standard deviation after the implementation of the policy.6 The introduction of socioeconomic controls does not change the estimated coefficient.
B. Specification Checks
Table 2 repeats the exercise for life satisfaction but includes a variable indicating if the respondent has a child older than 4 years old. This is a good way to verify that Québec’s families who are not beneficiaries of the childcare policies are not influenced by it. The first column of Table 2 reports the findings of the fourth column in Table 1. Column 2 shows that respondents with a child aged more than 4 who were living in the
5 However including household income as a control variable has no effect on the findings presented in this
paper. There is a positive relationship between respondents’ life satisfaction and household income. Many surveys have reviewed the relationship between income and subjective well-being (Clark et al., 2008; Di Tella and MacCulloch, 2006; Frey and Stutzer, 2002). While there is no clear conclusion as to whether more income brings more happiness, the social context and the reference group are among factors determining this relationship.
6 Another way to gauge the size of the effect is to contrast it with other predictors of well-being (see Table
province of Québec were not affected by the programs. The estimate on the interaction between Québec, Child04 and Post1998 (on the eleventh row) is close to zero and not statistically significant.
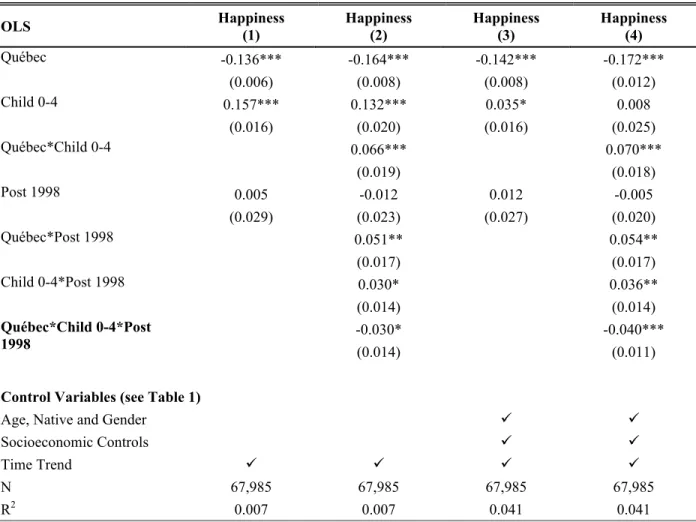
Turning now to a different explained variable, Table 3 shows the effect of the family policies on self-reported happiness. The layout is the same as Table 1. As in Table 1, the coefficients on the Québec variable indicate that, historically, Quebeckers reported lower levels of happiness compared to the rest of Canada. Having a child is positively correlated with well-being, and there is no clear relationship between happiness and the variable Post1998. The coefficients that interest us the most here are those on the seventh row in columns 2 and 4. The estimated coefficients on the interaction between Québec,
Child04 and Post1998 are negative and statistically significant and once again quite
small. Since happiness is likely highly correlated with life satisfaction, this finding is to be expected.
In Table 4, we turn to disaggregating the estimated triple-differences by sex, household income, education levels and demographic groups. To do so, we estimate separate regressions for each sub-group of interest. As a reference, the first row of Table 4 reports the findings of Tables 1 and 3 for the effect of the family policies on the whole sample (β7). Then, the next two rows (Panel A) show the impact respectively on women
and men. Our a priori is that mothers are the ones who are most affected from these family policies: according to the theory of The Second Shift, men segment their family and work more than women do, and women experienced the largest changes in labor supply. The estimated coefficients on the interaction Québec, Child04 and Post1998 are statistically significant when the sample is split by sex and the dependent variable is life satisfaction. This means that, when controlling for socioeconomic characteristics, the family policies affect negatively the life satisfaction of mothers and fathers with a young children living in Québec. Surprisingly, the size of the effect is larger for men, but the gender difference does not appear to be statistically different from zero. This is the opposite when considering the happiness specification: mothers of young children in Québec experienced a statistically-significant drop in happiness of about 1/10th of a
standard deviation, whereas the effect for fathers is positive but small and not statistically different from zero. Once again, the estimated coefficients are quite low.
Evidence for the role of women’s labor force participation in the paradox of
declining female happiness remains elusive. The negative effect for both genders seems
to indicate that the increase in labor force participation of mothers affect also the lifestyle of fathers. Our results indicate that if increased maternal paid work is a channel through which higher childcare subsidies decrease well-being, then it must be that a husband’s life satisfaction is partly determined by his wife’s labor supply, or at least by her own well-being. It is possible that childcare policies bring more stress to both parents and that this makes children less satisfied which would cause negative externalities on parents. Indeed, Baker et al. (2008) found that children affected by Québec’s subsidies policy are worse off in terms of health, motor, social, anxiety and aggressiveness indicators. Even if our estimated effect of the program on parental well-being is small, our results do go in the same direction as those of Baker et al. (2008). In their study, mothers reported more depression because of the program and there was a negative effect on the relationship satisfaction. One advantage of the CGSS is the size of the dataset, which allows us to investigate in more details these findings by estimating separate regressions for several subgroups.
So far, the childcare policy appears to have been ineffective in increasing the well-being of parents in Québec. One of the goals of this policy was to fight poverty among parents with young children. One might thus argue that the absence of a positive effect for all parents is not surprising since the effect should be on poor households, who otherwise would not be able to afford decent childcare. Panel B examines this hypothesis by separately estimating our baseline model for low income household (bottom quartile), middle income household (second and third quartiles) and high income household (top quartile).7 The results for middle income households, presented in the second row of Panel B, go in a similar direction to those for the whole sample: the effect on life
7 Household income of respondents is available in categories in the CGSS. The number and value of
satisfaction is a highly statistically significant decrease of about 0.12 of a standard deviation, while that on happiness is a much smaller (and not statistically significant) decrease of 0.005. The first row of Panel B shows a clear and positive impact of the policy on poor households. The estimated coefficient on the triple interaction between
Québec, Child04 and Post1998 is positive and statistically significant at the 1% level.
The effect is quite large and is equivalent to a change in life satisfaction of around 0.15 of a standard deviation (a change in happiness of around 0.19). The effects of the program on parents in top household income are also positive and statistically significant for the life satisfaction specification. However, the effect is negative for top household income when turning to the happiness variable. These two findings are difficult to reconcile. Note that similar numbers are found when estimating Panel B separately by gender (results not presented here).
These results emphasize the role of women’s labor force participation, given that poor households are the ones who benefit the most from the program. One interpretation of this finding of a large and positive effect for the bottom household income quartile may come from the reduction of poverty among Québec’s parents. The $5-per-day-per-child policy reduced the cost of raising $5-per-day-per-children and increased significantly the labor supply of mothers, resulting in increase in disposable income. Our findings of a positive effect of the policy change could thus be imputed to an income effect. Readers should however be aware that income is endogenous to the labor force participation which could bias our estimates if the impact of the policies goes through the increase in labor force. One way to solve this problem is to look at the impact of the program by education group instead of by income quartile.
Lefebvre et al. (2009) reported that the policies had long-term labor supply effects on mothers who benefited from the program (with a young child) and that this change was driven mainly by less educated mothers. This calls for one more specification check which is presented in Panel C. Each row restricts the sample to a particular education group (less than high school, high school diploma, some postsecondary schooling, and postsecondary diploma). For instance, the first row presents our model estimated only for
respondents who did not graduate high school: the effect is negative and slightly larger than in the full sample. The second row estimates our model for high school graduates. If the program affects parents’ well-being through the increase in employment of mothers, then we should expect a large impact on less-educated women as their labor force participation is lower to begin with. And indeed, the coefficient is large (one-fourth of a standard deviation in life satisfaction), positive and statistically significant at the 1% level. Rows 3 and 4 report the impact of the childcare policies on parents who have some postsecondary education or a postsecondary diploma. The effect of the program is negative in both rows and statistically significant. Findings are somewhat different in column 2. The impact on self-reported happiness is small and insignificant when the sample is restricted to high school graduates.
Panel D presents the effect of the program by marital status. The sample is restricted respectively to married (first row) and unmarried (second row, divorced, single and widowed). The signs of the coefficients of interest are dissimilar. We find a positive impact for unmarried parents but a negative effect for married parents. The standard error is bigger for unmarried parents which explains why the impact is not statistically significant for the life satisfaction. For married individuals, the size of the coefficients is small and similar to the ones estimated on the whole sample. The positive effect for unmarried parents could be interpreted as an income effect in a similar fashion as the positive effect found for parents with low levels of education or low incomes.
In a further set of robustness checks, we verify whether the question order has an effect on our findings (results not shown but available from the authors upon request). We keep only three years (1998, 2003 and 2005) where the question before happiness is the same (a question on stress). This is also a good way to check if the standardization affects our findings since the scale is the same for these years. First of all, the findings are similar when using either the raw happiness or the standardized happiness variable. Secondly, when the sample is restricted to respondents who did not graduate high school and to respondents who did graduate high school, we find large and positive impact (both
statistically significant). The effect is very small for the whole sample and not statistically significant.
We also test whether our main findings are affected by the fact that the personal sampling weights from each cycle are rescaled to sum up to one for each year. Sampling weights are used in this study to have nationally representative samples. The number of observations varies from wave to wave which explains our decision to rescale each year equally. Our choice to include sampling weights has no impact on our analysis. Similar findings are obtained when sampling weights are not included. Additionally, alternative methods of statistical inference do not alter the main findings of this paper. Clustering either on year or pre/post policy do not give statistically significant results that differ from those presented in this paper (clustering on province does not assume a temporal break in the dependence). As a final test, we also tried dropping years of data one by one, both before and after the policy change, and found no significant differences in our estimates.
C. Balance Between Job and Home Life
Up to now, we have documented a generally negative effect (albeit small) of the low-fee childcare policy in Québec on life satisfaction of both mothers and fathers. Since it is primarily women who changed their labor force participation following the policy change (men’s labor force participation remained relatively stable), the relationship between childcare policies, labor supply and well-being must be different for men or women, or must take into account total household labor supply rather than individual labor supply. To shed light on the issue, we now look at self-reported work-life balance. Table 5 shows that the childcare policies in Québec changed significantly the way fathers and mothers appreciate the balance between their job and their home life. This table presents the estimates of equation (1) using standardized answers to the question “How satisfied are/were you with the balance between your job and home life?” as the dependent variable. The sample here is restricted to individuals having a job which means that there is a sample selection.
Column 1 first shows the findings for the whole sample while columns 2 and 3 restrict the sample to women and men respectively. The results suggest that the childcare policies in Québec have led to a decrease of mothers’ satisfaction with the balance between their job and home life, but to an increase for fathers. The findings for women are thus consistent with the Second Shift theory: higher childcare subsidies facilitate work, but work in itself does not mean less work at home, so women actually experience a net decline in their satisfaction with their work-life balance. The findings for men appear consistent with literature results showing that men are better able to segment their family and work life. Increased childcare subsidies and childcare spaces could make life easier for men, and coupled with their wives working could induce an income effect. A positive effect on men’s work-life balance also implies that men do not take into account their wives’ labor supply or well-being when answering questions regarding their own work-life balance, whereas they appear to do so when considering their overall life satisfaction.
Section VI. Conclusion
Using a triple-differences framework, we investigated the effect of a very generous change in childcare subsidies policy on subjective well-being and found that Québec’s family policy led to a small decrease (1/20th of a standard deviation) in parents’ self-reported well-being. While we acknowledge that our results are driven by more than one mechanism, we are struck by the heterogeneity of the effect when looking at separate subcategories of our data. We find no significant gender differences in the impact of the policy change on mothers’ and fathers’ life satisfaction. We also find larger and positive effects of the policy for low income households, for parents with a high school diploma and for unmarried individuals, suggesting the possibility of an income effect. Indeed, the generous childcare policy increased disposable incomes of poor households relatively more than those of richer households.
The findings of this paper have possible political implications for governments and policy makers. In particular, they highlight some consequences related to childcare
policies and, more generally, labor force status of women. One intriguing aspect is that both fathers and mothers are affected by these social policies in terms of their reported life satisfaction. We did however uncover interesting gender differences when looking at the impact of the policy on happiness or on self-reported satisfaction of work-life balance. Consistent with Hochschild’s Second Shift theory, mothers appear to be negatively affected by a policy which facilitated increased labor force participation. Fathers reported more satisfaction with their balance between job and life at home, perhaps revealing an income effect. Our results are consistent with men taking their wives’ labor supply or well-being into account into their evaluation of their own life satisfaction, but not when considering their work-life balance. Future research should try to disentangle the mechanisms affecting parents’ well-being through childcare subsidies.
Bibliography
Akerlof, G. A. and R. E. Kranton (2000). “Economics and Identity,” The Quarterly
Journal of Economics, 115(3), 715–753.
Andrews, A. and L. Bailyn (1993). “Segmentation and Synergy: Two Models linking Work and Family,” In J. C. Hood (ed.), Men, Work, and Family: 262–275. Newbury Park, CA: Sage.
Baker, M., J. Gruber and K. Milligan (2008). “Universal Child Care, Maternal Labor Supply, and Family Well-Being,” Journal of Political Economy, 116(4), 709–745.
Barrington-Leigh, C. P. (2011). “The Québec Convergence and Canadian Life Satisfaction 1985–2008,” Research Paper, December.
Beaudry, P. and T. Lemieux (1999). “Evolution of the Female Labour Force Participation Rate in Canada, 1976–1994: a Cohort Analysis,” In: A Symposium on Canadian Labour Force Participation in the 1990s, Special Issue of Canadian Business Economics, 7(2), 57–70.
Beja, Jr., E. (2012). “Who is happier: The housewife or working wife?,” MPRA Paper 37551, University Library of Munich, Germany.
Blanchflower, D. G. and A. J. Oswald (2004). “Well-Being Over Time in Britain and the USA,” Journal of Public Economics, 88(7–8), 1359–1386.
Booth, A. L. and J. C. Van Ours (2009). “Hours of Work and Gender Identity: Does Part-Time Work Make the Family Happier?,” Economica, 76(301), 176–196.
Clark, A., P. Frijters and M. Shields (2008). “Relative Income, happiness, and Utility: An Explanation for the Easterlin Paradox and Other Puzzles,” Journal of Economic
Literature, 46(1), 95–144.
de Beauvoir, S. L. E. M. B. (1949). The Second Sex. Random House Canada, translated by Constance Borde and Sheila Malovany-Chevallier, 2011.
Di Tella, R. and R. MacCulloch (2006). “Some Uses of Happiness Data in Economics,”
Journal of Economic Perspectives, 90(12), 2161–2186,.
Frey, B. S. and A. Stutzer (2002). “What Can Economists Learn from Happiness Research?,” Journal of Economic Literature, 40(2), 402–435.
Herbst, C.M. (2011). “Paradoxical’ Decline? Another Look at the Relative Reduction in Female Happiness,” Journal of Economic Psychology, 32(5), 773-788.
Hochschild, A. R. with A. Machung (1989). The Second Shift. NewYork: Viking, Penguin Books USA Inc.
Kossek, E. E., and C. Ozeki (1998). “Work-Family Conflict, Policies, and the Job-Life Satisfaction Relationship: A Review and Directions for Organizational Behavior-Human Resources Research,” Journal of Applied Psychology, 83, 139–149.
Lefebvre, P., P. Merrigan and F. Roy-Desrosiers (2011). “Québec’s Childcare Universal Low Fees Policy 10 Years After: Effects, Costs and Benefits,” Cahiers de recherche 1101, CIRPEE.
Lefebvre, P., P. Merrigan and M. Verstraete (2009). “Dynamic Labour Supply Effects of Childcare Subsidies: Evidence from a Canadian Natural Experiment on Low-Fee Universal Child Care,” Labour Economics, 16(5), 490–502.
Lefebvre, P. and P. Merrigan (2008). “Child-Care Policy and the Labor Supply of Mothers with Young Children: A Natural Experiment from Canada,” Journal of Labor
Economics, 26(3), 519–548.
Lefebvre, P. and P. Merrigan (2005). “The Québec’s Experiment of $5 per Day per Child Childcare Policy and Mother’s Labor Supply: Evidence Based on the Five Cycles of the NLSCY, ” Working paper, Université du Québec à Montréal, August.
Rothbard, N. P. (2001). “Enriching or Depleting? The Dynamics of Engagement in Work and Family Roles,” Administrative Science Quarterly, 46, 655–684.
Sousa-Poza A. and A. A. Sousa-Poza (2003). “Gender differences in job satisfaction in Great Britain, 1991-2000: permanent or transitory?,” Applied Economics Letters, Taylor and Francis Journals, vol. 10(11), pages 691-694.
Stevenson, B. and J. Wolfers (2009). “The Paradox of Declining Female Happiness,”
American Economic Journal: Economic Policy, 1(2), 190–225.
Wright, J. (1978). “Are working women really more satisfied? Evidence from several national surveys,” Journal of Marriage and Family, 40(2): 301-313.
Table 1 - Relationship Between Childcare Policies in Québec and Life Satisfaction
OLS Life Satisfaction (1) Life Satisfaction (2) Life Satisfaction (3) Life Satisfaction (4)
-0.0217** -0.147*** -0.034*** -0.164*** Québec (0.007) (0.008) (0.007) (0.013) 0.147*** 0.117*** 0.009 -0.025 Child 0-4 (0.006) (0.010) (0.012) (0.017) 0.026** 0.031** Québec*Child 0-4 (0.010) (0.012) 0.000 -0.072 0.012 -0.061 Post 1998 (0.025) (0.042) (0.023) (0.045) 0.258*** 0.261*** Québec*Post 1998 (0.026) (0.027) 0.060*** 0.066*** Child 0-4*Post 1998 (0.009) (0.011) -0.047*** -0.047*** Québec*Child 0-4*Post 1998 (0.009) (0.011) Time Trend 0.003 (0.406) -0.006 (0.403) -0.010 (0.460) -0.040 (0.460) Female 0.015 (0.005)** 0.015 (0.005)** Age [20-24] 0.124 (0.017)*** 0.123 (0.017)***
Age [25-29] Omitted Omitted
Age [30-34] -0.032 (0.014)** -0.033 (0.015)*
Age [35-39] -0.084 (0.010)*** -0.085 (0.011)***
Age [40-44] -0.116 (0.021)*** -0.117 (0.022)***
Age [45-49] -0.118 (0.022)*** -0.118 (0.022)***
Born in Canada Omitted Omitted
Not Born in Canada -0.141 (0.021)*** -0.142 (0.022)***
Less High School -0.120 (0.013)*** -0.122 (0.013)***
Grad. High School Omitted Omitted
Some Postsecondary -0.024 (0.013) -0.024 (0.015)
Postsecondary Diploma 0.043 (0.020)* 0.040 (0.021)*
Catholic 0.074 (0.024)** 0.067 (0.020)***
United Church 0.139 (0.025)*** 0.122 (0.020)***
Protestant 0.045 (0.020)** 0.034 (0.014)**
No Religion Omitted Omitted
Never Att. Church Omitted Omitted
Att. Church Once a Week 0.163 (0.035)*** 0.173 (0.029)*** Att. Church Once a Month 0.085 (0.025)*** 0.094 (0.021)*** Att. Church Once a Year 0.057 (0.019)*** 0.061 (0.017)***
Married 0.348 (0.017)*** 0.348 (0.017)***
Divorced -0.168 (0.018)*** -0.166 (0.018)***
Single Omitted Omitted
N 90,265 90,265 90,265 90,265
R2 0.004 0.007 0.044 0.047
Note: Authors’ calculations from the Canadian General Social Survey (1986-2009). All estimates are weighted and the personal sampling weights from each cycle are rescaled to sum up to one for each year. Robust standard errors are in parentheses, clustered by province.
Significant at the ***[1%] **[5%] *[10%] level.
Table 2 - Childcare Policies and Life Satisfaction
OLS Life Satisfaction (1) Life Satisfaction (2)
-0.164*** -0.173*** Québec (0.013) (0.012) -0.025 -0.008 Child 0-4 (0.017) (0.021) 0.031** 0.040** Québec*Child 0-4 (0.012) (0.015) -0.061 -0.045 Post 1998 (0.045) (0.051) 0.261*** 0.261*** Québec*Post 1998 (0.027) (0.020) 0.066*** 0.049*** Child 0-4*Post 1998 (0.011) (0.008) -0.047*** -0.047*** Québec*Child 0-4*Post 1998 (0.011) (0.008) 0.036* Child Older than 4
(0.019) 0.024 Québec*Child Older than 4
(0.019) -0.041 Child Older than 4*Post 1998
(0.025) -0.001
Québec*Child Older than 4
*Post 1998 (0.025)
Control Variables (see Table 1)
Age, Native and Gender
Socioeconomic Controls
Time Trend
N 90,265 90,265
R2 0.047 0.047
Note: Authors’ calculations from the Canadian General Social Survey (1986-2009). All estimates are weighted and the personal sampling weights from each cycle are rescaled to sum up to one for each year. Robust standard errors are in parentheses, clustered by province. Significant at the ***[1%] **[5%] *[10%] level.
Table 3 - Relationship Between Childcare Policies in Québec and Happiness
OLS Happiness (1) Happiness (2) Happiness (3) Happiness (4)
-0.136*** -0.164*** -0.142*** -0.172*** Québec (0.006) (0.008) (0.008) (0.012) 0.157*** 0.132*** 0.035* 0.008 Child 0-4 (0.016) (0.020) (0.016) (0.025) 0.066*** 0.070*** Québec*Child 0-4 (0.019) (0.018) 0.005 -0.012 0.012 -0.005 Post 1998 (0.029) (0.023) (0.027) (0.020) 0.051** 0.054** Québec*Post 1998 (0.017) (0.017) 0.030* 0.036** Child 0-4*Post 1998 (0.014) (0.014) -0.030* -0.040*** Québec*Child 0-4*Post 1998 (0.014) (0.011)
Control Variables (see Table 1)
Age, Native and Gender
Socioeconomic Controls
Time Trend
N 67,985 67,985 67,985 67,985
R2 0.007 0.007 0.041 0.041
Note: Authors’ calculations from the Canadian General Social Survey (1986-2009). All estimates are weighted and the personal sampling weights from each cycle are rescaled to sum up to one for each year. Robust standard errors are in parentheses, clustered by province.
Table 4 - Estimates by Sex, Household Income Group, Education Group and Demographic Group
Estimated Triple-Differences
OLS Life Satisfaction (1) Happiness (2)
-0.047*** -0.040*** Whole Sample (0.011) (0.011) Panel A. By Sex -0.039** -0.095*** Women (0.016) (0.017) -0.057* 0.019 Men (0.029) (0.019)
Panel B. By Household Income Group
0.151*** 0.185*** Low Household Income
(0.043) (0.045) -0.116*** -0.005 Middle Household Income
(0.011) (0.025) 0.102*** -0.262*** High Household Income
(0.029) (0.035)
Panel C. By Education Group
-0.088* -0.016
Less than High School
(0.047) (0.071)
0.223*** 0.0029
Grad. High School
(0.054) (0.017) -0.125*** 0.137 Some Postsecondary Education (0.035) (0.075) -0.084*** -0.137*** Postsecondary Diploma (0.020) (0.039)
Panel D. By Demographic Group
-0.045*** -0.038* Married
(0.013) (0.017)
0.040 0.073**
Unmarried: Divorced, Single,
and Widowed (0.054) (0.029)
Control Variables (see Table 1)
Socioeconomic Controls
Time Trend
Note: Authors’ calculations from the Canadian General Social Survey (1986-2009). All estimates are weighted and the personal sampling weights from each cycle are rescaled to sum up to one for each year. Robust standard errors are in parentheses, clustered by province. Each block shows the results of one regression. The first column presents the coefficients on the interaction “Québec*Child0-4*Post1998” when the dependent variable is life satisfaction. The second column presents the coefficients on the interaction “Québec*Child0-4*Post1998” when the dependent variable is happiness.
Table 5 - Satisfaction with the Balance Between Job and Home Life OLS Balance Job/Home Both Genders (1) Balance Job/Home Women Only (2) Balance Job/Home Men Only (3) -0.225*** -0.186*** -0.261*** Québec (0.017) (0.028) (0.010) -0.064*** 0.009 -0.122*** Child 0-4 (0.007) (0.038) (0.031) -0.023** 0.056 -0.068** Québec*Child 0-4 (0.008) (0.033) (0.030) -0.067 -0.004 -0.130 Post 1998 (0.048) (0.029) (0.076) 0.292*** 0.260*** 0.321*** Québec*Post 1998 (0.029) (0.033) (0.030) -0.032 -0.145*** 0.060*** Child 0-4*Post 1998 (0.024) (0.042) (0.014) 0.032 -0.088** 0.112*** Québec*Child 0-4*Post 1998 (0.021) (0.039) (0.010)
Control Variables (see Table 1)
Socioeconomic Controls
Time Trend
N 39,265 20,502 18,763
R2 0.015 0.019 0.0176
Note: Authors’ calculations from the Canadian General Social Survey (1990, 1998, 2003, 2005 and 2008). All estimates are weighted and the personal sampling weights from each cycle are rescaled to sum up to one for each year. Robust standard errors are in parentheses, clustered by province. This Table shows estimated coefficients from estimating an OLS on a standardized variable (Satisfaction between job and home life).
Appendix Table 1 – Wording and Scale of Life Satisfaction Questions in the CGSS
Question (English) Question (French)
The question before was
about... Type of Question
GSS Number
and Year Cycle
How do you feel about your life as a whole
right now?
Quel sentiment éprouvez-vous à l'égard
de la vie? Mental Health
Very dissatisfied (1) to very satisfied (10)
GSS 23
(2009) Victimization How do you feel about
your life as a whole right now?
Quel sentiment éprouvez-vous à l'égard
de la vie?
Mental Health Very dissatisfied (1) to very satisfied (10) GSS 22 (2008) Network Social
How do you feel about your life as a whole
right now?
Quel sentiment éprouvez-vous à l'égard
de la vie?
Satisfaction about
Finances Very dissatisfied (1) to very satisfied (10) GSS 20 (2006) Transitions Family How do you feel about
your life as a whole right now? Quel sentiment éprouvez-vous à l'égard de la vie? Satisfaction about Finances Very dissatisfied (1) to very satisfied (10) GSS 19 (2005) Time use How do you feel about
your life as a whole right now?
Quel sentiment éprouvez-vous à l'égard
de la vie?
Satisfaction about
Finances Very dissatisfied (1) to very satisfied (10) GSS 17 (2003) Engagement Social How do you feel about
your life as a whole right now?
Quel sentiment éprouvez-vous à l'égard
de la vie?
Self-Esteem Very satisfied (1) to very dissatisfied (4) GSS 12 (1998) Time use
Are you satisfied or dissatisfied with your life in general? Is that somewhat or very?
Êtes-vous satisfait ou insatisfait de votre vie
en général? Plutôt ou très?
Stress Very satisfied (1) to very dissatisfied (4) GSS 11 (1996) community Social and support
Are you satisfied or dissatisfied with your life in general? Is that somewhat or very?
Êtes-vous satisfait ou insatisfait de votre vie
en général? Plutôt ou très? Satisfaction about Job or Main Activity Very dissatisfied (1), somewhat dissatisfied (2),
dissatisfied degree not stated (3), somewhat satisfied (4), very satisfied
(5), satisfied degree not stated (6)
GSS 6
(1991) Health
How do you feel about your life as a whole
right now? Quel sentiment éprouvez-vous à l'égard de la vie en général? Self-Esteem Strongly dissatisfied (1), somewhat dissatisfied (2), somewhat satisfied (3), strongly satisfied (4), satisfied degree not
specified (5)
GSS 4
(1989) Education and work
How do you feel about your life as a whole
right now?
Quel sentiment éprouvez-vous à l'égard
de la vie en général? Self-Esteem
Very satisfied (1) to very
dissatisfied (4) (1986) GSS 2 Time use How do you feel about
your life as a whole right now?
Quel sentiment éprouvez-vous à l'égard
de la vie en général? Friendships
Very satisfied (1) to very dissatisfied (4)
GSS 1 (1985)
Health and social support
Appendix Table 2 – Wording and Scale of the Happiness Questions in the CGSS
Question (English) Question (French)
The question
before
was... Type of Question
GSS Number
and
Year Cycle
Would you describe yourself as being USUALLY:
Vous décririez-vous comme étant
HABITUELLEMENT:
Chronic Conditions
5 choices: happy and interested in life (1) to so unhappy that life is not worthwhile (5)
GSS 22
(2008) Network Social
Presently, would you describe
yourself as: Présentement, diriez-vous que vous êtes: Stress
4 choices: very happy (1) to very unhappy
(4)
GSS 19
(2005) Time Use
Presently, would you describe yourself as:
Comment vous décririez-vous en ce moment?
Diriez-vous que Diriez-vous êtes : Stress
4 choices: very happy (1) to very unhappy
(4)
GSS 17
(2003) Engagement Social
Presently, would you describe yourself as:
Présentement, diriez-vous
que vous êtes: Stress
4 choices: very happy (1) to very unhappy
(4)
GSS 12
(1998) Time Use
Would you describe yourself as being USUALLY:
Vous décririez-vous comme étant
HABITUELLEMENT:
Hands and Fingers Limitations
5 choices: happy and interested in life (1) to so unhappy that life is not worthwhile (5) GSS 11 (1996) Social and community support
Would you describe yourself as being USUALLY:
Vous décririez-vous comme étant
HABITUELLEMENT:
Dexterity Problems
5 choices: happy and interested in life (1) to
very unhappy (4)
GSS 6
(1991) Health
Would you describe yourself
as: Diriez-vous que vous êtes: Partnership
4 choices: very happy (1) to very unhappy
(4)
GSS 5
(1990) Family and friends
Would you describe yourself
as: Diriez-vous que vous êtes: Labour Union
4 choices: very happy (1) to very unhappy
(4)
GSS 4
(1989) Education and work
Presently, would you describe
yourself as: Présentement, diriez-vous que vous êtes: Number of Sisters
4 choices: very happy (1) to very unhappy
(4)
GSS 2
(1986) Time Use
Would you describe yourself
as: Diriez-vous que vous êtes: Satisfaction Life
4 choices: very happy (1) to very unhappy (4) GSS 1 (1985) Health and social support