HAL Id: hal-00338460
https://hal.archives-ouvertes.fr/hal-00338460
Submitted on 3 Feb 2010HAL is a multi-disciplinary open access archive for the deposit and dissemination of sci-entific research documents, whether they are pub-lished or not. The documents may come from teaching and research institutions in France or abroad, or from public or private research centers.
L’archive ouverte pluridisciplinaire HAL, est destinée au dépôt et à la diffusion de documents scientifiques de niveau recherche, publiés ou non, émanant des établissements d’enseignement et de recherche français ou étrangers, des laboratoires publics ou privés.
Photochromic Hybrid Organic–Inorganic
Liquid-Crystalline Materials Built from Nonionic
Surfactants and Polyoxometalates: Elaboration and
Structural Study
Andreas Poulos, Doru Constantin, Patrick Davidson, Marianne Impéror-Clerc,
Brigitte Pansu, Pierre Panine, Lionel Nicole, Clément Sanchez
To cite this version:
Andreas Poulos, Doru Constantin, Patrick Davidson, Marianne Impéror-Clerc, Brigitte Pansu, et al.. Photochromic Hybrid Organic–Inorganic Liquid-Crystalline Materials Built from Nonionic Surfactants and Polyoxometalates: Elaboration and Structural Study. Langmuir, American Chemical Society, 2008, 24 (12), pp.6285-6291. �10.1021/la8004322�. �hal-00338460�
Photochromic hybrid organic–inorganic
liquid-crystalline materials built from nonionic surfactants and
polyoxometalates: elaboration and structural study
Andreas S. Poulos,§ Doru Constantin, § Patrick Davidson, §,* Marianne Impéror, § Brigitte Pansu, §
Pierre Panine,# Lionel Nicole,+ Clément Sanchez+
Laboratoire de Physique des Solides, Université Paris Sud, CNRS, UMR 8502, F-91405 Orsay Cedex, France, European Synchrotron Radiation Facility, BP 220, F-38043 Grenoble cedex, France, Chimie de la matière Condensée, UMR 7574 CNRS, Université Pierre et Marie Curie, 4 Place Jussieu, 75005 Paris
France.
RECEIVED DATE
TITLE RUNNING HEAD: Polyoxometalate-doped Lα lamellar mesophase
* Corresponding author. E-mail: davidson@lps.u-psud.fr. Tel.: +33 (0)1 69 15 53 93. Fax: +33 (0)1 69 15 60 86.
§ CNRS-Université Paris Sud
# European Synchrotron Radiation Facility + CNRS-Université Pierre et Marie Curie
ABSTRACT. This work reports the elaboration and structural study of new hybrid organic–inorganic materials constructed via the coupling of liquid-crystalline nonionic surfactants and polyoxometalates (POMs). X-ray scattering and polarized light microscopy demonstrate that these hybrid materials, highly loaded with POMs (up to 18 w%), are nanocomposites of liquid-crystalline lamellar structure (Lα), with viscoelastic properties close to those of gels. The interpretation of X-ray scattering data
strongly suggests that the POMs are located close to the terminal –OH groups of the nonionic surfactants, within the aqueous sublayers. Moreover, these materials exhibit a reversible photochromism associated to the photoreduction of the polyanion. The photo-induced mixed-valence behavior has been characterized through ESR and UV-visible-near IR spectroscopies that demonstrate the presence of WV metal cations and of the characteristic intervalence charge transfer band in the near-IR region, respectively. These hybrid nanocomposites exhibit optical properties that may be useful for applications involving UV-light sensitive coatings or liquid-crystal based photochromic switches. From a more fundamental point of view, these hybrid materials should be very helpful models for the study of both the static and dynamic properties of nano-objects confined within soft lamellar structures.
KEYWORDS. Hybrid materials, polyoxometalates, surfactants, liquid crystals, self-assembly, photochromism.
Introduction
The field of organic-inorganic hybrid materials has mushroomed during the last ten years thanks to the detailed understanding of molecular interactions and to the availability of a large library of building blocks.1 Nowadays, molecular approaches to nanomaterials are sophisticated enough for the nanochemists to design numerous molecular species and to elaborate new functional hybrid materials with enhanced properties. Organic–inorganic association represents a creative way to design new materials and compounds for academic research; moreover, their improved or unusual features allow the development of innovative industrial applications. Indeed, in addition to their large diversity in chemical and physical properties and shape, hybrid nanocomposites present the advantage of facilitating both integration and miniaturization, therefore suggesting promising applications in many fields. (Protective and decorative coatings, micro-optics, micro-electronics, ionics and mechanics, functional membranes or barriers, catalysis, sensors, photovoltaic and fuel cells, bioactive hybrids, dental applications, nanocomposites with anti-inflammability properties, etc.2) Association of inorganic and organic components is also an efficient and useful tool for designing complex nanostructured dense or porous architectures.3 Indeed, hybrid materials comprised of surfactants have raised worldwide interest for the production of mesoporous matrices.4 In this context, materials scientists have investigated the association of molecular or polymeric surfactants with all kinds of inorganic moieties that can be sol-gel derived oligomers or well-defined NanoBuilding Blocks (NBBs) such as clusters or nanoparticles.5
Among NBBs, polyoxometalates (POMs) deserve special attention due to their very well-defined and elegant molecular structures and to their many original physical and chemical properties, which make them interesting compounds for applications in catalysis, electrochemistry, and even in biology.6 However, the use of POMs is badly restricted by processing difficulties due to their very large solubility in aqueous solution. This led various teams to produce hybrid materials where POMs are dispersed within, for example, silica or polymer matrices.7 The association of the negatively charged POMs with various cationic surfactants was also recently reported by several research groups that employed an 3
ionic self-assembly strategy to produce Langmuir-Blodgett films, different kinds of mesophases, and even single crystals.8
In this work, we use a different strategy where we dope the lamellar liquid-crystalline Lα phase (i.e. a
stack of hydrophobic fluid membranes separated by aqueous regions) of a nonionic commercial surfactant, named Brij30 (essentially C12EO4, Figure 1a), with large amounts (up to about 18 w%) of
POMs. Phosphodecatungstic acid [H3PW12O40] (Figure 1b) was used as the inorganic NBB because it is
one of the simplest commercially available POMs, it is extremely soluble in water, and it was the subject of countless reports in the literature.6,9 We thus obtained, in a very general way, hybrid materials that combine the interesting electronic properties of POMs with the alignment and processability of liquid-crystalline phases. Here, we describe the elaboration of this doped lamellar mesophase, its molecular organization, and its photo-induced optical properties that may open opportunities for applications involving UV-light sensitive coatings, liquid-crystal based photochromic switches, oxygen sensors, etc.
In contrast with previous work, we associated this inorganic nano-building block with a nonionic surfactant so that the organic-inorganic association is based not on covalent bonding but only on weak interactions such as hydrogen, Van der Waals or solvation bonds. This should allow for better dynamics and therefore let the nanocomposite system reach complete thermodynamic equilibrium with faster kinetics. Moreover, because of the absence of specific interactions, we expect that the features described here should be fairly general to this class of systems.
We report the phase diagram of these hybrid materials as a function of surfactant overall volume fraction in the mixtures, φSurf, and of the POMs volume fraction in the aqueous medium, φPOM. The
diagrams were obtained by performing optical observations in polarized light and small angle X-ray scattering (SAXS) experiments. The localization of the POMs within the lamellar phase was also inferred from the SAXS data. Finally, we followed the UV-induced reduction of the POMs confined within the lamellar phase by Electron Spin Resonance (ESR) and UV-visible-near IR spectroscopic techniques.
Materials and Methods
Materials
The surfactant Brij30 was purchased from Sigma-Aldrich and used without any further purification. It consists mostly of C12EO4 along with a smaller amount of related CnEOm molecules. Pure C12EO4
(Nikkol, 99%) was also used for comparison. The density of Brij30 is 0.946 g.cm-3 (according to
Sigma-Aldrich); that of C12EO4 is 0.95 g.cm-3(Nikkol). At room temperature, within a given
concentration range (25-85 w%), aqueous solutions of C12EO4 were reported to form a lamellar
mesophase.10
The [PW12O40]3- polyoxometalates were purchased from Sigma-Aldrich either directly in aqueous
solution (100g/L, φPOM= 1.4 %) or in white powder form. These chemicals were used without any
further purification. (Purity 99.995 %.) The weight proportion of water (~ 10%) in the powder was measured by drying at 150°C. The volume of each POM is 0.685 nm3 and its molar mass 2880.17 g.mol
-1, giving a ‘density’ for a POM of 6980 Kg.m-3. Thus, for a solution of M
POM grams of POMs in MW
grams of water, the volume fraction is given by:
W W POM POM POM POM w pom pom POM M M M V V V ρ ρ ρ φ + = + = . The
maximum solubility of [PW12O40]3- in water is 200g/100ml, giving a maximum volume fraction (φPOM)
of about 22%. (We have prepared and used a solution with a maximum φPOM of 15%.)
Sample preparation: All samples were prepared in 4ml tubes. Each tube was rinsed multiple times with Millipore water and then left to dry in an oven. The surfactant was weighed and added first. The volume of the added surfactant, Vsurf, was calculated based on the density of Brij30 (ρ=0.946g/ml).
Then for each ‘line’ of fixed surfactant volume fraction, φsurf, the appropriate amount of POM solution,
Vaq, was calculated using a simple dilution law Vaq =
(
1/φSurf −1)
Vsurf . The correct volume of POMs 5solution was added using a precision micropipette and also weighed to check against its known density. In that way φPOMand φSurf were varied from 0 to 20 % and from 5 to 70 %, respectively.
After adding all the components, the samples were sealed with parafilm and mixed with a vortexer. Finally they were centrifuged (180 g, 5 mins) to collect all material at the bottom of the tube. The samples were stored inside a cupboard to avoid exposure to light and were left to stand for one week before preparation of optical and X-ray capillaries for phase determination. All samples are colorless as long as they are not exposed to UV light. They are visco-elastic liquids. The samples were regularly inspected over up to about a year to notice any evolution with time.
Optical observations
The mixtures were inspected with the naked eye (in natural light and between crossed polarizers) to assess their homogeneity, the number of phases, and to detect any birefringence. Samples suitable for polarized light microscopy were prepared by gently sucking material with a syringe into flat glass capillary tubes (VitroCom Inc., Mt. Lks, N.J.), 50, 100 or 200 µm thick. The capillaries were flame-sealed and also stored in the dark. They were examined with an Olympus BX51 polarizing microscope and their textures were photographed using an Olympus (Camedia C-3030) digital camera. The microscope was also equipped with a Mettler FP52 heating stage.
Small-angle X-ray scattering
SAXS experiments were performed both with a laboratory setup and at the ID02 experimental station of the European Synchrotron Radiation Facility. The laboratory setup has already been described in detail11. It consists of a rotating Cu anode generator (Rigaku), graded layer Ni/C mirror optics (Osmic), vacuum tubes (inserted between the sample and the detection), and a CCD camera (Princeton). The ID02 beamline, which was also described in detail12, allowed us to probe the 0.2-5 nm-1 q-range, where q is the scattering vector modulus q = (4π/λ)sinθ, λ = 0.0995 nm is the wavelength, and 2θ is the 6
scattering angle. Two-dimensional SAXS patterns were recorded using an X-ray image intensifier coupled to a fast read-out CCD (FreLoN) camera with a typical exposure time of 1s. Appropriate corrections were carried out and the data were analyzed with Fit2d (ESRF) and Image (LPS, Orsay) softwares. The scattered intensity (in absolute units) was radially averaged to produce 1-dimensional graphs of the scattered intensity versus scattering vector modulus.
For all SAXS experiments, the samples were held in cylindrical Lindemann glass capillaries (Mark-Rohrchen, Germany) of diameters ranging from 0.5 to 1.0 mm. The capillaries were flame-sealed and submitted to a thermal shock by dipping them in cold water at 0°C just before the measurements in order to obtain a completely random “powder” distribution of lamellar phase domains.
Electron Spin Resonance (ESR) experiments
The ESR experiments were performed with a Bruker Elexsys E500 spectrometer equipped with a SHQ resonator. The ESR spectra were lock-in detected with a modulation of the applied magnetic field at a frequency of 100 kHz and with a 5G amplitude. The field offset of the electromagnet was measured with a DPPH sample with g = 2.0037 ± 0.0002 and is 4.3 ± 0.4 G for spectra near g = 2.
The samples were contained in quartz tubes (diameter of 4 mm) and degassed by freeze-pump-thaw cycling. They were exposed to light delivered by a UV lamp (Bioblock Scientific, λ = 254 nm, power 30 W) for times ranging from 15 minutes to 2 hours in order to produce reduced POM species. They were cooled down with a helium flow ESR900 cryostat from Oxford Instruments.
UV-vis-near IR spectroscopy
UV-visible spectra were recorded with a Varian Cary 5 spectrophotometer in the 200-2000 nm wavelength range. Samples were held in flat quartz cells of 1 mm thickness. Photo-reduced samples, exposed to UV-light in the same conditions as above, were measured against a reference pristine sample (i.e. not exposed to UV-light).
Results
The phase diagram of this system was mapped out as a function of φPOM and φSurf, as shown in Figure
2. A wide single-phase lamellar Lα region was observed, extending up to φPOM ~ 9 % at φSurf = 70 % and
to φPOM ~ 4 % at φSurf = 20 % (Figure 3). This phase could only be obtained for φSurf > 20 %. The
lamellar phase was identified by polarized light microscopy and SAXS experiments. Optical textures, typical of the Lα phase, displayed the usual oily streaks separating regions of homeotropic alignment on
the glass walls of the flat capillaries (Figure 4a). The SAXS patterns (Figure 5) revealed a series of sharp reflections at q-vector moduli in ratios 1:2:3… Since no sharp reflection could be detected at wide angles, X-ray scattering demonstrates that this mesophase is indeed an Lα phase (chains are in a fluid
state).
Another birefringent but very turbid phase was also identified in pure Brij30, at φSurf ~ 10-30 %, and
also at very low φPOM, both by polarized light microscopy and SAXS. It is probably the so-called Lα+
phase reported previously in the phase diagram of the pure C12E4 surfactant.10b This phase shows a
wispy texture that looks nematic at first sight but is made of tiny oily streaks and focal conics. Moreover, its X-ray scattering pattern displays rather sharp peaks even though they are broader than those of the usual Lα phase. The Lα+ phase was interpreted as a textural state of the usual Lα phase10b
but still remains somewhat mysterious. Interestingly, we observe that the Lα+ phase is unstable with
respect to the Lα phase upon doping with POMs, even at φPOM as low as ~ 1 %. This Lα+ phase is
therefore only found in a very small region of the phase diagram and we will not consider it any further. Very concentrated mixtures (φSurf > 70 %) were not investigated because they are too viscoelastic.
Moreover, the interlamellar distance may be too small to accommodate the POMs in such concentrated samples. Indeed, at φSurf = 80 %, the thickness (0.8 nm) of the interlamellar space is smaller than the
average diameter of the POMs (1.09 nm). Very dilute samples, at very low φSurf, are biphasic, with a
turbid whitish phase at the bottom of the test tubes and a transparent isotropic one at the top. (POMs 8
were found in both phases.) The Lα phase, at intermediate dilutions (φSurf ~ 50 %), can accommodate in
its interlamellar aqueous region, a fairly large volume fraction of POMs, extending easily to more than 4 % and even up to about 8 % for slightly more concentrated samples. (All the samples with φPOM > 9 %
are biphasic.) Upon larger doping, the system demixes into a slightly turbid, birefringent lamellar phase at the top of the test tubes and an isotropic one at the bottom. (POMs were found in both phases.) The isotropic phase only gives a weak SAXS peak, which hampers its identification as a L3 (sponge) phase
or a L1 micellar phase. Altogether, higher φPOM can be reached for more concentrated Lα phases; in other
words, the maximum φPOM is an increasing function of φSurf.
We also observed an area ranging from φSurf = 30 % to φSurf = 40 % and φPOM from 1.5 to 3.5 %, where
the Lα phase displays uniform colors in polarized light microscopy and is particularly fluid. This
unexpected feature is presently under study.
Similar experiments carried out with pure C12EO4 instead of Brij30 revealed very similar qualitative
features except that the small Lα+ region was actually not observed (which may be due to the effect of
temperature10b) and that the doping limit of the lamellar phase was reached at smaller φPOM (around
2.5 %). Because of this and because C12EO4 is much more expensive than Brij30, we decided to use this
latter surfactant only, bearing in mind possible applications.
The lamellar period d was measured by SAXS as a function of Brij30 volume fraction at constant φPOM. For a homogeneous Lα phase, at moderate swelling, a linear dependence of d with 1/ φSurf is
expected (Figure 6) with a slope equal to the membrane thickness δ.13 The value obtained here 3.44 nm
compares rather well with the 3.11 nm reported for pure C12EO4 in the literature.14
The number and relative intensities of the different orders of lamellar reflections are clearly altered by the doping at constant φSurf (see Figure 5). Uponincreasing φPOM, more reflections are detected and the
intensity of the second order strongly increases compared to that of the first. This feature, which will be addressed in detail in the discussion section, proves that the POMs are well dispersed in the lamellar phase, at the microscopic level.
The clearing temperature Tc (Lα to isotropic liquid transition) of the lamellar phase strongly decreases
with increasing doping. For instance, at φSurf = 50 %, Tc = 58 °C at φPOM = 4 % whereas it is Tc = 69 °C
for the undoped phase. This depression of the clearing temperature upon doping with POMs is consistent with the thermodynamic effects of impurity addition.15 By slowly cooling samples from the isotropic phase in flat glass capillaries, we were able to grow highly aligned samples in homeotropic orientation that appear quite dark between crossed polarizers (Figure 4b).
Preliminary rheological experiments (to be published elsewhere, in more detail) demonstrate viscoelastic behaviour with G”<G’, G’ of the order of a few hundred Pascals, and a yield stress of a few Pascals, for all Lα samples. However, unexpectedly, doping makes the lamellar phase more fluid. The
instantaneous elastic modulus G0 changes from 233 Pa to 182 Pa upon doping the lamellar phase (φSurf =
40 %) with φPOM =2.5%. At the same time, the viscosity changes from 25.1 Pa.s to 8.4 Pa.s (measured at
a constant stress of 20 Pa).
The POM-doped Lα phase is very sensitive to UV-light (and also, to a smaller extent, to natural
light,). Indeed, samples exposed to UV-light turn blue, which is the sign of the transformation of the [PW12O40]3- species into reduced species. The hybrid Lα phase is actually much more sensitive to
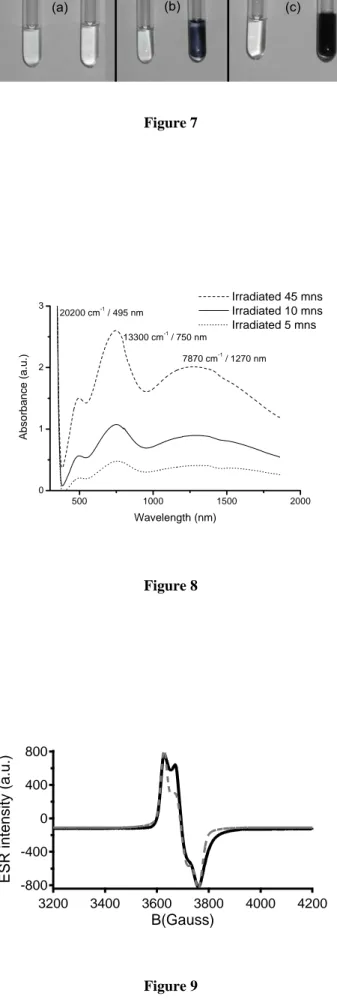
photoreduction than the corresponding POM solution of the same concentration (Figure 7). Hence, the Brij30 surfactant must play a role in this redox reaction. When exposure to UV-light is stopped, the blue color disappears very slowly as dioxygen gradually diffuses from the test tube atmosphere into the sample and reoxidizes the reduced POM species. This reoxidation-induced bleaching can be prevented by carefully purging the test tube atmosphere from dioxygen.
Spectroscopic experiments were performed in order to identify the reduced POM species. The light absorption spectrum of these photochromic compounds (Figure 8) exhibits 3 bands in the visible-near IR range located at 495 nm, 750 nm and 1270 nm. These electronic transitions are close to those reported for one-electron reduced dodecatungstate polyanions.16 They can be assigned to d-d transitions
and to an intervalence transition respectively. 6,16
The frozen ESR spectrum of the LC-POM hybrid phase, recorded at 6 K is shown in figure 9 .This ESR spectrum is typical of a W(V) ion in an orthorhombic ligand field and can be described by the following Zeeman Hamiltonian:
Η = gxβHxSx + gyβHySy + gzβHzSz
The main axis of Landé tensor g is taken along the distortion axis z, i.e., along the W=O bond. The magnetic parameters deduced from a computer simulation, using a Gaussian line shape, are gx = 1.825; gy = 1.818; gz = 1.784 (with an accuracy of 0.003). A line broadening is observed above 20 K and a very
broad signal is observed above 60 K.
Discussion
One of the first issues raised by our work is the localization of the POMs within the Lα phase. We
know that they are rather homogeneously dispersed because no contrast can be seen by optical microscopy in natural light and because X-ray diffraction patterns (both at small and wide angles) are typical of a common Lα phase. Moreover, the lamellar period doesn’t change with the addition of POMs
which is a sign that the system is not biphasic, even at the microscopic level. However, the significant change in the lamellar peak relative intensities points to the fact that the POMs are somehow ‘organized’ inside the Lα phase.
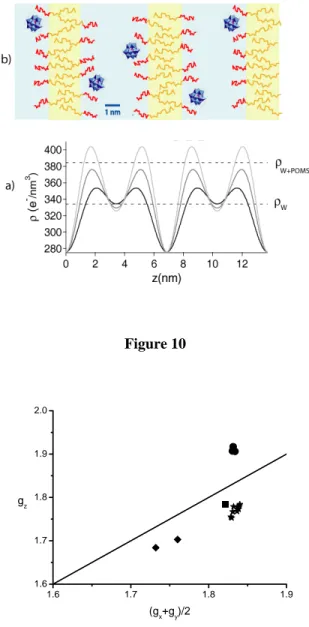
The question of the POMs localization can be addressed by exploiting the integrated intensities of the lamellar reflections which are deeply altered by POM doping. The only information that we can derive relates to the electron density profile ρ(z) along the normal to the layers Oz (Figure 10). Such an approach is actually very classical both for lyotropic lamellar phases of surfactants17 and for smectic phases of thermotropic liquid-crystalline polymers.18 Since the Lα phase is centrosymmetric, ρ(z) can
be expanded in a Fourier series that only involves cosine terms:
∑
∞ = ⎭⎬ ⎫ ⎩ ⎨ ⎧ ⎟ ⎠ ⎞ ⎜ ⎝ ⎛ ± + = 1 2 cos (z) n n ave d nz A
π
ρ
ρ
11The Fourier series coefficient An is proportional to the square root of the integrated intensity of the nth
lamellar reflection. Experimentally, only two or three diffraction orders (with intensities I1, I2 and I3)
have been measured from powder-like samples and hence the absolute values (i.e. not their signs) of the coefficients A1, A2 and A3 were determined. (The powder Lorentz correction (I.q2) has been applied to
the intensities of each peak.)
On the other hand, to determine the sign of each coefficient, we must resort to physical arguments. The expected shape of a typical electron density profile of an undoped lamellar phase is known. In each period, there should be a minimum that corresponds to the low electron density of the paraffinic chains (276e-/nm3); there should also be two maxima that correspond to the hydrophilic heads (340e-/nm3) separated by the water region of slightly lower electron density (333e-/nm3). Some sign combinations are also redundant; we can eliminate half of them by setting the minimum at z = 0 (paraffinic chains). For both the undoped and doped lamellar phases, only one sign combination led to reasonable density profiles.
The following two points have also been used: (1) The average electron density ρave of each sample is
fixed by its composition, and (2) the electron density at the middle of the paraffinic region at z = 0 is fixed at ρmin = 276 e-/nm3, which is the accepted value for C12 chains.19 Two coefficient ratios are then
used for the reconstruction:
1 2 1 2 21 I I A A A = = + and 1 3 1 3 31 I I A A
A = =+ , and ρ(z) can be expressed
as: min 21 31 ))/
(
1 A21 A31)
6 cos( A ) 4 cos( A ) 2 (cos( ) -( (z)= + + + + + d z d z d z ave aveπ
π
π
ρ
ρ
ρ
ρ
In Figure 10a, three reconstructions are compared, with and without POMs (φPOM = 0, 1.7 %, and 3.5
%) at the same Brij30 concentration (φSurf = 50 %). By construction, at z = 0 and z = d = 6.9 nm, the two
profiles show the same minimum corresponding to the paraffinic chains. Without POMs, the profile shows a small increase of the density around z = 2 nm and z = 4.8 nm, corresponding to the hydrated ethylene oxide groups. In between, at about z = 3.4 nm, the reconstruction gives a value of the density close to that of pure water (333 e-/nm3). Interestingly, in this intermediate region, and in the presence of 12
POMs, the value of the electron density remains close to that of pure water, which is much less than the electron density of the 3.5 % POMs solution (385 e-/nm3). In contrast, a strong increase of the density in the polar-head region is observed (up to 405 e-/nm3). This effect is even more important when the POM concentration increases. This strongly suggests that the POMs are mostly located close to the polar-heads and interact with the bilayer surface. Our present understanding of the molecular organization of the hybrid lamellar phase is sketched in Figure 10b. Further structural studies are presently under way in our laboratories in order to reach a more precise description of these materials.
A second issue about the behavior of the POMs in the hybrid lamellar phase is the question of their interaction with the surfactant hydrophilic heads. In previous work, the negatively charged POMs were generally associated with cationic surfactants by very strong attractive electrostatic interactions, which sometimes even led to the crystallization of the materials.8e This strategy makes use of an ionic self-assembly (ISA) mechanism of oppositely-charged moieties that was also invoked for explaining the formation of mesostructured SBA-type silicas templated by Pluronic block-copolymers.20 The POMs are then strongly complexed by the surfactants to the extent that they can sometimes even be extracted and solubilized in organic solvents. In contrast, we associated POMs with nonionic surfactants in an attempt to avoid such strong interactions that may be too specific of a given POM-surfactant pair and that could also have a negative impact on the processability of the hybrid materials. However, our discussion of the electron density profiles proves that there is still an attractive interaction between the POMs anions and the nonionic ethylene-oxide groups. Since the ethylene oxide hydrophilic head of Brij30 is a non-polar nucleophilic moiety, considering any attraction between them and the negatively charged POMs may be a priori surprising. However, this attraction can be mediated by H+ cations that are very probably attracted by the ethylene-oxide groups.21 These H+ cations can in turn attract the POMs at the bilayer surface, which can explain why a rather large amount of POMs can be inserted into the lamellar Lα phase. Such considerations mean that the interaction between membranes would shift
from a Helfrich-type entropic repulsion22 to a more efficient electrostatic one if the bilayers bear some charge excess.
Another interesting feature of this hybrid composite system is that it readily turns blue when exposed to UV light. This photochromic behavior has been studied via ESR and UV visible spectroscopies. The
g values found for these light-irradiated LC-POM hybrid materials can be plotted in a gz versus
((gx+gy)/2) diagram together with reported values for different families of one-electron reduced
polyoxotungstate anions (figure 12).6, ,16 23 The ESR parameters of the photo-reduced polyanion clearly range in the domain found for dodecatungstates polyanions.16,24 The ESR line broadening observed at low temperatures is due to a hopping of the unpaired electron between WV and WVI ions. Such a hopping occurs via tunneling at very low temperatures (20K) and can be thermally activated through the vibrations of the polyanions at higher temperatures (60K).16,23 Moreover a strong intervalence band transition is observed at lowest energy (1270 nm). All these electronic and magnetic features are characteristic of the mixed-valence properties of one-electron reduced tungsten polyanions. These data clearly demonstrate that the structure of the [PW12O40]4- polyanion is conserved after irradiation and that
the intense blue color corresponds to the optically activated transfer occurring in mixed-valence one-electron reduced phosphododecatungstates polyanions.
Assuming that one-electron reduced [PW12O40]4- polyanions are the only species formed upon
UV-light irradiation, the electronic data (optical density of the d-d transitions and molar coefficients of extinction reported in the literature) allow us to estimate the molar concentration of reduced polyoxometalates. It reaches 5 molar % after 5 minutes, 13 molar % after 10 minutes and 33 molar % after 45 minutes of irradiation. This non-linear relation observed at high concentration of reduced species is possibly due to transmission losses resulting from the very strong absorption of the reduced polyoxometalates. The strong coloration is stable when the hybrid material is kept under nitrogen atmosphere. However, in the presence of air, the reduced polyoxometalate anions are back-oxidized by dioxygen in agreement with previously reported studies.25
The photo-assisted reduction of WVI to WV is most probably coupled with the oxidation of the alcoholic polar groups of the Brij30 surfactants which are therefore transformed into carbonylated (aldehydes or carboxylates) species. Indeed, the photochemical reduction of alcohols by H3PW12O40 is
well documented and should occur as well in this context.26 Infrared and Raman studies are in progress to determine the nature of the oxidized organic moieties.
Conclusions
Up to about 10 vol. % [PW12O40]3- ions could be successfully incorporated into the aqueous regions of
the Lα phase of the nonionic surfactant Brij30. The resulting composite material combines the
viscoelasticity and anisotropic properties typical of liquid crystals and the chemical properties of polyoxometalates. The POMs are homogeneously dispersed within the mesophase and the exploitation of the lamellar reflection intensities suggest that the POMs are partially adsorbed onto the polyethyleneglycol brushes that coat the surfactant membranes. The doped Lα phase readily turns blue
when exposed to UV light; it is more sensitive than a POM solution at the same concentration. It is also much more viscoelastic, with rheological properties close to those of gels. Such properties may be interesting for applications involving UV-light absorption coatings. Moreover, very well aligned samples of the POM-doped Lα phase could be produced. The association of the POMs with the nonionic
surfactant membranes does not result from the ionic self-assembly mechanism previously used by other groups to design POM-based hybrid materials but could be mediated by H+ cations. This process can naturally be extended to other nonionic surfactants to control the mesophase type and stability and to other kinds of POMs to exploit other electronic properties. From a more fundamental point of view, these samples will prove very useful in studying both the static and dynamic properties of the POMs, 2-dimensionnally confined within a soft lamellar structure.
ACKNOWLEDGMENT. We thank S.Rouzière and L.Binet for help with the X-ray scattering and ESR experiments respectively, and one of the Reviewers for helpful remarks about the physical interactions and photochemical reactions between the Brij30 hydrophilic headgroups and H3PW12O40.
A. P. acknowledges support from a Marie Curie Action (No. MEST-CT-2004-514307).
FIGURE CAPTIONS.
Figure 1: a) Chemical formula of the Brij30 nonionic surfactant. b) Representation of the PW12O40
3-polyoxometallate. This heteropolyanion of Keggin structure has a phosphorus atom in tetrahedral coordination at its center, surrounded by twelve WO6 octahedra arranged in four groups of three
edge-shared octahedra. These triplets are linked together by sharing corners and are also linked to the central PO4 tetrahedron.
Figure 2: Phase diagram of the (Brij30-H2O-[PW12O40]3-) hybrid system represented as a function of the
overall surfactant volume fraction, φsurf, and the POMs volume fraction in the aqueous medium, φPOM.
The solid circles, solid triangles, and open circles represent the Lα phase, the Lα+ phase, and the
biphasic region, respectively.
Figure 3: Photographs of test-tubes (a) in natural light and (b) in polarized light of a series of samples at constant surfactant concentration (φsurf = 50%) and increasing POM doping (from left to right, φPOM =
0%, 1.7%, 3.5%, and 8.3%). The arrow points to the meniscus between the two phases in the biphasic sample at φPOM = 8.3%.
Figure 4: Observations by polarized light microscopy of the textures of the same capillary (φsurf = 50%,
φPOM = 3.5%) before (a) and after (b) heat treatment. The overall dark appearance of the sample after
heat treatment shows that most lamellae are aligned parallel to the flat faces of the capillary. A faint area of parabolic focal conics persists at the center of the sample. The homeotropic orientation is lost at the edges of the capillary, which shows that the phase is actually Lα. The width of the capillary is 1 mm.
Figure 5: Evolution of the SAXS patterns, at fixed surfactant concentration φsurf = 50%, upon increasing
POM doping (a) φPOM = 0%, (b) φPOM = 1.7%, and (c) φPOM = 3.5%. The ratios of the second and third to
first lamellar peak integrated intensities are: (a) 0.14 and ~ 0, (b) 0.7 and ~ 0, (c) 2.2 and 0.02.
Figure 6: Dilution law, d versus φSurf, of the Brij30 Lα lamellar phase. A linear fit, d = δ/φSurf, provides
the width of the bilayer: δ = 3.4 nm.
Figure 7: Photographs of two test-tubes filled with (left) a solution of POMs and (right) the doped lamellar phase, at the same POM concentration (1.7%), recorded after UV-light exposure for (a) 0 min, (b) 15 mins, and (c) 60 mins.
Figure 8: Visible and near-infrared spectra of a doped lamellar phase (φSurf = 50%, φPOM = 3.5%) after
UV irradiation. Curves (a), (b) and (c) are from samples irradiated for 5, 10 and 45 minutes respectively.
Figure 9: ESR spectrum of a doped lamellar phase, of composition φsurf = 50% and φPOM = 3.5%,
recorded at 6K. The dashed line shows the best fit to the spectrum.
Figure 10: (a) Electronic density reconstruction based on lamellar peak integrated intensities for three samples with φSurf = 50%. The black, dark grey and light grey curves correspond to φPOM = 0%, 1.7%
and 3.5%, respectively. The horizontal lines represent the electronic densities of water (334 e-/nm3) and of a POM solution with φPOM = 3.5% (385 e-/nm3). (b) Tentative sketch (to scale) of the molecular
organization of the POM-doped lamellar Lα phase. The aqueous medium is represented in light blue and
the hydrophobic membranes are shown in light yellow. The C12 paraffinic chains are depicted in dark
yellow and the EO4 chains are in red.
Figure 11: Diagram gz vs. (1/2)(gx + gy) for one-electron reduced polytungstates:
()( W6O19)3- and ( W5NbO19)4- ; ()(XW12O40)n-; (z)(XW18O62)n-; ()(this study)
OH O C H3 4
(a)
(b)
OH O C H3 4(a)
(b)
Figure 1 0.8 0.6 0.4 0.2 0.0φ
Surf 0.08 0.06 0.04 0.02 0.00φ
POML
α2
Φ
L
+ α Figure 2 19Figure 3
Figure 4
1.0 0.8 0.6 0.4 0.2 0.0 Intensity (mm -1 ) 3.5 3.0 2.5 2.0 1.5 1.0 0.5 0.0 q(nm-1) (a) 1.0 0.8 0.6 0.4 0.2 0.0 Intensity (mm -1 ) 3.5 3.0 2.5 2.0 1.5 1.0 0.5 0.0 q(nm-1 ) (b) 1.0 0.8 0.6 0.4 0.2 0.0 Intensity (mm -1 ) 3.5 3.0 2.5 2.0 1.5 1.0 0.5 0.0 q(nm-1 ) (c) Figure 5 8 6 4 2 0 d(nm) 2.5 2.0 1.5 1.0 0.5 0.0 1/φSurf Figure 6 21
Figure 7 500 1000 1500 2000 0 1 2 3 7870 cm-1 / 1270 nm 13300 cm-1 / 750 nm 20200 cm-1 / 495 nm Ab s or banc e (a. u.) Wavelength (nm) Irradiated 45 mns Irradiated 10 mns Irradiated 5 mns Figure 8 -800 -400 0 400 800
ESR intensity (a.u.)
4200 4000 3800 3600 3400 3200 B(Gauss) Figure 9 22
Figure 10 1.6 1.7 1.8 1.9 1.6 1.7 1.8 1.9 2.0 g z (gx+gy)/2 Figure 11 23
24
REFERENCES
(1) (a) Sanchez, C.; Soler-Illia, G.J.D.A.; Ribot, F.; Lalot, T. ; Mayer, C.R.; Cabuil, V. Chemistry of
Materials 2001, 13, 3061-3083 (b) Kickelbick, G. Progress in Polymer Science 2003, 28, 83-114. (c)
Kickelbick, G. Angew. Chem. Int. Ed. 2004, 43, 3102-3104. (d) Functional Hybrid Materials; Gómez-Romero, P., Sanchez, C., Eds; Wiley-VCH: Weinheim, Germany, 2003.
(2) Sanchez, C.; Julian, B.; Belleville, P.; Popall, M. J. Mat. Chem. 2005, 15, 3559-3592.
(3) Sanchez, C.; Arribart, H.; Giraud-Guille, M.M. Nature Materials 2005, 4, 277-288.
(4) (a) Beck, J. S.; Vartuli, J. C.; Roth, W. J.; Leonowicz, M. E.; Kresge, C. T.; Schmitt, K. T.; Chen, C. T.; Olson, D. H.; Sheppard, E. W.; McCullen, S. B.; Higgins, J. B.; Schlenker, J. L. J. Am. Chem.
Soc. 1992, 114, 10834-10843. (b) Zhao, D.; Feng, J.; Huo, Q.; Melosh, N.; Fredrickson, G.; Chmelka,
B.; Stucky, G. D. Science 1998, 279, 548-552. (c) Soler-Illia, G.J.D.; Sanchez, C.; Lebeau, B.; Patarin, J. Chem. Rev. 2002, 102, 4093-4138. (d) Brinker, C.J.; Dunphy, D.R. Curr. Opin. Coll. Interf. Sci. 2006,
11, 126-132. (e) Soler-Illia, G.J.A.A.; Innocenzi, P. Chemistry: a European Journal 2006, 12,
4478-4494. (f) Hoffmann, F.; Cornelius, M.; Morell, J.; Fröba, M. Angew. Chem. Int. Ed. 2006, 45, 3216-3251.
(5) Sanchez, C.; Boissière, C.; Grosso, D.; Laberty, C.; Nicole, L. Chemistry of Materials, in press. (6) (a) Pope, M.T.; Müller A. Angewandte Chemie 1991, 30, 34-48. (b) Katsoulis, D.E. Chem. Rev.
1998, 98, 359-387. (c) Gouzerh, P.; Proust, A. Chem. Rev. 1998, 98, 77-111.
(7) (a) Polarz, S.; Smarsly, B.; Göltner, C.; Antonietti, M. Advanced Materials 2000, 12, 1503-1507. (b) Freund, M.S.; Karp, C.; Lewis, N.S. Inorg. Chim. Acta. 1995, 240, 447-451. (c) Judenstein, P.; Schmidt, H. J. Sol-gel Sci. Tech. 1994, 3, 189-197.
25
(8)(a) ClementeLeon, M; Agricole, B.; Mingotaud, C.; GomezGarcia, C.J.; Coronado, E.; Delhaes, P.
Langmuir 1997, 13, 2340-2347. (b) ClementeLeon, M.; Mingotaud, C.; Agricole, B.; GomezGarcia,
C.J.; Coronado, E.; Delhaes, P. Angew. Chem. 1997, 36, 1114-1116. (c) Polarz, S.; Smarsly, B.; Antonietti, M. ChemPhysChem 2001, 7, 457-461. (d) Zhang, T.; Spitz, C.; Antonietti, M.; Faul, C.F.J.
Chem. Eur. J. 2005, 11, 1001-1009. (e) Nyman, M.; Ingersoll, D.; Singh, S.; Bonhomme, F.; Alam,
T.M.; Brinker, C.J; Rodriguez, M.A. Chemistry of Materials 2005, 17, 2885-2895. (f) Li, W.; Bu, W.; Wu, L., Li, M. Chem. Com. 2005, 3785-3787. (g) Li, W.; Yi, S.; Wu, Y.; Wu, L. J. Phys. Chem. B 2006,
110, 16961-16966. (h) Sun, H.; Li, H.; Bu, W.; Xu, M.; Wu, L. J. Phys. Chem. B 2006, 110,
24847-24854. (i) Moriguchi, I.; Orishikida, K.; Tokuyama, Y.; Watabe, H.; Kagawa, S.; Teraoka, Y. Chemistry
of Materials 2001, 13, 2430-2435. (j) Li, W.; Yin, S.; Wang, J.; Wu, L. Chemistry of materials 2008,
20, 514-522.
(9) Keggin, J.F. Nature 1933, 131, 908-909.
(10) (a) Mitchell, D.J.; Tiddy, G.J.T.; Waring, L.; Bostock, T.; Mc Donald, M.P. J. Chem. Soc.
Faraday Trans I 1983 79, 975-1000. (b) Strey, R. Ber. Bunsenges. Phys. Chem. 1996, 100, 182-189.
(11) Impéror-Clerc, M.; Davidson, P. Eur. Phys. J. B 1999, 9, 93-104.
(12) Narayanan, T.; Diat, O.; Bösecke, P. Nucl. Instrum. Methods Phys. Res. Sect. A 2001, 467, 1005-1009.
(13) Roux, D.; Safinya, C.R. J. Phys. France 1988, 49, 307-318.
(14) Kurtisovski, E.; Taulier, N.; Ober, R.; Waks, M.; Urbach, W. Phys. Rev. Lett. 2007, 98, 258103-1-4.
(15) Oswald, P.; Pieranski, P. Nematic and cholesteric liquid crystals; CRC Press, Taylor and Francis Group: Boca Raton, FL, USA, 2005; Chapter B IX, p 556.
26
(16) Sanchez, C.; Livage, J.; Launay, J.P.; Fournier, M. J. Am. Chem. Soc. 1983, 105, 6817-6823. (17) Zantl, R.; Artzner, F.; Rapp, G.; Rädler, J.O. Europhys. Lett. 1999, 45, 90-96.
(18) Noirez, L.; Davidson, P.; Schwartz, W.; Pepy, G. Liquid Crystals 1994, 16, 1081-1092. (19) Zeng, X.; Liu, Y.; Impéror-Clerc, M. J. Phys. Chem. B 2007, 111, 5174-5179.
(20) Zhao, D.; Huo, Q.; Feng, J.; Chmelka, B.F.; Stucky, G.D. J. Am. Chem. Soc. 1998, 130, 6024-6036.
(21) Alexandridis, P.; Holzwarth, J.F. Langmuir 1997, 13, 6074-6082. (22) Helfrich, W. Z. Naturforsch. 1978, 33a, 305-315.
(23) Sanchez, C.; Livage, J.; Launay, J.P.; Fournier, M.; Jeannin, Y. J. Am. Chem. Soc. 1982, 104, 3194-3202.
(24) Varga, G.M.; Papaconstantinou, E.; Pope, M.T. Inorg. Chem. 1970, 9, 662-667. (25) Weinstock, I.A. Chem. Rev. 1998, 98, 113-170.
(26) (a) Hill, C.L.; Bouchard, D.A. J. Am. Chem. Soc. 1985, 107, 5148-5157. (b) Papaconstantinou, E.; Dimotikali, D.; Politou, A. Inorganica Chimica Acta 1980, 43, 155-158. (c) Dimotikali, D. ; Papaconstantinou, E. Inorganica Chimica Acta 1984, 87, 177-180.