OATAO is an open access repository that collects the work of Toulouse
researchers and makes it freely available over the web where possible
Any correspondence concerning this service should be sent
to the repository administrator:
[email protected]
This is an author’s version published in:
http://oatao.univ-toulouse.fr/23055
To cite this version:
Billaud, Juliette and Clément, Raphaële J. and Armstrong, A. Robert and
Canales-Vázquez, Jesús and Rozier, Patrick
and Grey, Clare P. and
Bruce, Peter G.
β-NaMnO2: A High-Performance Cathode for Sodium-Ion
Batteries. (2014) Journal of the American Chemical Society, 136 (49).
17243-17248. ISSN 0002-7863
β‑NaMnO
2
: A High-Performance Cathode for Sodium-Ion Batteries
Juliette Billaud,
†Raphaële J. Clément,
‡A. Robert Armstrong,
†Jesús Canales-Vázquez,
§Patrick Rozier,
⊥Clare P. Grey,
‡and Peter G. Bruce*
,∥†School of Chemistry, University of St. Andrews, St. Andrews, Fife KY16 9ST, United Kingdom
‡Department of Chemistry, University of Cambridge, Lensfield Road, Cambridge CB2 1EW, United Kingdom
§Renewable Energy Research Institute, University of CastillaLa Mancha, 02071 Albacete, Spain
⊥Institut Carnot CIRIMAT, CNRS UMR 5085, Université Paul Sabatier Toulouse III, Toulouse 31062, France
∥Departments of Materials and Chemistry, University of Oxford, Oxford OX1 3PH, United Kingdom
*
S Supporting InformationABSTRACT: There is much interest in Na-ion batteries for grid storage because of the lower projected cost compared with Li-ion. Identifying Earth-abundant, low-cost, and safe materials that can function as intercalation cathodes in Na-ion
batteries is an important challenge facing the field. Here we
investigate such a material, β-NaMnO2, with a different
structure from that of NaMnO2 polymorphs and other
compounds studied extensively in the past. It exhibits a high
capacity (of ca. 190 mA h g−1at a rate of C/20), along with a
good rate capability (142 mA h g−1at a rate of 2C) and a good
capacity retention (100 mA h g−1after 100 Na extraction/
insertion cycles at a rate of 2C). Powder XRD, HRTEM, and
23Na NMR studies revealed that this compound exhibits a
complex structure consisting of intergrown regions of α-NaMnO2and β-NaMnO2 domains. The collapse of the long-range
structure at low Na content is expected to compromise the reversibility of the Na extraction and insertion processes occurring upon charge and discharge of the cathode material, respectively. Yet stable, reproducible, and reversible Na intercalation is observed.
1. INTRODUCTION
The renaissance of interest in sodium-based rechargeable batteries has been driven by the greater and more uniform Earth abundance of sodium, compared with lithium and, hence,
potentially lower cost.1−6The larger mass of Na, compared with
that of Li, leads to a lower specific capacity for sodium cells, with
respect to equivalent lithium cells, but this is no disadvantage for static applications such as the storage of electricity on the grid. It is the possibility of discovering sodium intercalation (insertion) compounds that might outperform lithium intercalation compounds, leading to a new generation of sodium-based
rechargeable batteries, that is perhaps the most significant
motivation for the investigation of sodium intercalation materials.
Potential sodium intercalation cathodes, such as 3D frame-work compounds, especially those based on the NASICON structure, have received considerable attention because of the
high Na+ conductivity of the solid electrolyte, Na3Zr2Si2PO12,
with a similar structure.1−3,7−10The layered Li transition metal
oxide LiCoO2, and related materials have been the dominant
cathodes for lithium-ion cells.11−16Layered Na transition metal
compounds, NaMO2, exhibit extensive intercalation chemistry,
more so than their Li counterparts. For example, both NaFeO2
and NaCrO2 are electrochemically active in contrast to their
lithium analogues,17,18 and NaMnO2 compounds can sustain
sodium deintercalation without conversion to the spinel
structure, unlike layered LiMnO2.19−21
A number of recent studies on sodium intercalation compounds have focused on Earth abundant and, hence, low-cost transition metals, especially Mn and Fe. Of the layered
NaxMnO2compounds,α-NaMnO2, which exhibits a monoclinic
distortion of the O3 crystal structure of LiCoO2(ABC oxygen
stacking), and P2−Na0.67MnO2(ABBA oxygen stacking) have
been widely studied as sodium positive electrode materi-als.19,22−24 The reversibility of the deintercalation process in
the P2 polymorph is enhanced by Mg doping.25 Similarly,
substitution of Mn by lithium in P2 Nax[Mn1−yLiy]O2
compounds leads to improved reversibility of the charge (that
is, the electrochemical Na insertion) process.26,27Solid solutions
of Mn and Fe, Nax[Mn1−yFey]O2, adopting either O3 or P2
structures, have also been investigated.28,29
β-NaMnO2possesses a different layered structure from that
conventionally adopted by NaMO2type structures. Instead of
planar layers of MnO6octahedra that simply alter their stacking
sequence to generate the different polymorphs (O3, P2, P3,
etc.),30β-NaMnO2is composed of zigzag layers of edge sharing
MnO6octahedra between which Na+ ions reside in octahedral
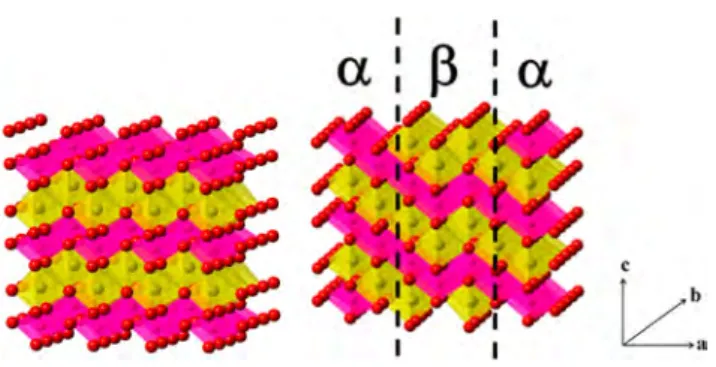
sites, Figure 1.31
The structure possesses an orthorhombic symmetry, space group Pmnm, with cell parameters a = 2.86, b = 4.79, c = 6.33 Å.
The c axis is perpendicular to the layers in this setting.31Sodium
deintercalation was first investigated by Mendiboure et al.,
demonstrating reversible removal of 0.15 Na at a potential of
around 2.7 V vs Na+/Na.22A phase formed upon electrochemical
Na extraction from NaMnO2was identified with the same space
group as the pristine (as-synthesized) phase, but with a
significant reduction of the Jahn−Teller distortion, associated
with Mn3+to Mn4+oxidation. Here we show thatβ-NaMnO2can
exhibit a first discharge capacity (that is, the capacity to
electrochemically reinsert Na in the material) as high as 190
mA h g−1, corresponding to the reinsertion of 0.82 Na per
formula unit. A discharge capacity of ca. 130 mA h g−1is retained
after 100 cycles.
2. EXPERIMENTAL METHODS
2.1. Synthetic Procedures. The β-NaMnO2 samples were prepared by solid-state synthesis. The solid-state route involved mixing together Na2CO3and Mn2O3; 15% weight excess of sodium was used in order to compensate for Na2O evaporation onfiring. Two firing steps were necessary,first at 950 °C for 24 h, after a temperature ramp of 1 °C/min, and second at 950 °C for 24 h, after ramping the temperature at a faster heating rate of 5°C/min. Both firing steps were performed on pellets under oxygen flow, and followed by a quench to room temperature. The samples were then transferred to an Ar-filled glovebox. 2.2. Powder X-ray Diffraction. Powder X-ray diffraction (XRD) was performed on a Stoe STADI/P diffractometer operating in transmission mode with Fe Kα1radiation (λ = 1.936 Å) and using a capillary to avoid contact with the air. The Diffax program was used to model the diffracted intensities.32
2.3.In Situ X-ray Diffraction. In situ X-ray diffraction data were collected on a Bruker D8 diffractometer operating in Bragg−Brentano geometry with Cu Kα1radiation (λ = 1.5416 Å). The setup consisted of an in situ cell with an X-ray transparent Beryllium window (thickness of 200μm). To prevent Be oxidation at high potentials (above 3.8 V vs Na+/Na), a protective Al foil (thickness 10μm) was placed between the Be window and the powder under study. The cell was connected to a Biologic cycler and the evolution of the potential was recorded as a function of the time.
2.4. Transmission Electron Microscopy. TEM was performed on a Jeol JEM 2100 electron microscope operating at 200 kV and equipped
with a double-tilt (±25°) sample holder, an EDS detector (Oxford Link), and an Orius SC200 CCD Camera. TEM specimens were prepared by dispersing the oxides in dry hexane under an inert atmosphere, and depositing a few drops of the suspension on to a holey carbon-coated copper grid (EMS). TEM images were analyzed using the Digital Micrograph software from Gatan.
2.5. Electrode Preparation. Composite electrodes were cast on aluminum foil in an Ar-filled glovebox to prevent air oxidation. The slurry was prepared by mixingβ-NaMnO2, super S carbon, and Kynar Flex 2801 as binder, in weight ratios of 75:18:7, in THF. Electrodes were incorporated into coin cells (CR2325 type) with a sodium metal counter electrode, and with an electrolyte solution composed of 1 M NaPF6in ethylene carbonate/propylene carbonate/dimethyl carbonate, in weight ratios of 45:45:10, respectively. Typical electrode active material loadings were ca. 4−5 mg/cm2. The electrode used for in situ powder X-ray measurements was prepared using the same composition as described above (up to 20 mg per cell), but in powder form. The samples for ex situ measurements (TEM, PXRD, and Na NMR) were prepared by extracting the cathode material from the coin cells and washing it with dry dimethyl carbonate (DMC). The solvent was then evaporated. All steps were performed in an Ar-filled glovebox. The resulting powder was stored in an Ar-filled glovebox for further characterization.
2.6. Electrochemical Measurements. Electrochemical measure-ments were carried out at room temperature using a Maccor Series 4200 battery cycler.
2.7. Solid-State NMR. NMR experiments were performed under 60 kHz MAS, using a 1.3 mm double-resonance HX probe.23Na 1D spin echo spectra were recorded at room temperature on a Bruker Avance III 200 wide-bore spectrometer, at a Larmor frequency of−77.9 MHz, and 23Na NMR chemical shifts were referenced against NaCl.23Na spin echo spectra were acquired using a 90° RF (radio frequency) pulse of 1 μs at 25.04 W, a 180° pulse of 2 μs at 25.04 W, and a recycle delay of 30 ms. 23Na RF pulses were assumed to be selective for the 23Na central transition.
2.8. Chemical Analyses. Chemical analyses were performed by Inductively Coupled Plasma (ICP) emission spectroscopy.
3. RESULTS AND DISCUSSION
3.1. Electrochemistry. β-NaMnO2 samples were
synthe-sized, characterized and incorporated into electrochemical cells as described in the experimental section. Load curves (corresponding to electrochemical Na extraction and
reinser-tion) forβ-NaMnO2are shown in Figure 2.
Figure 1. (a) Schematic representation ofβ-NaMnO2 in the Pmnm space group and (b) intergrowth model betweenα and β-NaMnO2. MnO6octahedra are pink, NaO6octahedra are yellow, and O atoms are red. Adapted from Abakumov et al.36 copyright 2014 American Chemical Society.
Figure 2.Load curves forβ-NaMnO2at a rate of C/20 (10 mA g−1). The 1st, 2nd, 5th, and 10th Na extraction/reinsertion cycles are represented in black, red, blue and green, respectively.
The 200 mA h g−1obtained on thefirst charge commences
with an extended plateau between NaMnO2and a phase with a
composition close to Na0.57MnO2, followed by a rising potential
interrupted by small steps at Na0.49MnO2 and Na0.39MnO2.
These steps are still present upon discharge, but are less pronounced, and the same extended voltage plateau is observed at the end of discharge. There is an irreversible loss of capacity
corresponding to 25 mA h g−1(equivalent to 0.1 Na per formula
unit). The shapes of the load curves are almost invariant on cycling, and only exhibit a small but continuous reduction in capacity associated mainly with the voltage plateau. The 2.7 V plateau is associated with the phase transition between the Jahn− Teller distorted and undistorted structures and exhibits a small polarization (below 150 mV).
3.2. Structural Characterization. 3.2.1. Structure of the As-Prepared Material. To understand the structural changes that accompany sodium deintercalation and reinsertion, the
structure of β-NaxMnO2 was monitored by a combination of
powder X-ray diffraction, solid-state NMR and high-resolution
transmission electron microscopy. The PXRD pattern of the as-prepared material is shown in Figure 3.
It is apparent from Figure 3 that the structure, although clearly
based on that ofβ-NaMnO2, cannot be described by the ideal
structure for this compound, see for example the (011) peak in
the region highlighted by the ellipse. Diffax has been used to
simulate the effect of introducing random stacking faults
corresponding to the insertion of a monoclinicα-NaMnO2cell
between two blocks of orthorhombic symmetry, as shown in
Figure 1.32 Stacking faults are not uncommon in battery
materials.33,34 Those observed here are similar to the
micro-twinning seen in the Ramsdellite form of MnO2, although in
β-NaMnO2there is also a Jahn−Teller distortion.34The stacking
faults in β-NaMnO2 are most closely related to those in the
isostructural and similarly Jahn−Teller distorted LiMnO2
material, albeit in a higher proportion (1−7% occurrence in
LiMnO2).35For β-NaMnO2, the experimental powder di
ffrac-tion pattern is well represented by a structural model composed of 25% stacking faults. Simulations using other proportions of stacking faults are shown in Supporting Information Figure S1.
While the agreement between the experimental powder
diffraction pattern and the simulation pattern with 25% stacking
faults is compelling, and certainly demonstrates that this material
cannot be described by a single structure, Diffax cannot reveal the
detailed nature of the structural complexity. A recent in-depth
HRTEM study of β-NaMnO2 confirms that this material is
composed of structural motifs built from the α and β crystal
structures.36The two structures are energetically very similar and
they can form a low energy phase boundary (a twin plane), where
the MnO6 layers in the α and β phases are oriented at
approximately 60° to each other, as indicated in Figure 1 b).36
Intergrowth of blocks of theα and β-NaMnO2crystal structures
of different sizes leads to various intermediate structures. Our
own TEM data, coupled with NMR data, reinforce this recent interpretation, as shown in Supporting Information Figure S2 and in Figure 4. Our as-prepared material is composed of regions
exhibiting an idealβ-like stacking sequence and regions in which
Figure 3.X-ray diffraction patterns of (a) the ideal β-NaMnO2structure in the Pmnm space group, (b) simulated with 25% stacking faults, (c) as-preparedβ-NaMnO2and (d) after 5 cycles. Highlighted with the blue circle is the major difference between the ideal and experimental data with the (011) peak greatly broadened.
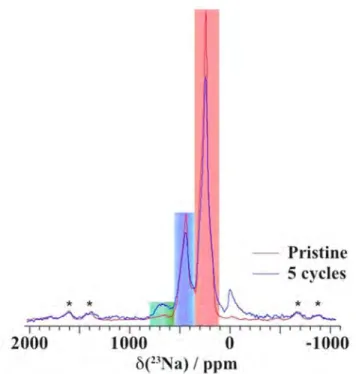
Figure 4.Ex situ23Na spin echo NMR spectra obtained at different stages of thefirst electrochemical cycle, under an external field of 200 MHz and at a spinning frequency of 60 kHz. Spinning sidebands are marked with an asterisk (*). The three regions containing the resonances of Na atoms in a pure α environment, in a pure β environment, and in the vicinity of a stacking fault are highlighted in green, red, and blue, respectively. These regions are not valid for the sample with lowest Na content (Na0.236MnO2), for which significant disorder in the crystal structure leads to broadening of the NMR peaks, and Mn3+to Mn4+oxidation induces a larger Fermi contact shift with all Na resonances being shifted toward the LHS of the spectrum. The peak near 0 ppm is due to Na+in a diamagnetic environment, most probably from residual electrolyte or its decomposition products formed during cycling.
twin planes between theα and β phases lead to stacking faults. Disorder along the c-axis is obvious from the TEM images of the pristine material, indicating some degree of disorder in the as-prepared compound.
The assignment of the two main peaks in the 23Na NMR
spectrum of the pristine phase (Figure 4) was assisted by a
previous NMR study,37and by comparison to the23Na NMR
spectrum collected on the α phase, presented in Supporting
Information Figure S4. The presence of two 23Na NMR
resonances is consistent with a high proportion of defects,
given that the structure of the idealβ structure only has one Na
crystallographic site. A third, low intensity Na peak at ca. 650
ppm matches the Na resonance observed in theα polymorph,
suggesting that there may be a minority of Na sites in regions of
short-range α-like order in the pristine β phase.37 This
observation is in agreement with a previous experimental TEM
and synchrotron powder XRD study on the β polymorph.36
Integration of the spectrum reveals that the two major types of Na environments occur in an approximately 2 to 1 ratio. We assign the main Na resonance, occurring at 237 ppm, to Na in an
ideal β-structure. The second peak has a shift of 433 ppm,
intermediate between the23Na NMR shifts corresponding to the
idealα and β environments (at 656 and 237 ppm, respectively),
and is therefore assigned to a Na environment in the vicinity of a
planar defect. Preliminary DFT calculations of the23Na NMR
parameters on theα and β polymorphs support this assignment
and will be presented in a future publication, along with a more
detailed analysis of stacking fault formation in NaMnO2.
3.2.2. Structural Changes on Cycling. Given the considerable
structural complexity ofβ-NaMnO2, it is remarkable that the load
curve remains relatively invariant on cycling (Figure 2). To investigate the structural changes in more detail, in situ PXRD and ex situ NMR data were collected as a function of charge/ discharge (that is, Na extraction and reinsertion) and are presented in Figures 4 and 5.
Both in situ PXRD and ex situ NMR data are presented with the
unfolded load curve on the left-hand side of the figure, the
diffraction patterns and NMR spectra located at the correct
positions on the charge/discharge curves. The diffraction
patterns associated with the voltage plateaus at the beginning of the Na extraction process, and when Na is fully reinserted, are consistent with a mixture of two phases, with varying ratios but no compositional change, across the plateau. This is perhaps
most evident in the expanded region in Figure 5 from 12 to 15° in
2θ (Cu Kα), where the (001) peak of the β-NaMnO2structure
diminishes in intensity, while the new peak at lower angles
increases. The Na deficient phase with a composition close to
Na0.57MnO2can be assigned to a structure with the same Pmnm
space group but from which the Jahn−Teller distortion has been
removed, leading to significantly different lattice parameters in
close agreement with those reported by Mendiboure et al. for
Na0.91MnO2.
22
However, the overriding conclusion from the in
situ powder X-ray diffraction data is that there is a major collapse
of the long-range structure at low sodium content, with many of the peaks disappearing and those that remain exhibiting
significant broadening in most cases. The loss of order is also
evident from the TEM data acquired on the sample with the
lowest Na content, with an average composition of Na0.23MnO2
in which the crystals develop a mosaic structure of domains, as
shown in Supporting Information Figure S2. The significant
structural disorder at the end of the Na extraction process may result from an increase in the proportion of stacking faults upon Na removal, as indicated in the NMR data.
The23Na NMR spectra collected at different Na compositions
show that the relative intensities of the two major peaks decrease continuously when Na is extracted. The faster rate of decrease of
the peak corresponding to theβ environment, compared to the
peak assigned to Na at the stacking faults, either indicates
preferential extraction of sodium from theβ-NaMnO2regions
and/or may be related to the loss of long-range order observed in TEM and in XRD data: more planar defects are formed as Na is
extracted, leading to fewer Na+in pureβ environments and more
Na+in stacking fault environments. At low Na content, the Na
NMR peaks become broad, confirming a significant disorder in
the material. As expected, an increase in the Na shifts is observed
upon Na removal, as the oxidation of Mn3+to Mn4+leads to a
higher hyperfine shift, the main contribution to the total Na shift
in paramagnetic NaMnO2. A full analysis of the NMR of the
different ex situ samples taken at different points along the first
electrochemical cycle, and a thorough study of the effects of
desodiation upon the magnetism of the NaxMnO2lattice, will be
the subject of a future publication.
While the collapse of long-range order on Na extraction inhibits a detailed understanding of the structure of the Na
deficient materials, it is apparent that the structural changes
observed when Na is extracted are reversed when Na is subsequently electrochemically reinserted in the cathode ma-terial. PXRD, which probes long-range order, together with NMR and HRTEM, which probe short-range order, demonstrate the reversibility of the structure over both length scales. Indeed,
the powder X-ray diffraction patterns during the Na reinsertion
process mirror those acquired when Na is extracted. A
composition of β-Na0.92MnO2, based on the charge passed
during the cycle and confirmed by ICP (Na0.89MnO2), is
obtained at the end of thefirst discharge. The NMR data are also
Figure 5. In situ powder X-ray diffraction patterns of β-NaMnO2 recorded during thefirst electrochemical cycle at C/10 every 0.08 Na+ exchanged. The region between 12 and 15° in 2θ is highlighted in order to show the gradual reduction in intensity of the (001) peak, and the gradual appearance of a peak at lower 2θ angles associated with the two phase deintercalation. The asterisk symbol (*) represents the Be window and the o symbol comes from other components of the in situ cell.
consistent with a high degree of reversibility, with the spectrum
obtained at the end of thefirst discharge comparable to the one
obtained on the pristine material. The TEM data acquired at the end of discharge (Supporting Information Figure S2c) show that the domain structure formed when Na is extracted is retained, however structural order is also restored, in good accord with the PXRD and NMR data.
PXRD, TEM and NMR data collected after 5 full Na extraction/reinsertion cycles, Figure 3, and Supporting In-formation Figures S2d and S3, show that the material exhibits a larger proportion of stacking faults after 5 cycles and an increased
amount of local regions ofα-like Na layer stacking.
Our analysis of the changes in the structure of the cathode
material upon cycling indicates thatβ-NaMnO2has a complex
intergrowth structure and that the long-range order present in the as-prepared material collapses when Na is extracted, and is then recovered when Na is reinserted, but with an increase in the proportion of twin boundaries. Despite these changes, the electrochemistry is very stable on cycling, as shown in Figure 2. This is in contrast to the common expectation that stable and reproducible load curves require minimal structural changes. We interpret the relative insensitivity of the electrochemistry to the
number of twin boundaries as reflecting the similarity in the
energies of theα and β structure types.36Such similarities imply
that the energetics of Na removal, whether fromα, β or the twin
boundaries is similar and dependent primarily on the local
structure around Na+and the electrons (Mn4+/3+). Although a
small polarization (150 mV) is observed along the 2.7 V plateau, the polarization reached a value of 600 mV below x = 0.4. The large cell polarization at low Na content may result from the collapse of the long-range structure. Changes in the structure at short length scales are also observed at low Na content (x < 0.4). The broadening of the Na resonances in the NMR spectrum of
the Na0.236MnO2sample indicates the formation of a range of Na
local environments. The restoration of long-range order and of the structure at short length scales as Na is reinserted, and the stability of the load curve on cycling, indicate that the processes occurring when x < 0.4 are fully reversible.
3.3. Cycling Rate and Stability. The rate performance of
β-NaMnO2is shown in Figure 6.
Thefirst cycles are carried out at a charge and discharge rate of
C/20 (that is, a rate of C/20 for both Na extraction and
reinsertion processes), while subsequent cycles involved charging the cell at a C/4 rate and discharging the cell at increasing C-rates, as indicated in Figure 6. At C/2, a capacity of
150 mA h g−1is obtained, which drops to 90 mA h g−1at 10 C.
When the discharge rate is reduced to C/20, a capacity of 152 mA
h g−1is recovered. Clearly, there is an irreversible loss of capacity
on cycling, as the capacity does not return to its initial value. To explore the cyclability of the material in more detail, continuous cycling at a range of rates was carried out, and is presented in Figure 7.
Except for the data acquired at C/20, the rest of the cycling data were collected with a charge rate of C/4 and with discharge rates indicated in Figure 7. The data obtained upon cycling the cell at equal charge and discharge rates are shown in Supporting Information Figure S5. A comparison of the two sets of data indicates that the kinetics of the Na extraction process are relatively slow, and that the Na extraction capacity decreases markedly with increasing Na extraction rate. Although the capacity is reduced at higher cycling rates, the capacity retention improves. As noted previously, capacity fading at low rates is associated mainly with the voltage plateau at 2.6 V. The load curves obtained at both low and high rates (C/20 and 10C) for cycle number 5 in Supporting Information Figure S6 demonstrate that there is little contribution from the plateau region at these rates, consistent with the fact that the capacity does not fade. The reason the plateau region is not traversed at high rates is that it is associated with a kinetically slow two-phase
process with significantly different lattice parameters between the
Jahn−Teller distorted and undistorted phases. This can be seen
in the GITT plot presented in Supporting Information Figure S6,
where significant polarization is apparent during Na insertion,
along the plateau. It should also be recalled that Mn3+containing
electrodes are prone to some degree of Mn2+dissolution in the
electrolyte, something that will be more prominent near full Na
insertion where the concentration of Mn3+is greatest.
Figure 6.Cycling data forβ-NaMnO2obtained between 2 and 4.2 V vs Na+/Na at various rates and at room temperature. The data were recorded for a single cell, and the applied current was varied every 10 cycles. The Na extraction process was performed at a rate of C/4, and the Na reinsertion process at a rate indicated on top of each set of data, except for the data acquired at a rate of C/20, for which Na extraction was also performed at a rate of C/20.
Figure 7.Values of specific discharge capacities for β-NaMnO2cycled between 2 and 4.2 V vs Na+/Na at room temperature. One hundred cycles are presented for each rate (from C/20 to 10C). The Na extraction process was performed at a rate of C/4, and the Na reinsertion process at a rate indicated on top of each set of data, except for the data acquired at a rate of C/20, for which Na extraction was also performed at a rate of C/20. Black squares correspond to a rate of C/20, purple squares to C/4, green squares to C/4, and blue squares to 10C.
4. CONCLUSIONS
β-NaMnO2has been prepared and characterized using a range of
techniques including PXRD, HRTEM, and 23Na NMR; its
behavior as a cathode material in sodium-ion batteries has been
studied.23Na NMR reveals the presence of Na sites intermediate
between the two Na environments present in the idealα and β
polymorphs, assigned to Na sites in the vicinity of a planar defect between the two polymorphic forms. The high fraction of Na atoms in these intermediate sites indicates a high propensity for
the formation of planar defects inβ-NaMnO2, in agreement with
the Diffax simulations of the XRD data.
This compound exhibits a high discharge capacity of 190 mA h
g−1at low rate of C/20 when tested as a cathode in sodium-ion
batteries. The compound also shows good rate capability with
142 mA h g−1at 2C and 90 mA h g−1at a rate of 10C.
The complex structural changes occurring upon cycling have
been monitored and characterized using in situ XRD,23Na NMR
and HRTEM, showing that the proportion of stacking faults increases upon Na extraction, associated with a loss of crystallinity. Upon Na reinsertion, however, the structure is recovered, although exhibiting increased disorder. In view of the severe order/disorder changes that accompany cycling, the reversibility of the transformation, and associated reproducibility of the load curve, is remarkable, as is the rate capability of the electrode. It is in contrast with common expectation that stable reproducible cycling requires minimal structural change between the structures with highest and lowest Na content, that is, the charged and discharged states.
■
ASSOCIATED CONTENT*
S Supporting InformationSimulations using Diffax, HRTEM images of the pristine sample,
the sample at the end of thefirst charge, the sample at the end of
the first discharge, and after 5 cycles, 23Na NMR of the β
polymorph after 5 cycles andα polymorph, load curves at various
rates and GITT. This material is available free of charge via the Internet at http://pubs.acs.org.
■
AUTHOR INFORMATIONCorresponding Author
Notes
The authors declare no competingfinancial interest.
■
ACKNOWLEDGMENTSWe thank Ieuan Seymour for the synthesis of theα-NaMnO2
polymorph, and for helpful discussion. We would also like to thank Dr. Michal Leskes and Dr. Phoebe Allan for helpful discussion and suggestions. R.J.C. acknowledges support from the European Research Council (ERC). P.G.B. acknowledges support from EPSRC including the SUPERGEN programme. J.C.-V. is grateful to MAT2010-19837-C06-C04 for funding.
■
REFERENCES(1) Kim, S.-W.; Seo, D.-H.; Ma, X.; Ceder, G.; Kang, K. Adv. Energy Mater. 2012, 2, 710.
(2) Ellis, B. L.; Nazar, L. F. Curr. Opin. Solid State Mater. Sci. 2012, 16, 168.
(3) (a) Palomares, V.; Serras, P.; Villaluenga, I.; Hueso, K. B.; González, J. C.; Rojo, T. Energy Environ. Sci. 2012, 5, 5884. (b) Palomares, V.; Cabanas, M. C.; Martínez, E. C.; Han, M. H.; Rojo, T. Energy Environ. Sci. 2013, 6, 2312. (c) Masquelier, C.; Croguennec, L. Chem. Rev. 2013, 113, 6552.
(4) Pan, H.; Hu, Y.-S.; Chen, L. Energy Environ. Sci. 2013, 6, 2338. (5) Slater, M. D.; Kim, D.; Lee, E.; Johnson, C. S. Adv. Funct. Mater. 2013, 23, 947.
(6) Ponrouch, A.; Marchante, E.; Courty, M.; Tarascon, J.-M.; Palacin, M. R. Energy Environ. Sci. 2012, 5, 8572.
(7) Lim, S. Y.; Kim, H.; Shakoor, R. A.; Jung, Y.; Choi, J. W. J. Electrochem. Soc. 2012, 159, A1393.
(8) Jian, Z.; Han, W.; Lu, X.; Yang, H.; Hu, Y.-S.; Zhou, J.; Zhou, Z.; Li, J.; Chen, W.; Chen, D.; Chen, L. Adv. Energy Mater. 2013, 3, 156.
(9) Kang, J.; Baek, S.; Mathew, V.; Gim, J.; Song, J.; Park, H.; Chae, E.; Rai, A. K.; Kim, J. J. Mater. Chem. 2012, 22, 20857.
(10) Saravannan, K.; Mason, C. W.; Rudola, A.; Wong, K. H.; Balaya, P. Adv. Energy Mater. 2013, 3, 444.
(11) Nagura, T.; Tozawa, K. Prog. Batteries Solar Cells 1990, 9, 209. (12) Lu, Z.; MacNeil, D. D.; Dahn, J. R. Electrochem. Solid-State Lett. 2001, 4, 191.
(13) Ohzuku, T.; Makimura, Y. Chem. Lett. 2001, 642, 744. (14) Rosen, E.; Jones, C. D.W.; Dahn, J. R. Solid State Ionics 1992, 57, 311.
(15) Spahr, M. E.; Novak, P.; Schnyder, B.; Haas, O.; Nesper, R. J. Electrochem. Soc. 1998, 145, 1113.
(16) MacNeil, D. D.; Lu, Z.; Dahn, J. R. J. Electrochem. Soc. 2002, 149, A1332.
(17) Yabuuchi, N.; Yoshida, H.; Komaba, S. Electrochemistry 2012, 80, 716.
(18) Komaba, S.; Takei, C.; Nakayama, T.; Ogata, A.; Yabuuchi, N. Electrochem. Commun. 2010, 12, 355.
(19) Ma, X.; Chen, H.; Ceder, G. J. Electrochem. Soc. 2011, 158, A1307. (20) (a) Armstrong, A. R.; Bruce, P. G. Nature 1996, 381, 499. (b) Capitaine, F.; Gravereau, P.; Delmas, C. Solid State Ionics 1996, 89, 197. (c) Doeff, M. M.; Peng, M. Y.; Ma, Y.; De Jonghe, L. C. J. Electrochem. Soc. 1994, 11, L146.
(21) Armstrong, A. R.; Dupre, N.; Paterson, A. J.; Grey, C. P.; Bruce, P. G. Chem. Mater. 2004, 16, 3106.
(22) Mendiboure, A.; Delmas, C.; Hagenmuller, P. J. Solid State Chem. 1985, 57, 323.
(23) Caballero, A.; Hernan, L.; Morales, J.; Sanchez, L.; Santos Pena, J.; Aranda, M. A. G. J. Mater. Chem. 2002, 12, 1142.
(24) Su, D.; Wang, C.; Ahn, H.-J.; Wang, G. Chem. Eur. J. 2013, 19, 10884.
(25) Billaud, J.; Singh, G.; Armstrong, A. R.; Gonzalo, E.; Roddatis, V.; Armand, M.; Rojo, T.; Bruce, P. G. Energy Environ. Sci. 2014, 7, 1387.
(26) Yabuuchi, N.; Hara, R.; Kajiyama, M.; Kubota, K.; Ishigaki, T.; Hoshikawa, A.; Komaba, S. Adv. Energy Mater. 2014, 4, 1301453.
(27) Xu, J.; Lee, D. H.; Clément, R. J.; Yu, X.; Leskes, M.; Pell, A. J.; Pintacuda, G.; Yang, X.-Q.; Grey, C. P.; Meng, Y. S. Chem. Mater. 2014, 26, 1260.
(28) Yabuuchi, N.; Kajiyama, M.; Iwatate, J.; Nishikawa, H.; Hitomi, S.; Okuyama, R.; Usui, R.; Yamada, Y.; Komaba, S. Nat. Mater. 2012, 11, 512.
(29) Mortemard de Boisse, B.; Carlier, D.; Guignard, M.; Delmas, C. J. Electrochem. Soc. 2013, 160, A569.
(30) Delmas, C.; Fouassier, C.; Hagenmuller, P. Phys. B−C 1980, 99, 81.
(31) Parant, J. P.; Olazcuaga, R.; Devalette, M.; Fouassier, C.; Hagenmuller, P. J. Solid State Chem. 1971, 3, 1.
(32) Treacy, M. M.; Deem, M. W.; Newsam, J. M. Diffax, V1.76, 1990. (33) Tessier, C.; Haumesser, P. H.; Bernard, P.; Delmas, C. J. Electrochem. Soc. 1999, 146, 6.
(34) Chabre, Y.; Pannetier, J. Prog. Solid State Chem. 1995, 23, 1. (35) Croguennec, L.; Deniard, P.; Brec, R.; Lecerf, A. J. Mater. Chem. 1997, 7, 511.
(36) Abakumov, A. M.; Tsirlin, A. A.; Bakaimi, I.; Van Tendeloo, G.; Lappas, A. Chem. Mater. 2014, 26, 3306.
(37) Aldi, K. A. A Solid State NMR and EXAFS Study of Manganese Oxide Minerals. Ph.D. dissertation; State University of New York at Stony Brook, Ann Arbor; 2011.
S1 Supporting information
β ββ
β-NaMnO2 : a High Performance Cathode for Sodium-Ion Batteries
AUTHORS: Juliette Billaud, Raphaële J. Clément, A. Robert Armstrong, Jesús Canales-Vázquez, Patrick Rozier, Clare P. Grey and Peter G. Bruce
CORRESPONDING AUTHOR: Peter G. Bruce, email: [email protected]
TABLE OF CONTENTS:
Figure S1. Simulation of β-NaMnO2 with various percentages of stacking faults (from 0% to 30%)
Figure S2. HRTEM images of β-NaMnO2
Figure S3. Comparison of the 23Na NMR spectra acquired on the β-NaMnO
2 pristine phase and after the 5th discharge
Figure S4. Ex situ 23Na spin echo NMR spectra obtained on the pristine α-NaMnO 2 phase
Figure S5. Continuous cycling at equal charge and discharge rates
Figure S6. Load curves at high and low rate obtained on cycle 5 between 2-4.2 V vs. Na+/Na
Figure S7. Results from the Galvanostatic Intermittent Titration Technique between 2-4.2 V vs. Na+/Na
S2 Figure S1. Simulation of β-NaMnO2 with various percentages of stacking faults (from 0% to 30%). The pink pattern represents the simulation closest to the experimental pattern a) 20 40 60 80 In te n s it y ( a r b it r a r y u n it s )
30
25
20
15
10
5
2θθθθ / Fe Kαααα 10
S3 b)
c)
d)
Figure S2. HRTEM images of β-NaMnO2: a) as-prepared; b) at the end of charge, at 4.2 V vs. Na+/Na; c) at the end of discharge, at 2V vs. Na+/Na; d) after 5 full charge/discharge cycles.
S4 Figure S3. Comparison of the 23Na NMR spectra acquired on the β-NaMnO
2 pristine phase and after the 5th discharge. Spinning sidebands are denoted with (*). The three regions containing the resonances of Na atoms in a pure α environment, in a pure β environment, and in the vicinity of a stacking fault are highlighted in green, red, and blue, respectively. The peak near 0 ppm is due to Na+ in a diamagnetic environment, most probably from residual electrolyte or its decomposition productsformed during cycling.
Figure S4. Ex situ 23Na spin echo NMR spectra obtained on the pristine α-NaMnO2 phase under an external field of 200 MHz and at a spinning frequency of 60 kHz. The two regions containing the resonances of Na atoms in a pure α environment and in the vicinity of a stacking fault are highlighted in green and blue, respectively
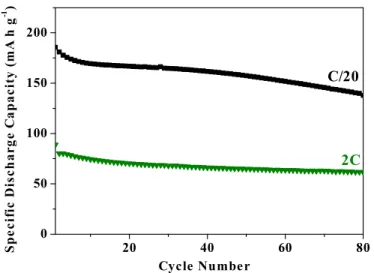
S5 Figure S5. Values of specific discharge capacities for β-NaMnO2 cycled between 2 and 4.2 V vs. Na+/Na at room temperature. 80 cycles are presented for each rate. Charge and discharge rates were identical. Black symbols correspond to a rate of C/20 and green symbols to 2C.
Figure S6. Load curves at high and low rate obtained on cycle 5 between 2-4.2 V vs. Na+/Na. The cycling rate is indicated on the corresponding load curve.
20 40 60 80 0 50 100 150 200 2C C/20 Cycle Numbe r S p e c if ic D is c h a r g e C a p a c it y ( m A h g -1 ) -150 -100 -50 0 2.0 2.5 3.0 3.5 4.0 4.5 10C C C/20 P o te n ti a l (V v s . N a + /N a )
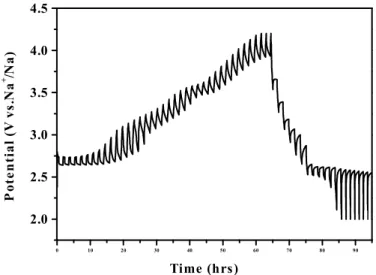
S6 0 10 20 30 40 50 60 70 80 90 2.0 2.5 3.0 3.5 4.0 4.5 P o te n ti a l (V v s .N a + /N a ) Time (hrs)
Figure S7. Results from the Galvanostatic Intermittent Titration Technique between 2-4.2 V vs. Na+/Na. A current of 20 mA g-1 was applied for 30 min followed by a resting period of 75 min.