an author's http://oatao.univ-toulouse.fr/22005
https://doi.org/10.1016/j.ifacol.2018.09.579
Atamuradov, Vepa and Medjaher, Kamal and Camci, Fatih and Dersin, Pierre and Zerhouni, Noureddine
Degradation-level assessment and online prognostics for sliding chair failure on point machines. (2018) In: IFAC SAFEPROCESS 2018, August 2018 (Warsaw, Poland).
Degradation-level Assessment and Online Prognostics for Sliding Chair Failure
on Point Machines
Vepa Atamuradov*, Kamal Medjaher*, Fatih Camci**, Pierre Dersin***, Noureddine Zerhouni****
*Production Engineering Laboratory (LGP), INP-ENIT 47 Av. d’Azereix, Tarbes, 65000, France (Tel: +33 (0)5 62 44 27 19; e-mail: [email protected] , [email protected] ).
**Advanced Micro Devices (AMD), USA (e-mail : [email protected]). ***ALSTOM Transport, 93400 Saint-Ouen, France
(e-mail: [email protected])
****FEMTO-ST Institute, UMR CNRS 6174 – UFC/ENSMM 15B av. des Montboucons, 25000 Besançon, France (e-mail: [email protected] )
Abstract: This paper presents a degradation-level assessment and failure prognostics methodology for degrading systems. The proposed methodology consists of offline and online phases. In the offline phase, different time-domain health indicators (HIs) are extracted and the best indicator of degradation is selected by filter-based methods. Then, a degradation model is defined and its parameters are estimated using the selected HI. In the online phase, the k-means clustering is utilized to detect a change(s) in the system’s health state and to trigger failure prognostics for remaining useful life (RUL) prediction. The degradation model parameters are updated as new data are available, and the RUL is predicted iteratively. The proposed methodology is implemented on point machine sliding chair degradation using in-field condition monitoring (CM) data. The results show that the methodology can be effectively used in machine degradation-level assessment and in online RUL predictions.
Keywords: degradation-level assessment, clustering, change-point detection, failure prognostics, RUL prediction, railway point machines, sliding-chair degradation, predictive maintenance.
1. INTRODUCTION
Machine degradation-level assessment (MDA) is one of the important issues in Prognostics and Health management (PHM) discipline. The MDA analyses the machine failure propagation to get knowledge about the hidden health state transitions either from raw data (e.g. batteries) or from constructed health indicators (HIs), before triggering prognostics tools. Hence, the MDA information can be used in the development of robust prognostics models in incipient failure detection to trigger remaining-useful-life (RUL) prediction for complex systems (e.g. railway point machines, high-speed train bogies, wind turbines, nuclear power plants and aircrafts (X. Wang et al. 2016)).
Railway turnout systems, which consist of sliding-chair plates, point machine, stock rails, locking systems, etc., are used to manage the train turnouts by moving rail blades at a distance. Hence, the point machine health assessment is very crucial to increase operational reliability and passenger safety in railway transportation. In general, there are different types of point machines, such as hydraulic, electro-mechanical and pneumatic (Atamuradov et al. 2009). In (Z. Wang et al. 2016), the authors proposed an integrated feature extraction methodology based on singular value decomposition (SVD) and empirical mode decomposition (EMD) techniques and the Mahalanobis distance metric for fault detection of electro-mechanical point machines using power signals acquired from the point machine test bench. A similar work was also
conducted in (Yoon et al. 2016) using in-field DC current signals based on Dynamic Time Warping (DTW) technique for point machine fault detection. In (Jin et al. 2015), the authors proposed a systematic health assessment methodology for point machine fault diagnostics using simulated failure modes’ data. The power signal was divided into 7 segments using the motor speed parameters and statistical features were extracted from each segment for further analysis. By using self-organizing maps (SOM) and principal component analysis (PCA) techniques, the authors successfully evaluated the methodology in point machine degradation-level assessment and incipient fault detection. In (Asada et al. 2013), the authors proposed a fault diagnostics methodology using Discrete-Wavelets Decomposition (DWT) and Support Vector Machine (SVM) classifier for electro-mechanical point machines. The DWT was employed in feature extraction and reduction steps before SVM based fault classification. The k-means clustering was utilized to select the best DWT type and decomposition level in feature selection and reduction step. Afterward, different failure modes were efficiently classified by kernel-based SVM classifier using DWT kernel-based features. In (Eker et al. 2011; Eker & Camci 2013), the authors presented a state duration based methodology for point machine failure prognostics. The point machine degradation was modeled artificially using an exponential failure propagation function. The proposed methodology gave better RUL prediction results when compared to different prognostics tools. A data-driven failure prognostics model was proposed in (Letot et al. 2015) for point machine health assessment using the power signals
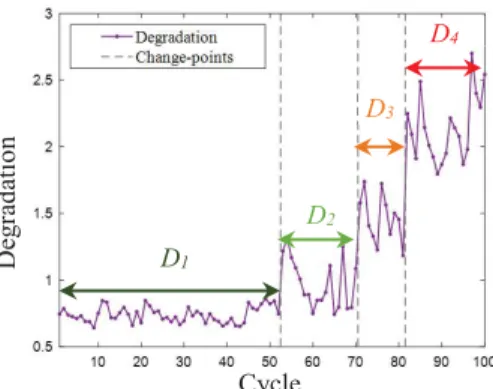
acquired from the test bench. The point machine degradation model, which is the combination of linear and exponential functions, was built using an extracted time-domain based HI to predict the RUL of the system. A generic fault detection methodology was presented in (Atamuradov et al. 2017) based on a segment evaluation and inferential statistics approach. The authors extracted different statistical HIs from the DC current signal of point machine and employed data fusion to construct a unique system HI. The fused HI was further used in fault detection by segment evaluation. In (Ashasi-Sorkhabi et al. 2017), the authors proposed fault detection and prognostics approach for automated people mover train gearbox. The fault detection was carried out online using an extracted HIs from vibration signals and the data-driven prognostics model parameters were updated based on a Bayesian approach and was validated on the periodically logged field data. Air leakage detection and failure prediction approach for the train braking system was proposed in (Lee 2017). A regression classifiers were used in failure modes modeling and a density-based clustering was utilized to detect the leakage anomalies using compressor data. The methodology was efficiently demonstrated in anomaly detection and severity prediction based on logistic function. Several interesting types of research on point machine fault diagnostics can also be found in (García Márquez et al. 2010; García Márquez et al. 2007) papers. Moreover, failure prognostics approaches which were proposed for discrete systems can be found in (Ammour et al. 2017; Yin 2017). As been summarized in the previous paragraph, the point machine health assessment is an important task to increase reliability and safety in railway transportation and very challenging. This could be due to the insufficient data, unavailable failure modes which develop in long-period of time (Eker et al. 2011) and nonlinear system degradation behavior that makes constructing trendable system HIs hard, if not impossible. The sliding chair plates of the point machine can experience different degradation states (i.e. healthy, moderate and severe states) throughout their lifespan before the complete failure. To forecast the future degradation behavior of the sliding chair plates, it is important to detect a change-point(s) that the machine falls into a faulty state from healthy state. In practice, it is important to note that there can be more than one changing point (see Fig. 1) due to some physical phenomena. In this case, each degradation level (D1,2,3,4 in Fig. 1) should be evaluated (i.e. testing the failure severity criteria) differently, and the prognostics should be triggered when the machine switches to a severe health state.
Fig. 1. Machine health state changes.
Therefore, a machine degradation-levels should be properly assessed to detect an incipient fault before triggering a prognostics algorithm. This paper presents a MDA and failure prognostics methodology for point machine sliding chair degradation. In the offline phase of the proposed methodology, different statistical HIs are extracted from in-field condition monitoring (CM) data and selected by filter based HI selection, utilizing monotonicity and similarity statistics. Then, a double exponential degradation model is built and the parameters are estimated using the selected HI. In the online phase, an unsupervised technique, which is k-means, is used to detect the changing point(s) by grouping newly received HI data, before the prognostics. Finally, the prognostics model is triggered to predict the RUL. As new data points are available, the model parameters are re-estimated and the component RUL is predicted iteratively. The main contributions of this work, compared to the reviewed papers are 1) HI selection by two step intraclass and interclass feature analysis using filter methods, 2) unsupervised change-point detection and 3) RUL prediction based on online prognostics model update by windowing approach.
The paper is organized as follows: Section 2 explains the proposed methodology steps. Section 3 presents the sliding chair degradation modeling and the experimental rig setup. The results are presented in Section 4. Section 5 concludes the paper.
2. METHODOLOGY
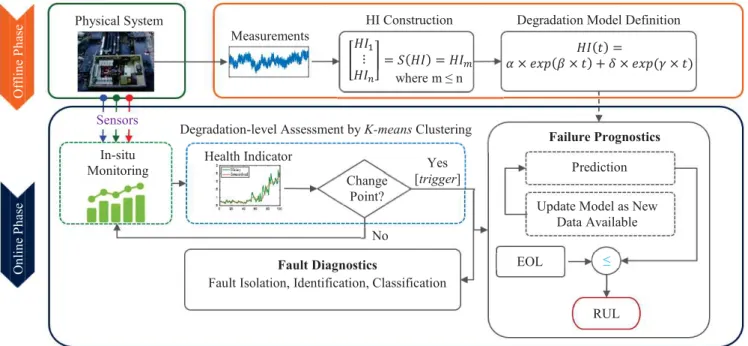
The proposed methodology consists of offline and online phases. In the offline phase, the health indicator construction and the degradation model definition is presented. The online phase includes the clustering based change-point detection and the RUL prediction steps. The general scheme of the proposed methodology is depicted in Fig. 2.
2.1 Health Indicator Extraction and Selection
A HI extraction can be defined as an extraction of useful and important hidden information from raw data that indicates health state transitions in a system degradation. In this paper, time-domain based HIs such as root-mean-square (rms), kurtosis, skewness, crest factor (crfactor), standard deviation (stdev) and peak-to-peak (p2p) are extracted. The HI selection is carried out in two steps. The HIs which have a higher monotonicity value than the calculated sample mean are selected first in step 1 (intraclass analysis). In step 2 (interclass analysis), a similarity matrix is constructed from the selected HIs using the Euclidean distance. The best HI is then selected from the similarity matrix mean which has a minimum distance value. In the intraclass selection, the most trendable HIs are selected and in the interclass selection, the most representative HI is selected among the trendable HIs. The monotonicity is calculated using equation (1) and the Euclidean distance is calculated using equation (2). The similarity matrix (!"#$) is constructed as indicated in equation (3). The most representative HI is selected by using equation (4). $%= &' ()*+,) -./ 012 3 ()*+,) 4. 012 '5 (1) D1 D2 D3 D4 De g ra d ati o n Cycle
Fig. 2. Two-step degradation-level assessment and failure prognostics methodology scheme. where $% is the monotonicity value for the "67 HI (89%). The
absolute value of the difference between number of positive :(;89;
"> <? and negative derivatives :(
;
;89"@ <? gives the monotonicity value. A HI with the higher monotonicity indicates the better degradation with an increasing/decreasing trend.
;"!A:BC D? = EF :BJ H%I2 %3 D%?G (2)
where K is the length of the given HIs B and D.
!"#$ = L;"!A:MP2M2? N ;"!A:MQ P2MO? ;"!A:MOM2? N ;"!A:MOMO? R O×O (3) ST!A89 = min/:U:!"#$?? (4)
where ;"!A:M2MO? is the distance value between the health indicators M2 and MO from the data pool with size $ and U is the similarity mean value.
2.2 Clustering based Degradation-level Assessment
A k-means (Lloyd 1982) unsupervised machine learning technique is adopted in this paper in MDA for change-point(s) detection.
The k-means groups a given X dataset (V = W2C WG…/W0) into C (X = X2C X …/XY) clusters. The similarity degree between the cluster center U% and the data points is based on an Euclidean distance, where " = ZC [C … X. The goal is to minimize the objective function expressed by:
\:UC ]? = ^ ^ ]YC_`W_3 UY`G a YI2 0 _I2 (5) where ]YC_b {<CZ} is the membership value of the data point W_ to the cluster XY. The best partition number can be identified by using cluster validity techniques (Maulik & Bandyopadhyay 2002). In this paper, well-known within cluster consistency evaluation technique, which is Silhouette
(Rousseeuw 1987) evaluation, is adopted for cluster validation.
2.3 Degradation Model for Failure Prognostics
First, the degradation trend of the selected HI is extracted by using a moving average noise filtration technique before the curve fitting step. In this research, a double exponential function, which was proposed in (Skima et al. 2016), is adopted in the sliding chair degradation modeling due to its good degradation representability as given in (6).
c:A?de= f × TWB:g × A? h j × TWB:k × A? (6) where c:A?de is the model output at time A and fC gC jC k are the model parameters. The degradation model parameters are estimated in the offline phase. In the online phase, after the detection of changing point, failure prognostics is triggered to predict the RUL of the sliding chairs. As new data values are available, the model parameters are re-estimated and the system RUL is predicted iteratively until the end-of-life (EOL) threshold is reached. To update the exponential model parameters in the online phase, it is obligatory to have sufficient amount of data points. In this study, the model update is performed after each 5 and 10 time stamps. The RUL prediction accuracy (lopp) is calculated by using equation (7) (Tobon-Mejia et al. 2012).
lopp = 2
qFq•I23rxs/|tuvw:S? 3 tuvy:S?| tuv~ z:S? (7)
where € is the number of data point used in RUL prediction. For the best prediction performance, the lopp produces 1 and 0 for the worst.
3. EXPERIMENTAL SETUP AND DATA COLLECTION Since the point machines are highly reliable systems, the degradation of their components can take a long period of time (Gebraeel, Elwany, & Pan 2009), which makes failure prognostics very hard. To overcome this problem, the sliding
In-situ Monitoring Health Indicator Change Point? No Yes [trigger] H lth Indi
Degradation-level Assessment by K-means Clustering
Fault Diagnostics
Fault Isolation, Identification, Classification
Failure Prognostics
Update Model as New Data Available Prediction EOL ≤ RUL On li n e P h ase O ff lin e P h as
e HI Construction Degradation Model Definition
Measurements Physical System L89P2 890 R = •:89? = 89‚ where m ≤ n 89:A? = f × TWB:g × A? h j × TWB:k × A? Sensors
chair degradation is simulated by an accelerated aging procedure on the real system. The sliding chair plates support the point machines to move the rail blades from normal-to-reverse and normal-to-reverse-to-normal positions. There were totally 12 lubricated (i.e. healthy) sliding chair plates on the turnout system. The first sliding chair failure state was generated by contaminating the farthest 10th, 11th and 12th plates. The second
faulty state was acquired by contaminating the 9th farthest
plate. By adding a new contaminated plate to the faulty group, we generated a complete point machine sliding chair failure. There are totally 10 different health states (10 samples/health state) which were generated by the accelerated aging. The resistive force sensory data has been investigated in this research due to good degradation representation property (Camci et al. 2016; Ardakani et al. 2012). An electro-mechanical point machine, an installed force sensor and the sliding chair plates which were investigated in this current research, are depicted in Fig. 3. The real turnout system and the sliding chair degradation modeling are shown in Fig. 4. The resistive force time series and one sample from each healthy and faulty states of the sliding chair degradation are depicted in Fig. 5.
4. RESULTS AND DISCUSSIONS
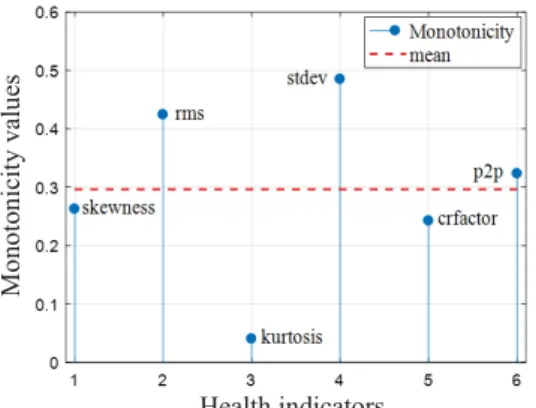
The point machine resistive force measurements went through HI extraction step to reveal the sliding chair plate degradation patterns. Before calculating the monotonicity values, the extracted HIs should be smoothed. The extracted and smoothed HIs by using Moving Average are shown in Fig. 6. As depicted in Fig. 6, the extracted descriptive statistics gave different degradation patterns, where some of them are not correlated with the sliding chair degradation. The extracted HIs went through two- steps: intraclass and interclass HI selection to select the best HI representing the sliding chair failure propagation, as it was explained in section 2. The calculated monotonicity values of the given HIs are shown in Fig. 7. The rms, stdev and p2p have been selected as the most trendable indicators from the intraclass selection, and fed into the interclass selection for the best HI selection. Before building the similarity matrix (equation (3)), the selected HIs
Fig. 3. a) Point machine b) installed force sensor and c) sliding chair plates.
were normalized between [0,1]. The calculated interclass similarity values for the given HIs are presented in Table 1. Based on the proposed filter health indicator selection method,
Fig. 4. Turnout system and sliding-chair degradation simulation.
Fig. 5. a) Force time series and b) healthy, c) faulty data samples for sliding chair degradation.
Fig. 6. Extracted HIs from force measurements.
Time (ms) Time (ms) Time (ms) Sample a) F o rc e (J) b ) F o rc e (J) c) F o rc e (J)
Railway Turnout System
Contaminated Lubricated sk ew n ess rm s k u rto sis std ev crfa cto r p 2 p Cycle Cycle Cycle Cycle Cycle Cycle a) Point Machine b) Force sensor c) Sliding chair plates
Sliding chair plates
Fig. 7. Calculated monotonicity values for a given HIs. Table 1. Similarity matrix for selected HIs.
rms stdev p2p
rms 0 0.34 0.75
stdev 0.34 0 0.50
p2p 0.75 0.50 0
Average 0.54 0.42 0.62
stdev has been selected as the best representative and the most supported HI with minimum distance for the sliding chair degradation. It is also important to note that the selected stdev has the highest monotonicity value (see Fig. 7) compared to the others, which proves the efficiency of the proposed filter method for failure prognostics. The proposed exponential degradation model was fitted to stdev to estimate the model parameters in the offline phase. The estimated degradation model parameters obtained by curve fitting and the goodness of fit (R2) are given in Table 2.
After the degradation model definition in the offline step, the selected HI went through the k-means based change-point detection to trigger failure prognostics for RUL prediction in the online phase. The cluster number was optimized by using Silhouette validation. The maximum Silhouette value refers to the best cluster number. The k-means has efficiently clustered the given HI into two degradation-levels. The change-point detection result is depicted in Fig. 8. The first level corresponds to the healthy state and the second level to the failure state. The last index (cycle # 71) of the 1st
degradation-level is the changing point in the sliding chair degradation, which indicates the incipient failure. The change-point is used to launch the RUL prediction. The RUL prediction results are shown in Fig. 9. After the first trigger, the model parameters are not updated until the new data values are available. In this study, the waiting time was performed using two different window sizes. The purpose was to check the accuracy of the prognostics model with a given amount of data and to optimize the RUL prediction interval for better maintenance planning in machine condition monitoring. The RUL prediction results using window length 5 (W-5) and 10 (W-10) for the model update is given in Fig. 10. As seen from Fig. 10, the W-10 converged to the real RUL faster than the W-5 in its first update process. But using a longer window size can be a disadvantage and can affect maintenance planning negatively, especially for critical components such as sliding chairs. Despite its computational complexity, the W-5 based model updating is more precise than the W-10. The RUL prediction performances for W-5 and for W-10 were calculated as 0.90
and 0.81 using the equation (7). Hence, using a shorter window size in model updating could be more efficient for RUL prediction of critical systems to be used in post-prognostics decision making.
Table 2. Estimated degradation model parameters.
Parameters a b c d R2
Values 0.097 -0.038 0.018 0.038 0.99
Fig. 8. Change-point detection results using k-means.
Fig. 9. RUL prediction (RULr – real and RULp – predicted) after the change-point detection (CP71).
Fig. 10. RUL prediction results using window sizes a) five (W-5) and b) ten (W-10).
5. CONCLUSIONS
In this paper, a degradation-level assessment and an online prognostics approach were proposed for a point machine sliding chair monitoring. The two-step filter method was proposed for HI extraction and selection. A degradation-level
RULr RULp He alt h in d ica to r Cycle CP71 Learning Prediction Prediction horizon RUL Cycle std ev Level-1(healthy) Level-2 (faulty) Health indicators M o n o to n icity v alu es
assessment based on the k-means was performed to detect change(s) in the component health state transitions. The k-means could only detect the bigger change in the health state but was less sensitive to smaller changes in failure propagation, which might mislead to late RUL predictions. The data-driven based prognostics model was developed and the RUL of the system was predicted using two different time stamps and the results were compared.
As a future work, we plan to utilize different change-point detection algorithms which are more sensitive to smaller changes and to develop prognostics approach based on failure severity criteria for systems experiencing different health state transitions (i.e. healthy, moderate, severe, etc.).
6. ACKNOWLEDGEMENTS
This research was supported by a grant from ENIT, Production Engineering Laboratory (LGP), funded by ALSTOM. Point machine degradation datasets were taken from the project # 108M275, which was supported by The Scientific and Technological Research Council of Turkey (TUBITAK).
REFERENCES
Ammour, R. et al., 2017. Fault prognosis of timed stochastic discrete event systems with bounded estimation error. Automatica, 82, pp.35–41.
Ardakani, H.D. et al., 2012. PHM for railway system - A case study on the health assessment of the point machines. 2012 IEEE Int. Conf.on Prognostics and Health Management: Enhancing Safety, Efficiency, Availability, and Effectiveness of Systems Through PHM Technology and Application, Conference Program, pp.1–5.
Asada, T., Roberts, C. & Koseki, T., 2013. An algorithm for improved performance of railway condition monitoring equipment: Alternating-current point machine case study. Transportation Research Part C: Emerging Technologies, 30, pp.81–92.
Ashasi-Sorkhabi, A. et al., 2017. A Condition Based Maintenance Implementation for an Automated People Mover Gearbox. International Journal of Prognostics and Health Management, pp.1–14.
Atamuradov, V. et al., 2009. Failure diagnostics for railway point machines using expert systems. 2009 IEEE International Symposium on Diagnostics for Electric Machines, Power Electronics and Drives, SDEMPED 2009.
Atamuradov, V. et al., 2017. Fault Detection By Segment Evaluation Based On Inferential Statistics For Asset Monitoring. In Annual conference of the Prognostics and Health management Society 2017. pp. 1–10. Camci, F. et al., 2016. Comparison of sensors and
methodologies for effective prognostics on railway turnout systems. Proceedings of the Institution of Mechanical Engineers, Part F: Journal of Rail and Rapid Transit, 230(1), pp.24–42.
Eker, O.F. et al., 2011. A simple state-based prognostic model for railway turnout systems. IEEE Transactions on Industrial Electronics, 58(5), pp.1718–1726.
Eker, O.F. & Camci, F., 2013. State Based Prognostics with
State Duration Information. Quality and Reliability Engineering International.
García Márquez, F.P., Pedregal Tercero, D.J. & Schmid, F., 2007. Unobserved Component models applied to the assessment of wear in railway points: A case study. European Journal of Operational Research, 176(3), pp.1703–1712.
García Márquez, F.P., Roberts, C. & Tobias, A.M., 2010. Railway point mechanisms: condition monitoring and fault detection. Proceedings of the Institution of Mechanical Engineers, Part F: Journal of Rail and Rapid Transit, 224(1), pp.35–44.
Gebraeel, N., Elwany, A. & Pan, J., 2009. Residual life predictions in the absence of prior degradation knowledge. IEEE Transactions on Reliability, 58(1), pp.106–117.
Jin, W. et al., 2015. Development and Evaluation of Health Monitoring Techniques for Railway Point Machines. 2015 IEEE Conference on Prognostics and Health Management (PHM), p.11.
Lee, W., 2017. Anomaly Detection and Severity Prediction of Air Leakage in Train Braking Pipes. International Journal of Prognostics and Health Management. Letot, C. et al., 2015. A data driven degradation-based model
for the maintenance of turnouts: A case study. IFAC-PapersOnLine, 28(21), pp.958–963.
Lloyd, S.P., 1982. Least Squares Quantization in PCM. IEEE Transactions on Information Theory, 28(2), pp.129– 137.
Maulik, U. & Bandyopadhyay, S., 2002. Performance evaluation of some clustering algorithms and validity indices. IEEE Transactions on Pattern Analysis and Machine Intelligence, 24(12), pp.1650–1654.
Rousseeuw, P.J., 1987. Silhouettes-A graphical aid to the interpretation and validation of cluster analysis. Journal of Computational and applied Mathematics, 20, pp.53– 65.
Skima, H. et al., 2016. A hybrid prognostics approach for MEMS: From real measurements to remaining useful life estimation. Microelectronics Reliability, 65, pp.79– 88.
Tobon-Mejia, D.A., Medjaher, K. & Zerhouni, N., 2012. CNC machine tools wear diagnostic and prognostic by using dynamic Bayesian networks. Mechanical Systems and Signal Processing, 28, pp.167–182.
Wang, X. et al., 2016. Remaining useful life prediction based on the Wiener process for an aviation axial piston pump. Chinese Journal of Aeronautics, 29(3), pp.779–788. Wang, Z., Jia, L. & Qin, Y., 2016. An Integrated Feature
Extraction Algorithm for Condition Monitoring of Railway Point Machine. 2016 Prognostics and System Health Management Conference (PHM-Chengdu), pp.1–5.
Yin, X., 2017. Verification of Prognosability for Labeled Petri Nets. IEEE Transactions on Automatic Control, 9286(c).
Yoon, S. et al., 2016. Fault diagnosis of railway point machines using dynamic time warping. Electronics Letters, 52(10), pp.818–819.