Full Terms & Conditions of access and use can be found at
http://www.tandfonline.com/action/journalInformation?journalCode=tphm20
Philosophical Magazine
ISSN: 1478-6435 (Print) 1478-6443 (Online) Journal homepage: http://www.tandfonline.com/loi/tphm20
Structural, elastic, electronic, optical and
thermoelectric properties of the Zintl-phase
Ae
3
AlAs
3
(Ae = Sr, Ba)
A. Benahmed, A. Bouhemadou, B. Alqarni, N. Guechi, Y. Al-Douri, R. Khenata
& S. Bin-Omran
To cite this article: A. Benahmed, A. Bouhemadou, B. Alqarni, N. Guechi, Y. Al-Douri, R. Khenata & S. Bin-Omran (2018): Structural, elastic, electronic, optical and thermoelectric properties of the Zintl-phase Ae3AlAs3 (Ae = Sr, Ba), Philosophical Magazine, DOI: 10.1080/14786435.2018.1425013
To link to this article: https://doi.org/10.1080/14786435.2018.1425013
Published online: 19 Jan 2018.
Submit your article to this journal
View related articles
Structural, elastic, electronic, optical and thermoelectric
properties of the Zintl-phase Ae
3AlAs
3(Ae = Sr, Ba)
A. Benahmeda, A. Bouhemadoua, B. Alqarnib, N. Guechic, Y. Al-Dourid,e , R. Khenataf and S. Bin-Omranb
alaboratory for Developing new Materials and their characterization, University of setif 1, setif, algeria; bDepartment of Physics and astronomy, college of science, King saud University, Riyadh, saudi arabia; cFaculty of science, Department of science of Matter, University of Medea, Medea, algeria; dnanotechnology and catalysis Research center (nanocaT), University of Malaya, Kuala lumpur, Malaysia; eFaculty of science, Physics Department, University of sidi-Bel-abbes, algeria; flaboratoire de Physique Quantique de la Matière et de Modélisation Mathématique (lPQ3 M), Université de Mascara, Mascara, algeria
ABSTRACT
First-principles calculations were performed to investigate the structural, elastic, electronic, optical and thermoelectric properties of the Zintl-phase Ae3AlAs3 (Ae = Sr, Ba) using two complementary approaches based on density functional theory. The pseudopotential plane-wave method was used to explore the structural and elastic properties whereas the full-potential linearised augmented plane wave approach was used to study the structural, electronic, optical and thermoelectric properties. The calculated structural parameters are in good consistency with the corresponding measured ones. The single-crystal and polycrystalline elastic constants and related properties were examined in details. The electronic properties, including energy band dispersions, density of states and charge-carrier effective masses, were computed using Tran-Blaha modified Becke-Johnson functional for the exchange-correlation potential. It is found that both studied compounds are direct band gap semiconductors. Frequency-dependence of the linear optical functions were predicted for a wide photon energy range up to 15 eV. Charge carrier concentration and temperature dependences of the basic parameters of the thermoelectric properties were explored using the semi-classical Boltzmann transport model. Our calculations unveil that the studied compounds are characterised by a high thermopower for both carriers, especially the p-type conduction is more favourable.
1. Introduction
Thermoelectric (TE) materials play an important role in global sustainable energy solution. These materials are investigated not only owing to their high potential
© 2018 informa UK limited, trading as Taylor & Francis group
KEYWORDS zintl-phase; first-principles calculations; elastic constants; optoelectronic properties; thermoelectric properties ARTICLE HISTORY Received 15 september 2017 accepted 20 December 2017
of converting directly waste thermal energy to useful electrical energy but also to their capability to reduce effectively the environmental pollution. The ability of a TE material to convert heat directly into electricity is controlled by the dimension-less parameter ZT [1,2], the so-called figure of merit, which is given by ZT = S2𝜎
𝜅 T,
where S is the Seebeck coefficient (thermopower), σ is the electrical conductivity,
κ is the thermal conductivity and T is the absolute temperature. A promising TE
material should have a large ZT value. From its expression, it is very clear that a high ZT, requires a large thermopower S, high electrical conductivity σ and a low thermal conductivity κ, i.e. an ideal thermoelectric material must strike a balance between these conflicting requirements. However, due to the strongly coupled nature between S, σ and the electronic component of the thermal conductivity
κ, it is difficult for a material to have simultaneously high S, high σ and low κ. A
high Seebeck coefficient is attained in a low charge-carrier concentration, while a large electrical conductivity is attained in a high charge-carrier concentration; S and σ have an opposite dependence on charge-carrier concentration, so a balance between S and σ must be achieved through a chemical doping [1,3]. Therefore, obtaining a TE material with a high ZT value is a challenging task.
Currently, many kinds of thermoelectric materials have been widely studied, such as Zintl-phases, nanostructured compounds, zinc antimonides, oxides, half-Heusler compounds, clathrates and skutterudites [4–12]. Zintl-phases, a broad class of intermetallic compounds characterised by cations that donate their electrons to support the formation of covalency bonded anionic substrates, have emerged as a promising class of materials for thermoelectric applications due to their complex crystal structures, interesting electronic, chemical and physical properties [13,14]. The structural requirements of Zintl-phases are explained by assuming the presence of both anionic networks and electropositive cations [13]. The anionic networks are covalent and the cationic part is ionic in nature. The resulting mix of ionic and covalent bonds frequently leads to complex crystal structures with large unit cells; such a complex crystal can enable them to have low thermal conductivity [15–17]. Additionally, the Zintl-phase chemistry suggests that the fundamental transport parameters can be modified by doping to achieve a good balance between S and σ, consequently thus can lead to a high power fac-tor [18,19]. Therefore, Zintl-phases provide desired characteristics for high ZT and improved thermoelectric performance since their thermal conductivities are intrinsically low. This has been demonstrated in several previous studies, includ-ing Ca3AlSb3 [20], Ca5Al2Sb6 [21] and Ca5Ga2As6 [22]. This further actuates us to search for other possible new Zintl-phase materials for suitable TE candidates. In the current study, we are interested in investigating the Ae3AlAs3 (Ae = Sr, Ba) compounds that were recently synthesised [23]. These compounds crystalise in the Ba3AlSb3 structure type with the space group Cmce. The structural proper-ties of the title compounds, including the lattice parameters and atomic position coordinates, have been investigated using single-crystal X-ray diffraction. The
band structure and density of states of Ba3AlAs3 have been carried out using the tight-binding linear muffin-tin orbital (TB-LMTO) method [23]. To the best of our knowledge, some basic physical properties, such as elastic, optical and ther-moelectric properties of these newly synthesised compounds are not studied. Therefore, the main object of the present study is the investigation of the struc-tural, elastic, electronic, optical and thermoelectric properties of the Ae3AlAs3 (Ae = Sr, Ba) compounds. The structure of the present paper is as follows: Section 2 describes briefly the computation setting. Section 3 reports and discusses the obtained results, with subsections dedicated to structural, elastic, electronic, opti-cal and thermoelectric properties. The paper is finished with a general conclusion.
2. Computational details
First-principles calculations were performed by employing two complementary methods based on density functional theory. The elastic properties were evaluated using the pseudopotential plane wave (PP-PW) method as implemented in the CASTEP code [24], while the electronic and optical properties were carried out using the full potential linearised augmented plane wave method (FP-LAPW) as incorporated in the WIEN2 k suite of programs [25]. The structural properties were evaluated using both the aforementioned methods. The structural data from Ref. [23] were taken as initial input for our calculations.
For the pseudopotential plane wave approach, Vanderbilt ultra-soft pseudo-potentials [26] were used to describe the interactions between core and valence electrons of each atom. The Ba: 5s25p66s2, Sr: 4s24p65s2, Al: 3s23p1 and As: 4s24p3
states were treated as valence electrons. The electronic exchange and correlation effects were treated through the generalised gradient approximation functional in the version of Perdew et al. [27], the so-called GGA-PBEsol. The plane-wave basis set energy cut-off was set at 350 eV. The Brillouin zone integration was replaced by a summation over a 6 × 6 × 3 k-point mesh generated according to Monkhorst-Pack scheme [28]. This set of parameters assures a total energy toler-ance of 1 × 10⁻⁵ eV/atom, a maximum force tolerance of 0.01 eV/Å, a maximum
stress of 0.02 GPa and a maximum displacement of 5.0 × 10⁻⁴ Å}.
It is well known that the first-principles methods with the common generalised gradient approximation (GGA) yield good values for the ground state structures but they underestimate the band gaps of semiconductors and insulators typi-cally by 30–50% [29–31] when compared to experiments. The underestimation of the band gaps of semiconductors and isolators when using GGA is because this approximation cannot describe exactly the exchange–correlation potential. Some sophisticated approaches, such as the weighted density approximation (WDA) [32], the GW approximation [33] and the Tran-Blaha modified Becke-Johnson (TB-mBJ) potential [34], have been developed in order to overcome this insuffi-ciency and to obtain reliable band gap values for semiconductors and insulators
compared to the measured ones. The TB-mBJ is computationally cheaper than the other aforementioned methods and produces energy band gaps almost com-parable with the corresponding measured ones with a reasonable computation time. Therefore, in addition to the GGA-PBEsol, the electronic, optical and ther-moelectric properties of the investigated compounds were calculated using the TB-mBJ functional as implemented in the WIEN2 k package [25]. The WIEN2 k code is an implementation of the full-potential linearised augmented plane wave (FP-LAPW). In the FP-LAPW method, the unit cell is divided into non-overlap-ping spheres centred at the atomic sites (labelled muffin-tin spheres (MTS)) and the space between the MTS (labelled interstitial region (IR)). A linear combination of radial atomic functions time spherical harmonics is used inside the MTS to expand the wave functions, whereas a plane wave basis set is used in the IR. In order to achieve the energy convergence of the eigenvalues, the wave functions in the interstitial regions were expanded in plane waves with a cut-off parameter
KMax = 4 (a.u.)−1. The Brillouin zone integration was replaced by a 6 × 6 × 3 k-point
mesh. The iteration process was repeated until the calculated total energy of the crystal converged to less than 10−5 Ry. The muffin-tin radii were selected as 2.35
a.u. for Sr, 2.40 a.u. for Ba, 2.18 a.u. for Al and 2.44 a.u. for As.
3. Results and discussion
3.1. Structural parameters
Single-crystal X-ray diffraction technique reveals that the Ae3AlAs3 (Ae = Sr, Ba) compounds crystallise in the orthorhombic Ba3AlSb3-type structure, space group
Cmce, with eight formula units in one unit cell [23] (Figure 1). There are two kinds of Ae (Ae1 and Ae2) and As (As1 and As2) atoms. The Wyckoff atomic positions in the Ae3AlAs3 unit cell are Ae1: 8f (0, yAe1, zAe1); Ae2: 16 g (xAe2, yAe2, zAe2); Al: 8d (xAl, 0, 0); As1: 8f (0, yAs1, zAs1) and As2: 16 g (xAs2, yAs2, zAs2). The fully optimised crystal structure, including lattice parameters and atomic positions, for the ort-horhombic Sr3AlAs3 and Ba3AlAs3 crystals, using both the PP-PW and FP-LAPW methods, are collected in Tables 1 and 2 in comparison with experimental findings. The inspection of Table 1 data indicates a good agreement between the calculated values for the lattice parameters (a, b and c) and the corresponding measured ones. Using the PP-PW (FP-LAPW) method, the deviations between the theoret-ical values of a, b and c and the corresponding experimental ones do not exceed +2.03% (−0.51%), −0.72% (−3.27) and +0.67% (−0.01%), respectively, in Sr3AlAs3, and −0.03% (−1.38%), −0.34% (−7.48%) and −0.107% (−0.51%), respectively, in Ba3AlAs3. Table 2 data show also a very good agreement between the calculated atomic position coordinates (x, y, z) and the corresponding measured ones, indi-cating the reliability of the performed calculations.
Figure 1. (colour online) one unit cell of sr3alas3.
Table 1. calculated lattice parameters (a, b and c, in Å) and unit-cell volume (V, in Å3) for the
sr3alas3 and Ba3alas3 compounds, compared with the available experimental data.
aUsing FP-laPW method within gga-PBesol. bUsing PP-PW method within gga-PBesol.
a b c V Sr3AlAs3 Present worka 19.0503 6.3501 12.7002 1587.22 Present workb 19.5368 6.5174 12.7729 1626.39 expt. [23] 19.149 6.5652 12.6871 1595.0 Ba3AlAs3 Present worka 19.5795 6.3501 13.2294 1737.92 Present workb 19.8475 6.8406 13.2741 1802.22 expt. [23] 19.854 6.8636 13.3589 1810.3
Table 2. atomic position coordinates for the sr3alas3 and Ba3alas3 compounds, compared with the available experimental data.
aUsing the FP-laPW method within the gga-PBesol. bUsing the PP-PW method within the gga-PBesol. cRef. [23].
Atom
x y z
Pres-ent a Pres-ent b Expt. c Pres-ent a ent Pres-b Expt. c Pres-ent a Pres-ent b Expt. c
Sr3AlAs3 sr1 0 0 0 0.17601 0.17924 0.17463 0.34919 0.34707 0.34891 sr2 0.17701 0.17755 0.17691 0.31155 0.30838 0.31222 0.13114 0.13009 0.13126 al 0.08477 0.08377 0.08500 0 0 0 0 0 0 as1 0 0 0 0.21042 0.21277 0.20879 0.10330 0.10079 0.10250 as2 0.34107 0.34207 0.34135 0.29518 0.29326 0.29606 0.12081 0.11794 0.12022 Ba3AlAs3 Ba1 0 0 0 0.17027 0.17109 0.17015 0.34671 0.34766 0.34685 Ba2 0.17572 0.17535 0.17563 0.31309 0.31201 0.31318 0.13024 0.12975 0.13014 al 0 0.08316 0.08294 0 0 0 0 0 0 as1 0 0 0 0.20320 0.20566 0.20319 0.09628 0.09791 0.09613 as2 0.34335 0.34294 0.34345 0.30899 0.30728 0.30905 0.11818 0.11954 0.11805
3.2. Elastic constants and related properties
Accurate calculations of the elastic constants Cij are very helpful to understand many physical properties of solids. The elastic constants Cij provide valuable infor-mation on the stability and stiffness of crystals against externally applied strain, bonding characteristics, specific heat, thermal expansion, Debye temperature, Grüneisen parameter and so on [35–37]. In general, the elastic behaviour of a completely asymmetric material is specified by 21 independent elastic constants
Cij but due to the presence of some symmetries, this number can be reduced. Only nine independent elastic constants, namely C11, C22, C33, C44, C55, C66, C12,
C13 and C23, are required to characterise the elastic properties of an orthorhombic crystal. The elastic constants Cij were evaluated via the calculation of three stress tensors corresponding to three different deformation patterns applied to the equi-librium lattice. The calculated elastic constants Cij using the strain–stress method [24] for the title compounds are reported in Table 3. There are no theoretical or experimental results for the elastic constants Cij in the scientific literature to be compared with the present results. Then, our results can serve as a prediction for future investigations.
The elastic constants C11, C22 and C33 reflect the resistance to the linear com-pression along the [100], [010] and [001] crystallographic directions, respectively. From Table 3, one can note that the values of the three aforementioned elastic con-stants are not remarkably different, suggesting that the resistance to the compres-sion deformation along the [100], [010] and [001] directions are approximately equal. The values of C11, C22 and C33 are higher than those of the other elastic constants Cij, demonstrating that the resistance of the two studied compounds to the shear distortion is lower than their resistance against the compressional deformation.
The mechanical stability of crystals leads to some restrictions on their elastic constants. For orthorhombic crystals, these mechanical stability criteria are [38]:
The calculated elastic constants of the two studied compounds (Table 3) satisfy the aforementioned criteria. This indicates that these compounds are mechani-cally stable.
It is not possible to measure the individual elastic constants Cij when single-crys-tal samples cannot be obtained. In this case, polycryssingle-crys-talline elastic moduli, such as the bulk modulus B and the shear modulus G, can be measured. Theoretically,
C11+ C22− 2C12>0, C11+ C33− 2C13>0, C22+ C33− 2C23>0, C11>0, C22 >0,
C33>0, C
44>0, C55>0, C66>0, C11+ C22+ C33+ 2C12+ 2C13+ 2C23>0
Table 3. calculated elastic constants (Cij, in gPa) for the Ae3alas3 (Ae = sr, Ba) compounds.
System C11 C22 C33 C44 C55 C66 C12 C13 C23
sr3alas3 61.7 74.6 76.6 32.4 28.6 30.3 27.1 22.6 31.3 Ba3alas3 80.2 71.1 81.5 17.1 4.7 14.1 21.6 15.3 24.0
we can deduce the polycrystalline (aggregates of single-crystals with random orientations) elastic moduli, which are more desirable for technological charac-terisation of materials, from the calculated single-crystal elastic constants Cij. The isotropic shear and bulk moduli (G and B) can be calculated from the anisotropic single-crystal elastic constants Cij using the Hill approximation [39], which takes the arithmetic average of the Voigt [40] and Reuss [41] approximations. The Voigt approach determines the upper limit of the actual effective moduli, while the Reuss approach determines the lower limit of these parameters. The expression of the Voigt bulk and shear moduli (BV and GV) and the Reuss bulk and shear moduli (BR and GR) can be found in Ref. [42]. The Young’s modulus E and Poisson’s ratio
σ can be obtained from B and G using the well-known relationships [43,44]. The calculated values of the aforementioned elastic moduli are given in Table 4. The obtained results allow us to make the following conclusions:
(i) Due to the low value of the bulk modulus, which represents the resist-ance to volume change by external applied pressure, one can conclude that the considered materials are characterised by a weak resistance to the volume change; i.e. by a high compressibility. The lower value of the shear modulus, which characterises the resistance to shear deformation, demonstrates that Ba3AlAs3 and Sr3AlAs3 have also a weak resistance to shape change. Besides, the bulk modulus B is larger than the shear mod-ulus G in both considered compounds, indicating a better capability of resistance to volume change than to shape change.
(ii) The Young’s modulus E, defined as the ratio of linear stress to linear strain, can be used to provide a measure of the stiffness of a material. It is found that E of the two studied compounds is weak, indicating that these compounds will show a rather small stiffness. The results also demonstrate that Sr3AlAs3 is stiffer than Ba3AlAs3 in terms of B, G and
E moduli.
(iii) The most widely used criterion to distinguish between ductile and brit-tle materials is the Pugh’s one (B/G ratio) [45]. According to this cri-terion, a material can be classified as ductile if the B/G ratio is greater than 1.75; otherwise, it demonstrates brittleness. The obtained data foretell that Sr3AlAs3 (B/G = 1.55) should behaves as brittle material, while Ba3AlAs3 should demonstrates ductility. The classical criteria of Cauchy pressure can also be used to examine the brittle/ductile
Table 4. calculated Reuss, Voigt and hill bulk (BR, BV and Bh, in gPa) and shear (GR, GV and Gh, in gPa) moduli, Young’s modulus (E, in gPa) and Poisson’s ratio (σ, dimensionless) for isotropic poly-crystalline ae3alas3 (Ae = sr, Ba) aggregates.
System BV GV BR GR BH GH Ej E σ Ex Ex Ex sr3alas3 41.65 39.60 40.92 26.15 41.29 26.60 72.80 60.30 72.52 65.70 0.23 Ba3alas3 39.41 32.73 39.39 12.02 39.40 15.32 72.80 60.30 72.52 40.69 0.32
character of materials [46]. Pettifor [47] indicated that Cauchy pres-sure can be adopted to capture the nature of the bonding. Materials with a positive Cauchy pressure possess metallic like bonds, thereby holding ductile characteristics. On the other hand, brittle materi-als would hold a negative Cauchy pressure. In orthorhombic mate-rials, the Cauchy pressure in the three lattice directions can be expressed as follows [48]:PaCauchy =C22−C44, P
Cauchy
b =C13−C55 and
PcCauchy =C12−C66. Based on the calculated single-crystal Cij (Table 3),
PaCauchy = −1.10 GPa (6.90 GPa), P Cauchy
b = −6.0 GPa (10.60 GPa) and
PcCauchy = −3.0 GPa (7.50 GPa) for Sr3AlAs3 (Ba3AlAs3). These results
confirm the brittleness of Sr3AlAs3 and ductility of Ba3AlAs3.
From the computed bulk and shear moduli, we can evaluate the longitudinal (Vl), transverse (Vt) and average (Vm) sound wave velocities in a polycrystalline material through the following relationships [49]:
Debye temperature θD, which is associated with the lattice vibration, elastic con-stants, specific heat and melting point, can be predicated via the following com-mon relation [49]:
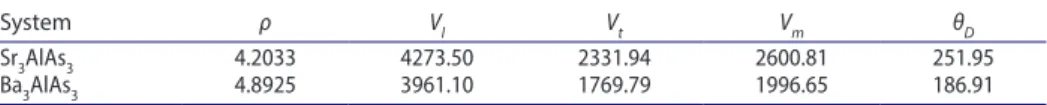
Here, h and kB are the constants of Planck and Boltzmann, respectively, n is the number of atoms per one formula unit, NA is Avogadro’s number, ρ denotes the mass density, M is the molecular mass. The calculated values of ρ, Vl, Vt, Vm and
θD for the Ae3AlAs3 (Ae = Sr, Ba) compounds are collected in Table 5. Sr3AlAs3 has a larger Debye temperature than Ba3AlAs3; this is a predicted result because the bulk modulus of Sr3AlAs3 is somewhat larger than that of Ba3AlAs3. Up to now, there are no available data for these parameters in the scientific literature to be compared with our present findings.
An isotropic material displays the same physical properties irrespective of the direction in which those properties are measured. In general, the elastic response of a single-crystal is seldom isotropic; almost all the known crystals are elastically anisotropic, so their elastic moduli depend on the orientation of the applied force
Vl= � �BH+4GH∕3�∕𝜌; Vt = √ GH∕𝜌; Vm =��2∕V3 t +1∕V 3 l�∕3� −1∕3 𝜃D= h kB [ 3n 4𝜋 ( NA𝜌 M )]1 3 Vm
Table 5. calculated mass density (ρ), longitudinal, transverse and average sound velocities (Vl,
Vt and Vm, in m/s unit) and Debye temperatures (θD, in K unit) for the Ae3alas3 (Ae = sr, Ba) poly-crystals.
System ρ Vl Vt Vm θD
sr3alas3 4.2033 4273.50 2331.94 2600.81 251.95 Ba3alas3 4.8925 3961.10 1769.79 1996.65 186.91
in respect of the crystallographic axes. The description of elastic anisotropy in materials is important because it influences various physical properties, such as unusual phonon modes, phase transformations, precipitation, dislocation dynam-ics, anisotropic plastic deformation, anomalous bcc slip, mechanical yield points, crack behaviour, elastic instability and internal friction [50]. The anisotropy in mechanical properties might be estimated using various anisotropy indexes and factors [51–56]. An even detailed picture of the elastic anisotropy can be emerged by plotting a three-dimensional surface representation showing the variation of the Young’s modulus with the crystallographic directions. This directional depend-ence of the Young’s modulus E for an orthorhombic crystal in an arbitrary direc-tion is defined as [57]:
Here, l1, l2 and l3 are the direction cosines, which determine the angles between the axes a, b and c, respectively, and a given direction, and Sij is the elastic com-pliance constants, which can be acquired from the inverse of the matrix of elastic constants. The distance from the origin of the coordinate system to this surface is equal to the Young’s modulus in a given direction. For a perfectly isotropic medium, this surface would be a sphere, while the deviation of this surface from the spherical shape indicates the presence of a certain degree of elastic anisot-ropy. Figure 2 illustrates the directional dependence of the Young’s modulus of the Sr3AlAs3 and Ba3AlAs3 compounds. Figure 1 shows that the degree of elastic anisotropy of Ba3AlAs3 is much more appreciable than that of Sr3AlAs3. A deeper look into the peculiar features of elastic anisotropy can be gauged by plotting the cross-section of the closed surface of E in the principal planes. For isotropic crystal, the plane projection curves are circular. From the cross sections plotted separately in Figure 1, we can see that there is a clear deviation from circular shape.
3.3. Electronic properties 3.3.1. Band structure
The electronic energy band dispersions along the high-symmetry directions in the Brillouin zone (BZ) for the Sr3AlAs3 and Ba3AlAs3 compounds, performed at the optimised structural parameters, using the FP-LAPW method with both the GGA-PBEsol and TP-mBJ approaches, are depicted in Figure 3. The Γ, Z, T,
Y, S and R letters indicate the high symmetry points in the BZ of the Ae3AlAs3 (Ae = Sr, Ba) compounds and their coordinates are respectively (0,0,0), (0,0,0.5), (−0.5,0.5,0.5), (−0.5, 0.5, 0), (0,0.5,0) and (0,0.5,0.5) in the unit vectors of the reciprocal lattice. From Figure 2, one can note that Sr3AlAs3 has a direct band gap; the top of the valence band (VB) and the bottom of the conduction band (CB) are located at the Γ-point, while Ba3AlAs3 has an indirect band gap; the top
of the VB is located at the Y-point and the bottom of the CB is at the Γ-point. The calculated band structures using the TB-mBJ and GGA-PBEsol functionals have practically same features except the band gap values that are disparate. The calculated Sr3AlAs3 (Ba3AlAs3) energy band gap is 1.51 eV (1.28 eV) when using the TB-mBJ formalism, and is 0.90 eV (0.61 eV) when using the GGA-PBEsol. We note that the GGA and LDA functionals usually underestimate the energy band gap by 30–50% [30–32]. Therefore, one can appreciate that the TB-mBJ considera-bly improves the band gap values. There are no experimental values for the gaps of the studied compounds. The GGA-PBEsol band gap value for Ba3AlAs3 is in good agreement with the one predicted by Stanislav et al. [24] using the tight-binding linear muffin tin orbital (TB-LMTO) method within the LDA.
3.3.2. Density of states
Assignment of the electronic states compositing the electronic energy bands of the considered systems can be made with the help of the total and atomic decomposed
Figure 2. (colour online) 3D-directional dependence of the Young’s modulus (E, in gPa) and its projection on the ab- {(001)}, ac- {(010)} and ab- {(100)} planes for the sr3alas3 and Ba3alas3 compounds.
partial densities of states (TDOS and PDOS) diagrams, which are shown in Figure
4. The Sr3AlAs3 and Ba3AlAs3 valence bands located in the energy range from −12 eV up to Fermi level (EF) can be separated into four groups that are labelled V1, V2, V3 and V4 in the figure. For Sr3AlAs3, the lowest energy group V1, which is stretched from approximately −10.6 to −9.9 eV, is mainly formed of the As1-4s and As2-As1-4s states. The second group V2, which spreads approximately from −9.7 to −8.5 eV, is mainly due to the As1-4p and Al-3s states with a very small contribution from an admixture of the Al-3s, Al-3p, Sr1-4p and Sr2-4p orbitals. The third group V3, located in the energy range from −4.6 to −3.97 eV, is mainly due to the As1-4p and Al-3s states. The fourth valence band group V4, which lays approximately from −3.0 eV up to Fermi level (EF), is completely dominated by the As1-4p and As2-4p states with a small contribution from the Al-3p, Sr1-4s, Sr2-4s, Sr1-4p, Sr2-4p, Sr1-3d and Sr2-3d states. The bottom of the conduction band (C1) comes from the Sr1-3d and Sr2-3d states with a small contribution from the Al-3p and Al-3s states. For the Ba3AlAs3 compound, the V1 valence band group, from –10.7 to –9.97 eV, is mainly occupied by the As1-4s states with a small
Figure 3. (colour online) electronic band dispersion curves along some high symmetry directions in the Brillouin zone for the Ae3alas3 (Ae = sr, Ba) compounds using the gga-PBesol (a) and the TB-mBJ (b) functionals.
contribution from an admixture of the Ba1-5p, Ba2-5p, As2-4d and Al-3s states. The second group V2, from −9.7 to −8.5 eV, is mainly formed of the As1-4s states with a small contribution from an admixture of the Ba1-5p, Ba2-5p, As2-4d and Al-3sp states. The third group V3, from −4.7 to −3.82 eV, is mainly composed of the As2-4d and As1-4p states with a small contribution from the Ba1-4p, Ba1-4d, Ba2-4p and Ba2-4d. The upper valence band group V4, from −3.05 eV up to Fermi level, is mainly due to the As1-4p and As2-4sd states with a small contribution from the Al-3p and Ba1-4pd orbitals. The bottom of the conduction band C1 is made up basically of the As2-4d, Ba1-4d and Ba2-4d states with a small contri-bution from the Al-3s and Al-3p states.
3.3.3. Effective mass
The effective mass of charge-carrier provides an opposite contribution to the Seebeck coefficient and electrical conductivity. A large effective mass of rier is favourable to improve the Seebeck coefficient; however, the high charge-car-rier mobility requires a lighter effective mass. To further understand the electrical behaviour of the Ae3AlAs3 (Ae = Sr, Ba) compounds, it is necessary to estimate their effective masses of the charge-carries in various electron and hole pockets at the band edges. The effective mass of electrons (m∗e) at the conduction band
minimum (CBMi) and holes (m∗h) at the valence band maximum (VBMa) can
be evaluated through a simple parabolic fitting of the dispersion energy E(k)
Figure 4. (colour online) Total and partial densities of states (TDos and PDos) diagrams for the
diagram: E = ℏk2
2m∗, where ℏ is the Planck’s constant, E is the band-edge energy as
a function of the wave vector k and m* is the effective mass. For Ba
3AlAs3, the
effective masses of the holes at the VBMa were calculated along the Y → T and
Y → 𝛤directions and those of the electrons at the CBMi were evaluated along
the 𝛤 → S and 𝛤 → Ydirections. For Sr3AlAs3, the effectives masses of holes and
electrons are calculated along the 𝛤 → S and 𝛤 → Y directions. The obtained
results are listed in Table 6. From Table 6, it is clear that the electrons and holes effective masses show a relevant dependence on the k-direction in the two con-sidered compounds, implying the anisotropy of this physical property. It is found also that the effective mass of electron at the conduction band minimum is small than that of the hole at the valence band maximum. Consequently, the p-type
Ae3AlAs3 (Ae = Sr, Ba) compounds would have the highest Seebeck coefficient, while the n-type Ae3AlAs3 (Ae = Sr, Ba) compounds would have the largest elec-trical conductivity. In addition, we can predict that the charge-carrier mobility of the p-type Sr3AlAs3 (Ba3AlAs3) compound along the𝛤 → S(𝛤 → Y) direction
should be larger than that in the 𝛤 → Y (Y → T) direction. 3.4. Optical properties
The fundamental features of the linear response of a medium to the effect of an incoming electromagnetic radiation can be accessed from the knowledge of its complex dielectric function ε(ω), which is directly related to the interaction of photons with electrons. The imaginary part of the dielectric function ε2(ω) (ε2(ω) = Im ε(ω); ε(ω) = ε1(ω) + jε2(ω)) is directly proportional to the intensity of optical absorption. In the framework of the linear-response theory, ε2(ω) is calculated from the matrix elements of the electric dipole operator between the occupied states in the valence band and unoccupied states in the conduction band within the respect of the selection rules [58]. The real part of the dielectric func-tion ε1(ω) (ε1(ω) = Re ε(ω)) can be assessed from the imaginary part ε2(ω) via the Kramer–Kronig relationship [59]. All frequency dependent macroscopic optical functions, such as refractive index n(ω), absorption coefficient α(ω), reflectivity
R(ω) and electron energy-loss function L(ω), can be deduced from ε2(ω) and
ε1(ω) using the well-known relationships [60,61]. Since the investigated com-pounds belong to the orthorhombic system, space group Cmce, it is necessary to calculate the three non-zero components of the dielectric tensor that correspond to the three polarisations of the electric field E⃗ of the incident electromagnetic Table 6. calculated electron and hole effective masses (m∗e andm
∗
e, in units of free electron mass m0) for the sr3alas3 and Ba3alas3 compounds.
System m∗ e(𝛤 → S) m ∗ e(𝛤 → Y) m ∗ h(𝛤 → S) m ∗ h(𝛤 → Y) Sr3AlAs3 0.2007 0.2202 0.3225 4.0226 m∗ e(𝛤 → S) m ∗ e(𝛤 → Y) m ∗ h(Y → T) m ∗ h(Y → 𝛤 ) Ba3AlAs3 0.2158 0.3738 0.6161 0.5514
radiation along the three principal crystallographic directions: a ([100]), b ([010]) and c ([001]).
The calculated imaginary parts of the Sr3AlAs3 and Ba3AlAs3 dielectric func-tions for the three different polarisafunc-tions, i.e. E∕∕ [100]⃗ , E∕∕ [010]⃗ and E∕∕ [001]⃗ ,
are presented in Figure 5(a). It is clear from Figure 5(a) that the optical properties of the considered compounds exhibit a noticeable anisotropy. To account for the features observed in the optical spectra, it is customary to consider transitions from occupied to unoccupied states in the electronic energy band structure, espe-cially at the high symmetry points in the Brillouin zone. Our scrutiny of the ε2(ω) curve of Sr3AlAs3 indicates that it rises speedily with practically the same rate for the three different polarisations of the incident radiation. The ε2(ω) spectrum exhibits two peaks centred at approximately 3.99 and 4.56 eV when the incident radiation is polarised parallel to the [100] crystallographic direction, at 4.01 and 4.91 eV for E∕∕ [010]⃗ and at 4.53 and 4.97 eV whenE∕∕ [001]⃗ . Based on the
calcu-lated band structure and density of states diagrams, one can conclude that these peaks are mainly originated from the direct transitions between the Sr1-4p and Sr2-4p or As1-4p and As2-4p states in the valence band and the Sr-3d states in the conduction band. The absorptive part of the dielectric function of the single-crys-tal Ba3AlAs3 exhibits one peak centred at approximately 4.20 eV for E∕∕ [100]⃗ , at
4.97 eV for E∕∕ [010]⃗ direction and at approximately 4.23 eV for E∕∕ [001]⃗ . This
peak is mainly due to the electronic direct transitions from the occupied state As1-4p or As2-4s to the unoccupied states Ba1-3d or Ba2-3d.
Figure 5. (colour online) calculated imaginary (ε2(ω)) and real (ε1(ω)) parts of the dielectric function (ε(ω)) as functions of photon energy for the Ae3alas3 (Ae = sr, Ba) single-crystals for three different polarisations: ⃗E∕∕[100], ⃗E∕∕[010]and ⃗E∕∕[001].
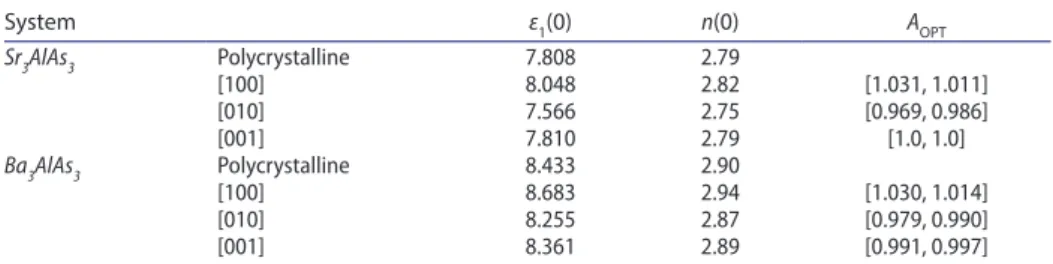
The dispersive parts (ε1(ω) ) of the Sr3AlAs3 and Ba3AlAs3 dielectric functions are shown in Figure 5(b). The most important quantity in ε1(ω) spectrum is the static dielectric constant, which is defined as the zero-energy value of the real part of the complex dielectric function: ε1(0) = ε1(ω → 0). The ε1(0) is a parameter of fundamental importance in many aspects of material properties. Calculated ε1(0) value for Sr3AlAs3 (Ba3AlAs3) is found to be equal 8.048 (8.683) when E∕∕ [100]⃗
, 7.566 (8.255) when E∕∕ [010]⃗ and 7.810 (8.361) when E∕∕ [001]⃗ . One can note
that the 𝜀1(0)values corresponding to the three different polarisation directions
are larger than the corresponding ones for Ba3AlAs3. This demonstrates that ε1(0) value is inversely proportional with the band gap; a smaller energy gap yields a larger ε1(0)value. This is consistent with the Penn’s model [59] based on the expression 𝜀(0) ≈ 1 + (h𝜔p∕Eg)
2.
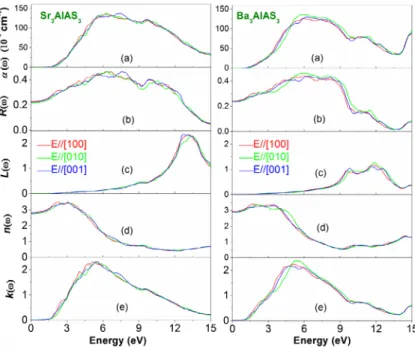
The absorption coefficient α(ω) describes the relative decrease in the incident radiation intensity when it passes through a medium. The calculated Sr3AlAs3 and Ba3AlAs3 absorption coefficients in a wider spectral region up to 15 eV for three different polarisations of the incident radiation: E∕∕[100]⃗ , E∕∕[010]⃗ and ⃗
E∕∕[001]are displayed in Figure 6(a). The absorption edge in the Sr3AlAs3
com-pound starts at approximately 1.51 eV for the three different polarisations of the incident radiation. For the Ba3AlAs3 compound, the absorption edge begins approximately at 1.28 eV for the three different polarisations of the incident
Figure 6. (colour online) calculated optical function spectra: absorption coefficient𝛼(𝜔), reflectivityR(𝜔), energy loss functionL(𝜔), refractive index n(𝜔)and extinction coefficient k(𝜔)for the sr3alas3 and Ba3alas3 single-crystals for three different polarisations: ⃗E∕∕[100], ⃗E∕∕[010]and
radiation. A wide absorption band, located between 2 and 12 eV, characterises the considered compounds.
Figure 6(b) displays the calculated dependence of the reflectivity on the incident photon energy for three different polarisations for the Sr3AlAs3 and Ba3AlAs3 sin-gle-crystals. The zero frequency limit R(0 ) of the Sr3AlAs3 (Ba3AlAs3) compound is equal to 23% (24%) for E∕∕[100]⃗ , 21% (23%) for E∕∕[010]⃗ and 22% (23%) for ⃗
E∕∕[001]. The reflectivity R(ω) enhances from R(0) with increasing photon energy
to acquire a maximum and then it decreases rapidly. From Figure 5(b), one can note that the maximum reflectivity in Sr3AlAs3 (Ba3AlAs3) arises approximately at 6.27 eV (6.00 eV) for E∕∕[100]⃗ , 6.35 eV (5.75 eV) for E∕∕[010]⃗ and 7.60 eV
(6.35 eV) for E∕∕[001]⃗ . This maximum attains 46% (44%) for E∕∕[100]⃗ , 46% (46%)
for E∕∕[010]⃗ and 43% (42%) for E∕∕[001]⃗ in Sr
3AlAs3 (Ba3AlAs3).
The energy-loss function L(ω) describes the energy-loss of a fast electron pass-ing through a material [62]. The main peak of the L(ω) spectrum is generally defined as the bulk plasma frequency (ω)p, which occurs when 𝜀2(𝜔) <1 and
𝜀1(𝜔) reaches the zero point [63]. The plasma frequency for Sr3AlAs3 (Ba3AlAs3)
is approximately equal to 13.15 eV (11.68 eV) forE∕∕[100]⃗ , 13.34 eV (11.87 eV)
for E∕∕[010]⃗ and 12.77 eV (11.60 eV) for E∕∕[001]⃗ (Figure 6(c)). When the
fre-quency of incident light is higher than the plasma frefre-quency, the material becomes transparent, and hence an abrupt reduction of the reflectivity occurs at the cor-responding energy.
The refractive index n(ω) of a material describes the difference between the propagation of an electromagnetic wave through vacuum and in a material. The extinction coefficient directly describes the attenuation of the electromagnetic waves in a material, and it is also known as a damping constant attenuation coeffi-cient. The knowledge of the refractive index of an optical compound is important for its use in optical devices, such as photonic crystals and waveguides. Figure 6(d) shows the refractive index of Sr3AlAs3 and Ba3AlAs3 in relation with the energy of incident radiation. It is found that the static refractive index n(0) (the value of refraction index at zero energy) for Sr3AlAs3 (Ba3AlAs3) compound is 2.83 (2.94) for E∕∕[100]⃗ , 2.75 (2.87) for E∕∕[010]⃗ and 2.79 (2.89) for E∕∕[100]⃗ .
Static optical anisotropy for the title compounds can be quantified by an ani-sotropy rate, which can be expressed as follows [64,65]:
Here, 𝜀1(0)[direction] (n(0)[direction]) is the value of 𝜀
1(0) (n(0)) along principal optical
axes and 𝜀1(0)[polycristalline](n(0)[polycristalline]) is its value in polycrystalline. A
mate-rial is optically isotropic if AOPT =1; otherwise, it is optically anisotropic. The
degree of deviation of AOPTfrom unity reveal the extent of the optical anisotropy.
The calculated values of AOPT are shown in Table 7. The calculated AOPT values
AOPT = [ 𝜀1(0)[direction] 𝜀1(0)[polycristalline], n(0)[direction] n(0)[polycristalline] ]
reveal that the two studied compounds exhibit a certain optical anisotropy. The maximum optical anisotropy occurs along the [010] crystallographic direction.
3.5. Thermoelectric properties
When two dissimilar points of a thermoelectric material are held at different temperatures, a voltage of several microvolts per Kelvin between these two points arises. An efficient thermoelectric material should possess high Seebeck coefficient (S) (in order to convert maximum heat to electrical power) and high electrical conductivity σ while keeping the thermal conductivity κ low as much as possible. So, in order to study the thermoelectric properties of the orthorhombic Ae3AlAs3 (Ae = Sr, Ba) compounds, we have calculated the basic transport parameters, e.g. Seebeck coefficient (S, in μVK−1), electrical conductivity scaled by relaxation
time (σ/τ, in Ω−1m−1s−1), thermal conductivity scaled by relaxation time (κ/τ,
in WK−1 m−1s−1), power-factor (PF = S2 s/τ, in WK−2m−1s−1) and factor of merit
(ZT = 𝜎S2T∕𝜅, dimensionless), as function of both charge-carrier concentration
and temperature. The thermoelectric properties of the examined compounds were calculated for temperature between 300 and 900 K and for charge-carrier con-centration between 1 × 10¹⁸ and 1 × 1021cm−3, which is an optimum
charge-car-rier concentration range for better thermoelectric performance, using the semi classical Boltzmann theory as implanted in the BoltzTraP computer package [66] with a dense k-mesh of 50 × 50 × 50. As the investigated compounds crystalise in an orthorhombic system, we have first investigated the directional dependence of the thermoelectrical parameters. We find that the two considered compounds exhibit almost isotropic behaviour in the TE parameters along the three principal crystallographic directions. Since there is no significant anisotropy observed in the TE parameters, we have presented only their average values.
Figure 7 shows the variation of the Seebeck coefficient S (thermopower), elec-trical conductivity scaled by relaxation time σ/τ, electronic thermal conductivity scaled by relaxation time κ/τ and power-factor PF with charge-carrier concentra-tion for both n-type and p-type Sr3AlAs3 and Ba3AlAs3 compounds at 300, 600 and 900 K. Panel (a) of Figure 6 demonstrates that the absolute value (magnitude)
Table 7. calculated static dielectric constants ε1(0), static refractive indexes n(0)and optical ani-sotropy AoPT for the sr3alas3 and Ba3alas3 compounds in polycrystalline and along the principal optical axes:[100], [010] and [001].
System ε1(0) n(0) AOPT Sr3AlAs3 Polycrystalline 7.808 2.79 [100] 8.048 2.82 [1.031, 1.011] [010] 7.566 2.75 [0.969, 0.986] [001] 7.810 2.79 [1.0, 1.0] Ba3AlAs3 Polycrystalline 8.433 2.90 [100] 8.683 2.94 [1.030, 1.014] [010] 8.255 2.87 [0.979, 0.990] [001] 8.361 2.89 [0.991, 0.997]
of S decreases with an increasing charge-carrier concentration for both n-type and p-type doping at a fixed temperature. The magnitude of S increases with an increasing temperature due to the increase of charge-carrier concentration for both charge-carrier types; this is a common trend in thermoelectric materials. One can note that the considered compounds possess larger thermopower for the holes compared with the electrons throughout the considered temperature range. For the same carrier concentration, the difference in Seebeck coefficient between electrons and holes is of the order of 200 µV/K. This result is consistent with the calculated charge-carrier masses; large Seebeck coefficient translates to large effective masses of charge-carries. The thermopower shows practically the same behaviour regarding the variation of charge-carrier concentration and temperature for the two title compounds. This comportment is might be due to the similarity of their band dispersions around the Fermi level and their effective masses, which are close to each other. For the same concentration and same type of charge-carrier, the two studied compounds have almost equal value for the thermopower at the same fixed temperature. To have an idea about the thermopower efficiency of the title compounds, we have compared their Seebeck coefficient S with a traditional thermoelectric material, Bi2Te3. It was reported that at 300 K and charge-carrier concentration of 4 × 1018 cm−3, Bi
2Te3 has a thermopower of 313 μVK−1 for
p-dop-ing and of 196 μVK−1 for n-doping [67,68], while our investigated compound
Sr3AlAs3 (Ba3AlAs3), at the same conditions, has a Seebeck coefficient S equal to approximately 442 (472) μVK−1 for p-doping and −327 (−404) μVK−1 for n-doping.
From this, one can appreciate that the thermopower value of the examined mate-rials is larger than that of the traditional thermoelectric compound. This allows
Figure 7. (colour online) calculated average seebeck coefficient (S; panel a), electrical conductivity scaled by relaxation time (σ/τ; panel b), thermal conductivity scaled by relaxation time (κ/τ; panel c) and power-factor (PF = S2σ/τ panel d) as functions of both electron and hole concentrations at
us to claim that the Sr3AlAs3 and Ba3AlAs3 systems are potential candidates for thermoelectric applications if one can more reduce their thermal conductivity by some techniques, such as alloying, nano-structuring or superlattice growth.
Panels (b) and (c) of Figure 7 demonstrate that the electrical and thermal conductivities scaled by relaxation time (σ/τ and κ/τ) increase with an increasing charge-carrier concentration in the two considered compounds for both n-type and p-type doping at a fixed temperature. It is found that the σ/τ value of the electrons is larger than that of the holes.
Figure 8 depicts the variation of the figure of merit (ZT) as function of hole and electron concentrations at 300, 600 and 900 K for Sr3AlAs3 and Ba3AlAs3. One can note that at the same temperature and same charge-carrier concentration, the maximum figure of merit (ZT) is found in the hole-doped systems. At 900 K, the
ZT is equal 1.02 (1.00) in the p-doped Sr3AlAs3 (Ba3AlAs3) and 0.93 (0.89) in the
n-doped Sr3AlAs3 (Ba3AlAs3).
4. Conclusion
In summary, we have investigated in detail the structural, electronic, optical and thermoelectric properties of the new ternary arsenides Ae3AlAs3 (Ae = Sr, Ba) using first principles calculations.
Our main findings are as follows:
(i) The calculated structural parameters agree very well with the available experimental findings.
Figure 8. (colour online) calculated figure of merit zT as a function of charge-carrier concentration of both electron and hole concentrations at 300, 600 and 900 K for the sr3alas3 (solid lines) and Ba3alas3 (dotted lines) compounds.
(ii) The two examined compounds are mechanically stable and exhibit a noticeable elastic anisotropy. Sr3AlAs3 (Ba3AlAs3) will behave as brittle (ductile) with rather moderate stiffness.
(iii) The calculated band structures using the TB-mBJ potential reveal that Sr3AlAs3 and Ba3AlAs3 are semiconductors with band gaps equal to 1.51 and 1.28 eV, respectively.
(iv) The calculated dielectric function, extinction coefficient, reflective index, reflectivity and electron energy-loss function for polarised incident radi-ation along the principal crystallographic directions show noticeable anisotropy. The origin of the features that appear in the optical spectra has discussed. The static dielectric constants ε(0), refractive index n(0) and plasmon energy were estimated.
(v) We found that Sr3AlAs3 and Ba3AlAs3 are promising TE materials with a high Seebeck coefficient and electrical conductivity, but their figures of merit are limited by their large thermal conductivity.
Acknowledgement
The authors (A. Bouhemadou and S. Bin-Omran) extend their appreciation to the International Scientific Partnership Program ISPP at King Saud University for funding this research work through JSPP# 0025.
Disclosure statement
No potential conflict of interest was reported by the authors.
Funding
This work was supported by the International Scientific Partnership Program ISPP at King Saud University [grant number JSPP# 0025].
ORCID
Y. Al-Douri http://orcid.org/0000-0002-5175-6372
References
[1] G.J. Snyder and E.S. Toberer, Complex thermoelectric materials, Nat. Mater. 7 (2008), pp. 105–114.
[2] A.I. Hochbaum, R. Chen, R.D. Delgado, W. Liang, E.C. Garnett, M. Najarian, A. Majumdar, and P. Yang, Enhanced thermoelectric performance of rough silicon nanowires, Nature 451 (2008), pp. 163–167.
[3] Y. Pei, A.D. LaLonde, N.A. Heinz, X. Shi, S. Iwanaga, H. Wang, L. Chen, and G.J. Snyder,
Stabilizing the optimal carrier concentration for high thermoelectric efficiency, Adv. Mater.
[4] S.M. Kauzlarich, S.R. Brown, and G.J. Snyder, Zintl phases for thermoelectric devices, Dalton Trans. 133 (2007), pp. 2099–2107.
[5] G. Chen, M.S. Dresselhaus, G.J.P. Fleurial, and T. Caillat, Recent developments in
thermoelectric materials, Int. Mater. Rev. 48 (2003), pp. 45–66.
[6] M.S. Dresselhaus, G. Chen, M.Y. Tang, R.G. Yang, H. Lee, D.Z. Wang, Z.F. Ren, J.P. Fleurial, and P. Gogna, New directions for low-dimensional thermoelectric materials, Adv. Mater. 19 (2007), pp. 1043–1053.
[7] C. Uher, Skutterudites: Prospective Novel Thermoelectrics, in Recent Trends in Thermoelectric
Materials Research I, Semimetals and Semimetals Series, Terry M. Tritt, eds., Vol. 69,
Elsevier, Amsterdam, 2001, pp. 139–253.
[8] G.S. Nolas, J. Poon, and M. Kanatzidis, Recent developments in bulk thermoelectric materials, MRS Bull. 31 (2006), pp. 199–205.
[9] G.J. Snyder, M. Christensen, E. Nishibori, T. Caillat, and B.B. Iversen, Disordered zinc
in Zn4Sb3 with phonon-glass and electron-crystal thermoelectric properties, Nat. Mater.
3 (2004), pp. 458–463.
[10] F. Casper, T. Graf, S. Chadov, B. Balke, and C. Felser, Half-Heusler compounds: Novel materials for energy and spintronic applications, Semicond. Sci. Technol. 27 (2012), p. 063001.
[11] K. Koumoto, Y. Wang, R. Zhang, A. Kosuga, and R. Funahashi, Oxide thermoelectric materials: A nanostructuring approach, Annu. Rev. Mater. Res. 40 (2010), pp. 363–394. [12] K. Koumoto, I. Terasaki, and R. Funahashi, Complex oxide materials for potential
thermoelectric applications, MRS Bull. 31 (2006), pp. 206–210.
[13] S.M. Kauzlarich (ed.), Chemistry, Structure and Bonding of Zintl Phases and Ions, Selected
Topics and Recent Advances, John Wiley-VCH, Weinheim, 1996.
[14] E.S. Toberer, A.F. May, and G.J. Snyder, Zintl chemistry for designing high efficiency
thermoelectric materials, Chem. Mater. 22 (2010), pp. 624–634.
[15] E.S. Toberer, A. Zevalkink, N. Crisosto, and G.J. Snyder, The Zintl compound Ca5Al2Sb6 for low-cost thermoelectric power generation, Adv. Funct. Mater. 20 (2010), pp. 4375– 4380.
[16] E.S. Toberer, C.A. Cox, S.R. Brown, T. Ikeda, A.F. May, S.M. Kauzlarich, and G.J. Snyder, Traversing the metal-insulator transition in a Zintl phase: Rational enhancement
of thermoelectric efficiency in Yb14Mn1−xAlxSb11, Adv. Funct. Mater. 18 (2008), pp. 2795–2800.
[17] A. Zevalkink, G. Pomrehn, Y. Takagiwa, J. Swallow, and G.J. Snyder, Thermoelectric
properties and electronic structure of the Zintl-phase Sr3AlSb3, ChemSusChem. 6 (2013), pp. 2316–2321.
[18] G.J. Snyder and E.S. Toberer, Complex thermoelectric materials, Nat. Mater. 7 (2008), pp. 105–114.
[19] Y. Pei, A.D. LaLonde, N.A. Heinz, X. Shi, S. Iwanaga, H. Wang, L. Chen, and G.J. Snyder, Stabilizing the optimal carrier concentration for high thermoelectric efficiency, Adv. Mater. 23 (2011), pp. 5674–5678.
[20] A. Zevalkink, E.S. Toberer, W.G. Zeier, E. Flage-Larsen, and G.J. Snyder, Ca3AlSb3: An
inexpensive, non-toxic thermoelectric material for waste heat recovery, Energy Environ.
Sci. 4 (2011), pp. 510–518.
[21] Y.L. Yan and Y.X. Wang, Crystal structure, electronic structure, and thermoelectric properties
of Ca5Al2Sb6, J. Mater. Chem. 21 (2011), pp. 12497–12502.
[22] J.P. Perdew and A. Zunger, Self-interaction correction to density-functional approximations
[23] S.S. Stoyko, L.H. Voss, H. He, and S. Bobev, Synthesis, crystal and electronic structures of the pnictides AE3TrPn3 (AE = Sr, Ba; Tr = Al, Ga; Pn = P, As), Crystals 5 (2015), pp. 433–446.
[24] S.J. Clark, M.D. Segall, C.J. Pickard, P.J. Hasnip, M.J. Probert, K. Refson, and M.C. Payne,
First principles methods using CASTEP, Z. Kristallogr. 220 (2005), pp. 567–570. [25] P. Blaha, K. Schwarz, G.K.H. Madsen, D. Kvasnicka, and J. Luitz, WIEN2 k: An Augmented
plane wave plus local orbitals program for calculating crystal properties, Vienna University
of Technology, Vienna, 2001.
[26] D. Vanderbilt, Soft self-consistent pseudopotentials in a generalized eigenvalue formalism, Phys. Rev. B. 41 (1990), pp. 7892–7895.
[27] J.P. Perdew, A. Ruzsinszky, G.I. Csonka, O.A. Vydrov, G.E. Scuseria, L.A. Constantin, X.L. Zhou, and K. Burke, Restoring the density-gradient expansion for exchange in solids and surfaces, Phys. Rev. Lett. 100 (2008), p. 136406.
[28] H.J. Monkhorst and J.D. Pack, Special points for Brillouin-zone integrations, Phys. Rev. B. 13 (1976), pp. 5188–5192.
[29] P. Dufek, P. Blaha, and K. Schwarz, Applications of Engel and Vosko’s generalized gradient
approximation in solids, Phys. Rev. B 50 (1994), pp. 7279–7283.
[30] E. Engel and S.H. Vosko, Exact exchange-only potentials and the virial relation as
microscopic criteria for generalized gradient approximations, Phys. Rev. B 47 (1993), pp. 13164–13174.
[31] X. Zhu, S. Fahy, K.J. Chang, and S.G. Louis, Ab initio calculation of pressure coefficients
of band gaps of silicon: Comparison of the local-density approximation and quasiparticle results, Phys. Rev. B 39 (1989), pp. 7840–7847.
[32] P.P. Rushton, D.J. Tozer, and S.J. Clark, Nonlocal density-functional description of exchange
and correlation in silicon, Phys. Rev. B. 65 (2002), p. B864.
[33] B. Králik, E.K. Chang, and S.G. Louie, Structural properties and quasiparticle band
structure of zirconia, Phys. Rev. B 57 (1998), pp. 7027–7036.
[34] F. Tran and P. Blaha, Accurate band gaps of semiconductors and insulators with a semilocal exchange-correlation potential, Phys. Rev. Lett. 102 (2009), p. 226401.
[35] P.E. Blöchl, O. Jepsen, and O. K. Andersen, Improved tetrahedron method for
Brillouin-zone integrations, Phys. Rev. B 49 (1994), pp. 16223–16233.
[36] C.A. Ponce, R.A. Casali, M.A. Caravaca, Ab initio study of mechanical and thermo-acoustic
properties of tough ceramics: Applications to HfO2 in its cubic and orthorhombic phase. J.
Phys.: Condens. Mater. 20 (2008), p. 045213.
[37] A. Bouhemadou, R. Khenata, M. Chegaar, and S. Maabed, First-principles calculations
of structural, elastic, electronic and optical properties of the antiperovskite AsNMg3, Phys.
Lett. A 371 (2007), pp. 337–343.
[38] D.C. Wallace, Thermodynamics of Crystals, John Wiley, New York, NY, 1972.
[39] R. Hill, The elastic behaviour of a crystalline aggregate, Proc. Phys. Soc. Lond. A. 65 (1952), pp. 349–354.
[40] W. Voigt, Lehrbuch der Kristallphysik, Taubner, Leipzig, 1928.
[41] A. Reuss, Berechnung der fließgrenze von mischkristallen auf grund der plastizitätsbedingung
fur Einkristalle, Zeitschrift Angew. Math. Mech. 9 (1929), pp. 49–58.
[42] A. Bedjaoui, A. Bouhemadou, S. Aloumi, R. Khenata, S. Bin-Omran, Y. Al-Douri, F. Saad Saoud, and S. Bensalem, Structural, elastic, electronic and optical properties of the novel
quaternary diamond-like semiconductors Cu2MgSiS4 and Cu2MgGeS4, Solid State Sci.
70 (2017), pp. 21–35.
[43] E. Schreiber, O.L. Anderson, and N. Soga, Elastic Constants and Their Measurements, McGraw-Hill, New York, NY, 1973.
[44] J.W. Soh, H.M. Lee, and H.-S. Kwon, Relation between Poisson’s ratio and ionicity in simple binary cubic compounds, J. Alloys Compd. 194 (1993), pp. 119–125.
[45] S.F. Pugh, Relations between the Elastic Moduli and the plastic properties of polycrystalline
pure metals, Phil. Mag. 45 (1954), pp. 823–843.
[46] S. Chen, Y. Sun, Y.-H. Duan, B. Huang, and M.-J. Peng, Phase stability, structural and elastic properties of C15-type Laves transition-metal compounds MCo2 from first-principles calculations, J. Alloys Compd. 630 (2015), pp. 202–208.
[47] D.G. Pettifor, Theoretical predictions of structure and related properties of intermetallics, Mater. Sci. Technol. 8 (1992), pp. 345–349.
[48] P. Jund, R. Viennois, X. Tao, K. Niedziolka, and J.C. Tédenac, Physical properties of
thermoelectric zinc antimonide using first-principles calculations, Phys. Rev. B 85 (2012), p. 423.
[49] A.L. Anderson, A simplified method for calculating the debye temperature from elastic constants, J. Phys. Chem. Solids 24 (1963), pp. 909–917.
[50] V. Tvergaard and J.W. Hutchinson, Microcracking in ceramics induced by thermal expansion
anisotropy, J. Am. Ceram. Soc. 71 (1988), pp. 157–166.
[51] B. Xiao, J. Feng, C.T. Zhou, Y.H. Jiang, and R. Zhou, Mechanical properties and chemical
bonding characteristics of Cr7C3 type multicomponent carbides, J. Appl. Phys. 109 (2011), p. 023507.
[52] K. Lau and A.K. McCurdy, Elastic anisotropy factors in orthorhombic, tetragonal, and
hexagonal Crystals, Phys. Rev. B. 58 (1998), pp. 8980–8984.
[53] P. Ravindran, L. Fast, P.A. Korzhavyi, and B. Johansson, Density functional theory for
calculation of elastic properties of orthorhombic crystals: Application to TiSi2, J. Appl. Phys.
84 (1998), pp. 4891–4904.
[54] D.H. Chung and W.R. Buessem, The Elastic Anisotropy of Crystals, in Proceeding of
International Symposium 2, F.W. Vahldiek and S.A. Mersol, eds., Plenum Press, New
York, NY, 1968, pp. 217–245.
[55] K.B. Panda and K.S.R. Chandran, Determination of elastic constants of titanium diboride
(TiB2) from first principles using FLAPW implementation of the density functional theory,
Comput. Mater. Sci. 35 (2006), pp. 134–150.
[56] S. Ranganathan and M. Ostoja-Starzewski, Universal elastic anisotropy index, Phys. Rev. Lett. 101 (2008), p. 055504.
[57] J.F. Nye, Physical Properties of Crystals: Their Representation by Tensors and Matrices, Oxford University Press, Great Britain, 1957.
[58] F. Wooten, Optical Proprieties of Solid, Academic, New York, NY, 1972.
[59] M. Alouani and J.M. Wills, Calculated optical properties of Si, Ge, and GaAs under
hydrostatic pressure, Phys. Rev. B 54 (1996), pp. 2480–2490.
[60] M. Fox, Optical Properties of Solids, Oxford University Press, New York, NY, 2001. [61] M. Dressel and G. Gruner, Electrodynamics of solids: Optical properties of electrons in
matter, Cambridge University Press, Cambridge, 2002.
[62] A. Bouhemadou and R. Khenata, Ab initio study of the structural, elastic, electronic and
optical properties of the antiperovskite SbNMg3, Comput. Mater. Sci. 39 (2007), pp. 803– 807.
[63] R. Saniz, L.H. Ye, T. Shishidou, and A.J. Freeman, Structural, electronic, and optical
properties of NiAl3: first-principles calculations, Phys. Rev. B. 74 (2006), pp. 014209. [64] D. Yonghua, M. Lishi, L. Ping, and C. Yong, First-principles calculations of electronic
structures and optical, phononic, and thermodynamic properties of monoclinic α-spodumene,
Ceram. Internat. 43 (2017), pp. 6312–6321.
[65] D. Cherrad, D. Maouche, M. Boudissa, M. Reffas, L. Louail, M. Maamache, K. Haddadi, and Y. Medkour, Ultra soft pseudo potential investigation of fundamental physical properties
of CaXO3 (X=Sn and Hf) distorted perovskites: A reference study to the perfect perovskites,
Physica B 429 (2013), pp. 95–105.
[66] G.K.H. Madsen and D.J.S. Singh, BoltzTraP. A code for calculating band-structure
dependent quantities, Comput. Phys. Commun. 175 (2006), pp. 67–71.
[67] P.C. Sreeparvathy, V. Kanchana, and G. Vaitheeswaran, Thermoelectric properties of zinc
based pnictide semiconductors, J. App. Phys. 119 (2016), p. 085701.
[68] T.J. Scheidemantel, C. Ambrosch-Draxl, T. Thonhauser, J.V. Badding, and J.O. Sofo,