Defining water sources and extent of evaporation of arctic thermokarst (thaw) ponds using water isotope tracers
Karita Negandhi, April 17, 2013
Water isotope tracers (18O, 2H) can be used in a diverse range of applications of hydrology. For instance, these stable isotope compositions can assist in linking past hydrological conditions and climate, identifying sources of water and nutrients from upstream catchments, determining the influence of climate change and anthropogenic inputs on aquatic ecosystems, and to characterize the sensitivity of ecosystems to floods, droughts, etc. to name a few (Hannah et al. 2007). These applications of water isotope tracers (18O, 2H) are often facilitated by a monthly worldwide survey of hydrogen (2H/1H) and oxygen (18O/16O) isotope composition of precipitation started in 1961 (Rozanski et al. 1993). Along with some previous studies pointing out one general feature that the isotopic precipitation depends strongly on the characteristics of the air mass the precipitation is produced from (Gambell and Friedman 1965; Miyake et al. 1968, Rindsberger et al. 1990), new studies allowed for some general trends to be noticed. Precipitation in general becomes more depleted in heavy isotopes farther away from the sea and coast, an increase in elevation, and in winter (due to temperature reducing precipitation; increased isotopic rain out). These are due to the preferential removal of heavy isotopes during precipitation formation. Therefore as an airmass (cloud) forms over the ocean and moves inland and/or increases in elevation it releases moisture by preferentially removing its heavy isotopes (18O, 2H) first. This process is called the Rayleigh Distillation and termed isotopic rainout. It results in the δ18
O values in the vapor (cloud) becoming more negative, leading to the produced precipitation also becoming negative.
A cross-plot of the δ18O and δ2
H of precipitation, collected globally from 1961-97 shows a strong linear correlation. The relationship between δ18O and δ2H is defined as δ2H = 8* δ18
O + 10, and is known as the global meteoric water line (GMWL; Craig, 1961). Here the isotopic separation of 2H is 8x greater than for 18O and varies with temperature, while the intercept is influenced mainly by humidity. This results in warm regions having isotopically enriched precipitation along the GMWL compared to cold regions. With temperatures varying with seasons, strong seasonal shifts in the GMWL can be seen, especially in cold regions (Gibson et al. 2005). Based on the GMWL relationship between 18O and 2H compositions, a Local Meteoric Water Line (LMWL) can be calculated, which usually lies close to the GMWL. Surface waters undergo evaporation, producing a heavy isotope enrichment, their 18O and 2H composition are offset from the LMWL (proportionally to their water balances), forming another linear line called the Local Evaporation Line (LEL), with slope ranging from 4 -6 (Gonfiantini 1986; Gibson et al. 2005). Studies within Canada have revealed a steepening of the LEL slope with latitude, with latitudes from 50 to 710N having a slope of 5 – 7 compared to lower latitudes having a slope of 4 – 5.5 due to northern latitudes having more pronounced seasonal effects (Gibson et al. 2005; Gat 1995). Once the LMWL and LEL are plotted (details below), the surface water isotope tracers of a series of ponds can be plotted to infer the role of evaporation compared to water input sources. In closed-drainage basins,
like the ones studied here, water inputs could include groundwater, surface runoff from snowmelt or ice melt, and precipitation. Groundwater, snow and ice melt, and
precipitation are more depleted in 18O, compared to evaporation that results in an enrichment of 18O (Craig 1961; Turner et al. 2010).
The controlling hydrological processes for thermokarst lakes are varied. Within discontinuous permafrost areas of Alaska and Siberia, the aerial coverage has been decreasing and likely due to drainage where no permafrost (ice) is present. However in Siberia, where permafrost is continuous, thermokarst lake area is increasing, reflecting different developmental stages and hydrological influences compared to thermokarst lakes in discontinuous permafrost (Smith et al. 2005).
Even so, defining thermokarst hydrology with in continuous permafrost only is not an easy task. So far a range of controlling water inputs and outputs have been reported. Evaporation, due to warmer and longer summers, was reported to be a major output of water in the Seward and Kenai Peninsulas in Alaska (Riordan et al. 2006), precipitation was identified as the controlling water level factor as the Tuktoyaktuk Peninsula (Plug et al. 2008), and both evaporation and precipitation were cited in the Old Crow Flats, Yukon territory (Labreque et al. 2009). These studies demonstrate the diverse
hydrological possibilities that can be found in continuous permafrost thermokarst systems. In addition many of these hydrological processes will change under a changing climate (Turner et al. 2010), which could ultimately play a role on the longevity of these water systems.
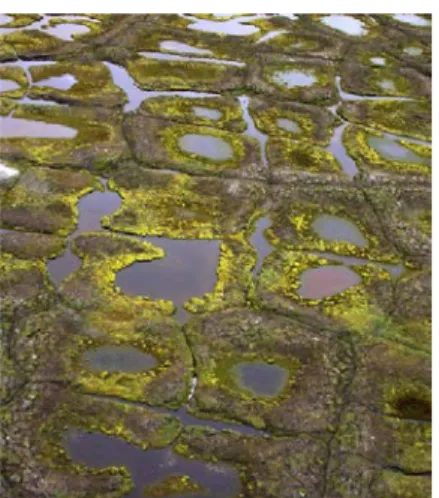
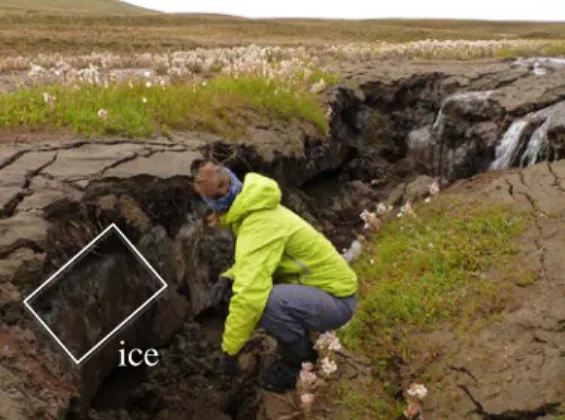
The broad question for this study was to investigate the driving hydrological process for thermokarst (thaw) ponds located in continuous permafrost of Bylot Island, Nunavut, Canada. These thaw ponds are associated with the thawing permafrost, with two distinct thaw ponds formations categorized as polygonal and runnel ponds (fig. 1). Polygonal ponds are more stable formations, allowing for the formation of thick algal mats. Comparatively, runnel ponds feature erosion and slumping along their sides due to continual permafrost thawing (Fig 2). Interestingly, between these two thaw pond formations, runnel ponds have significantly higher GHG emissions, which can be explained through the different microbial communities found in the surface sediments. Both thaw pond formations are closed water bodies, meaning they do not receive water input from other surrounding water bodies and do not currently drain due to the existing permafrost. There are a few ponds that can be flooded by a nearby glacial river, but they were not sampled in this study and make up marginal area of the thaw ponds in the studied valley. In addition, both pond formations are fairly shallow (≤3m), leaving them to be highly influenced by precipitation (snow and rain) and evaporation. Input water from the ground ice is also a possibility.
Figure 1. Landscape showing runnel and polygonal ponds.
While these ponds are small, they do have substantial GHG emissions rendering them important to study. Due to their small size, the study of their hydrology is not possible with remote sensing, leaving the use of water isotopes to be an especially useful tool. Water isotopes were employed to identify the source of water inputs and outputs, and also quantify their importance. This could have very important implications, as potential
hydrological differences between polygonal and runnel ponds could lead to one drying out faster, or becoming deeper. Drying out and pond deepening can both have impacts on CH4 production, as an anoxic sediment layer is needed for CH4 production, and deepening could result in more CH4 oxidation before escaping to the atmosphere. In addition, water isotopes can help in determining any differences in water sources between the pond formations. The sources of water input in these thaw ponds could be very important for the biogeochemical cycles, as dissolved organic carbon (DOC) and solutes (nitrate, sulfate, and potassium) were derived from ground ice in thaw ponds in Alaska (Douglas et al. 2011).
Methods
Water samples were collected from a total of 17 thaw ponds and 2 lakes on July 20, 2012 from Bylot Island. These 17 thaw ponds can be further classified by their geomorphology as polygonal and runnel shaped ponds, with 8 samples from polygonal ponds and 9 from runnel ponds. In addition, 2 lakes were also sampled. These water samples consisted of collecting 30ml of surface water filled to the brim, without any air bubbles. Two ground ice samples were also collected by placing ice in a plastic bag to melt completely and then to a 30ml bottle filled to the brim. Ice samples
were collected on August 15, 2012, in one area within the same valley but not in the area of the thaw ponds (fig. 3) as most ice had melted at this point.
After collection, these samples were sent to the Environmental Isotope Laboratory at the University of Waterloo for oxygen and hydrogen isotope analysis. Temperature (5.99°C) and humidity (81.9%; Environment Canada, 2012) values used for the following
calculations were averaged from June and July of 2012. Initial calculations using just July temperature and humidity (8.1°C; 81.2%) were also performed but were decided not to be
Figure 2. Collapsed and slumping peat polygon ridges forming runnel ponds
Figure 3. Location of ice sample collected within the ground, where you can see no ponds are nearby
used since the ponds were influenced by meteorological conditions during both months (Table 1).
From the local humidity (decimal notation) and temperature (K) key reference points were calculated to establish the Local Evaporation Line, and all used in decimal notation.
The equilibrium liquid-vapor isotopic fractionation (α*) (Horita and Wesolowski 1994): for 18O: 1000 ln α* = -7.685 + 6.7123(103/T) – 1.6664(106/T2) + 0.35041(109/T3)
and 2H: 1000 ln α* = 1158.8(T3/109) – 1620.1 (T2/106) + 794.84(T/103) – 161.04 + 2.9992(109/T3)
The equilibrium separation between liquid and vapor phases (ε*)(Horita and Wesolowski 1994):
ε* = (α* - 1)
The kinetic separation (εk) (Gonfiantini 1986): For 18O: εk = 0.0142(1-h)
For 2H: εk = 0.0125 (1-h)
Once these were calculated some key isotopic framework parameters could be further calculated. The ambient atmospheric moisture (δAs) (Gibson and Edwards 2002): δAs = (δps - ε*)/ α*
Where δps is the vapor composition that was obtained from the closest Canadian Network for Isotopes in Precipitation (CNIP) field station located at Resolute Bay. Initially, δps reported for northern Canada from Gibson and Edwards (2002) were used, but this resulted in all ponds plotting beyond δ*, which is impossible since they were not dried out, and also a below average LEL slope (4.9) when it should be around 6 for higher latitudes. Therefore, δps values were used from the closest recorded CNIP data at Resolute Bay (Table 1).
Next the Local evaporation line (LEL) was calculated based on a few key reference points (Table 1):
1) The steady state 18O and 2H values of the pond water when inflow = flux of evaporation (δssL).
Where the special case of δI = δp, and δp is the amount-weighted mean annual
precipitation reported in Gibson and Edwards (2002). δp lies on the GMWL and anchors the intersection of the LEL and GMWL.
2) The limiting state of the δ18O and δ2
H values of the pond water (i.e. the last drop of water before the pond is completely dried up; δ* was also calculated (Gonfiantini 1986). δ* = (h δAs + εk + ε*/ α*) / (h - εk - ε*/ α*)
Once the LEL could be plotted, from the above calculations, interpretation of the data could be made by plotting the thaw ponds’ and lakes’ isotopic signatures. Then
quantitative information was gained by calculating an individual δI value for each pond to indicate its input source. The δI value is based on the assumption that each pond has an evaporating flux (δE), and that since the thaw ponds are under similar atmospheric conditions will all eventually reach an end point at δ* (if they were to evaporate to desiccation). Therefore, a line from δE (calculated for each pond individually; Craig and Gordaon 1965) to δ* will have an intersection on the GMWL that will indicate its input source (δI) (Yi et al. 2008).
δE = [((δL - ε*)/α*) - h δAs - εk] / (1 – h + εk)
With the δE plotted (for each pond), a line to δ* can be drawn, with the intercept on the GMWL indicating the δI value. From here an evaporation to input (E/I) ratio can be calculated.
E/I ratio = (δI – δL) / (δE – δL)
Results
Isotopic framework parameters were determined under two different scenarios 1) averaged temperature and humidity values for June – July, 2) temperature and humidity for July only. One difference between the two scenarios is that under scenario 2, the δAs,
δSSL and δ* are slightly more enriched (Table 1). While these are important differences, ultimately the average temperature and humidity values from June – July were used due to the pond waters being influenced by both June and July temperature and humidity at the time of sampling.
Table 1: Two different isotopic framework parameters for the LEL, based on temperature and humidity averaged from June – July, and only July values.
With the plotting of the water sample δ18O vs δ2H values along with the GMWL and the calculated LEL (Fig. 4), the ponds all fall above δssL and also along the LEL indicating the strong role of evaporation. Comparatively, the lakes are not as isotopically-enriched indicating less importance of evaporation and they plot above the LEL indicating influence by rain water.
1) Temp. and humidity from June - July
2) Temp. and humidity for July T (°C) 5.99 8.1 h (%) 81.9 81.2 δ18 OAs, δ 2 HAs (‰) -28.83, -214.60 -28.61, -212.44 δ18 Op, δ2Hp (‰) -24, -182 -24, -182 δ18 Ops, δ2Hps (‰) -18, -134 -18, -134 δ18 OSSL, δ 2 HSSL (‰) -14.58, -125.45 -14.49, -125.59 δ18 O*, δ2H* (‰) -12.43, -111.13 -12.22, -110.66
Figure 4: Plot of polygonal ponds, runnel ponds, lake and ice δ18O vs δ2H values in reference to the local evaporation line, showing a high influence of evaporation for polygonal and runnel ponds.
To further characterize the input sources, a plot of the calculated δI values (Fig. 5) show more of a separation between the polygonal and runnel ponds. All of the lakes and runnel pond δI values are above (more enriched) δp indicating a rainfall input source, compared to polygonal ponds, which all plot below (more depleted) δp indicating snow as the input source. The E/I ratios are also higher for the polygonal ponds and therefore in general have a higher drawdown due to evaporation (Table 2). Although when looking at all the E/I ratios (Fig. 6), there are 2 runnel ponds with fairly high E/I ratios pointing out that they too can be highly affected by evaporation.
Figure 5: Plot of calculated δI (source of input) δ18O and δ2H along the global mean water line, showing an input source of snow for polygonal ponds, and rain for runnel ponds and lakes.
Table 2: Average E/I ratios indicate an importance of evaporation for both pond formations, but higher for polygonal ponds, with lakes having a very low influence of evaporation.
E/I Ratios (evap./input) Polygonals n=8 1.15 ± 0.74 Runnels n=8 0.67 ± 0.83 Lakes n=2 0.10 ± 0.09
Figure 6: E/I ratios of polygonal and runnel ponds and 2 lakes, indicating high evaporation output close (or higher) to 1.
Discussion
With a predicted increase in temperature, an accompanying earlier seasonal ice melt in the Arctic is likely to happen and refreeze later, producing a longer ice free season. A longer ice-free season will provide more time for evaporation water level draw down, but also a possibility of more precipitation and thawing of permafrost to provide as water inputs (Wolfe et al. 2011). In such shallow ponds, water inputs and outputs can easily lead to desiccation or expansion. Knowing which one plays a higher role will be of importance for the future status of these shallow thaw ponds, and also could reveal to be a factor in the thaw ponds GHG production with further investigation due to changes in water level or nutrients.
With July being the warmest month on Bylot Island, it would be the time where the most evaporation is expected. This could explain why both polygonal and runnel ponds are strongly influenced by evaporation (E/I ratios above 0.5; Table 2; Fig. 6). Although, when considering that the year 2012 was an exceptionally high precipitation summer with a total of 50mm in July 2012, compared to an average of 30.5mm (from years 1971 – 2000), along with the temperature for July 2012 (8.1°C) falling within a similar range, compared to the last 3 years ranging from 8 to 9.9°C, the influence of evaporation seen even under these conditions is a strong indication that evaporation is a major drawdown force on these ponds. A strong evaporation influence corresponds with the occasional noticeable physical observations of pond dry up or water level draw down seen in previous filed sampling years and no underground water drainage known.
Polygonal ponds did show high levels of evaporation drawdown, which could indicate that they are more likely to dry up than runnel ponds, but the amount of their input water source at the beginning of the summer could override this. The polygonal ponds may be
more susceptible to evaporation due to having a more circular shape and therefore having more surface area for evaporation.
Interestingly, the runnel pond with the highest E/I ratio of 2.7 (BYL 77) was also the runnel pond with the most depleted δI signatures (fig. 5) and the pond with the most enriched signatures plotting closest to δ* (fig. 4). This runnel pond in the previous year (2011) was close to being dried out (Fig. 7). Comparatively, polygonal pond BYL22, had the lowest E/I ratio (< 0.5), the second most enriched δI signatures among polygonal ponds (Fig. 5), and it is also one of the smaller polygonal ponds. Therefore these are good indications that further investigation needs to be done and we cannot assume all
polygonal ponds will dry up faster than runnel ponds due to them averaging higher E/I ratios (Table 2).
Figure 7: comparison of a smaller sized runnel (BYL77; left) to a larger one (BYL28; right)
The water balance of these shallow (≤ 3m) ponds is likely to change through out the summer. At the start of summer (early June) when the ponds are thawing additional water input sources are likely to be available such as ice and snow. For this to be determined, samples of snow and rain would be helpful too. With the current data there is indication of possible ground ice input, with two polygonal ponds having δI signatures close to the sampled ground ice signatures (-26.4, -200.5; fig. 5). Actual ground ice has not been observed, but the active permafrost layer is only 40 – 60cm deep and runnel ponds are formed on top of ice wedges. Therefore it is possible that with more ice samples (closer to the thaw pond locations and closer to the surface) and water samples collected earlier in the summer season, further ice input significance could be revealed.
The water balance in these thaw ponds could be very similar to thaw lakes in eastern Siberia where there are no stream networks and minimal runoff except from snow, leaving evaporation as the dominant output (Ishii and Yabuki, 2001). In this system melted permafrost ice from the lower active layer was a constant source of input from May to August (Ichiyanagi et al. 2003). At Bylot Island, a few ponds indicated ice input at the end of July. This leaves the potential for permafrost ice to be a potential source of water for more thaw ponds at the beginning of the summer. Also, as reported in
Ichiyanagi et al., the ice input was from the lower active layer (2003). Samples taken for this study were from the lower active layer, but samples from the upper active layer
should be taken in addition. With permafrost ice being reported as a possible source nutrients (Douglas et al. 2011), a change in thaw pond water sources through out the summer could be a player contributing to the variable GHG emissions measured through out the summer.
The significance of snow vs rainwater in terms of nutrients is not known but could be easily tested. It has been shown that snow contains microbes, with 47% of cyanobacterial operational taxonomical units (OTUs) found in high Arctic snow also being found within microbial mats in the same region (Harding et al. 2011). Polygonal ponds did have more snow input and also have more cyanobacteria compared to runnel ponds, but the
significance of this result would have to be further test, as the same cyanobacterial OTUs found in the snow may not be the same ones found in the polygonal ponds. This could be interesting to pursue further as cyanobacteria play an important role resulting in
Literature Cited
Brock, B.E., Wolfe, B.B. and Edwards, T.W.D. 2007.Characterizing the hydrology of shallow floodplain lakes in the Slave Rver delta, NWT, Canada, using water isotope tracers. Arctic, Antarctic, and Alpine research, 39: 388-401.
Craig, H. 1961. Isotopic variations in meteoric waters. Science 133, 1702-1703.
Craig, H., and Gordon, L. I., 1965: Deuterium and oxygen 18 variations in the ocean and marine atmosphere. In Tongiorgi, E. (ed.), Stable Isotopes in Oceanographic Studies and Paleotemperatures. Pisa, Italy: Laboratorio di Geologia Nucleare, 9–130.
Douglas, T.A., Fortier, D., Shur, Y.L., Kanevskiy, M.Z., Guo, L., Cai, Y., Bray, M.T. 2011. Biogeochemical and geocryological characteristics of wedge and thermokarst-cave ice in the CRREL permafrost tunnel, Alaska. Permafrost and Periglacial Processes, 22: 120-128
.
Gambell, A.W. and Friedman, I. 1965. Note on the Areal Variation of
Deuterium/Hydrogen Ratios in Rainfall for a Single Storm Event. Journal of Applied Meteorology, 4:533-534.
Gat, J. R., Stable isotopes of fresh and saline lakes, in Physics and Chemistry of Lakes, edited by A. Lerman et al., pp. 139–165, Springer-Verlag, New York, 1995.
Gibson, J. J., and T. W. D. Edwards. 2002. Regional water balance trends and
evaporation-transpiration partitioning from a stable isotope survey of lakes in northern Canada, Global Biogeochem. Cycles, 16(2), doi:10.1029/2001GB001839.
Gibson, J. J., Edwards, T. W. D., Birks, S. J., St Amour, N. A., Buhay, W. M.,
McEachern, P., Wolfe, B. B. and Peters, D. L. 2005. Progress in isotope tracer hydrology in Canada. Hydrol. Process., 19: 303–327. doi: 10.1002/hyp.5766.
Gonfiantini, R., Environmental isotopes in lake studies, in Handbook of Environmental Isotope Geochemistry, vol. 3, edited by P. Fritz, and J. C. Fontes, pp. 113–168, Elsevier, New York, 1986.
Hannah, D. M., Sadler, J. P. and Wood, P. J. 2007. Hydroecology and ecohydrology: a potential route forward? Hydrol. Process, 21: 3385–3390. doi: 10.1002/hyp.6888.
Harding, T., Jungblut, A.D., Lovejoy, C. and Vincent, W.F. 2011. Microbes in High Arctic snow and implications for the cold biosphere. App. Env. Microbio., 77:3234-3243.
Horita, J., and Wesolowski, D., 1994: Liquid-vapour fractionation of oxygen and hydrogen isotopes of water from the freezing to the critical temperature. Geochimica et Cosmochimica Acta, 58:3425–3497.
Seasonal variation in stable isotope composition of alas lake water near Yakutsk, Eastern Siberia. Geochemical Journal, 37:519-530.
Ishii, Y. and Yabuki, H. (2001) Water and energy fluxobservation over an alas lake. Activity Report ofGAME-Siberia 2000, GAME Publication 26, 101–104.
Labreque, S., Lacelle, D., Duguay, C., Lauriol, B., Hawkings, J., 2009. Contemporary (1951–2001) evolution of lakes in the Old Crow Basin, northern Yukon, Canada: Remote sensing, numerical modeling, and stable isotope analysis. Arctic 62, 225–238.
Miyake, Y., Matsubaya, O. and Nishihara, C. 1968. An Isotopic study on meteoric precipitation. Papers in Meteorology and Geophysics, 19: 243-266.
Plug, L.J., Walls, C., Scott, B.M., 2008. Tundra lake changes from 1978 to 2001 on the Tuktoyaktuk Peninsula, western Canadian Arctic. Geophysical Research Letters
35, L03502. doi:10.1029/2007GL032303.
Rindsberger, M., Jaffe, Sh., Rahamim, Sh. And Gat, J.R. 1990. Patterns of the isotopic composition of precipitation in time and space: data from the Israeli storm water
collection program. Tellus B, 42: 263–271. doi: 10.1034/j.1600-0889.1990.t01-2-00005.x
Riordan, B., Verbyla, D., McGuire, A.D., 2006. Shrinking ponds in subarctic Alaska based on 1950–2002 remotely sensed images. Journal of Geophysical Research 111, G04002. doi:10:10.1029/2005JG000150.
Rozanski, K., Araguâs-Araguâs, L. & Gonfiantini, R. (1993) Isotopic patterns in modem global precipitation. In:Climate Change in Continental Isotopic Records, ed. by P. K. Swart, K. C. Lohmann, J. McKenzie & S.Savin, 1-37. Geophysical Monograph 78, American Geophysical Union.
Smith, L.C., Sheng, Y., MacDonald, G.M., Hinzman, L.D., 2005. Disappearing arctic lakes. Science 303, 1429.
Turner, K. W., Wolfe, B.B. and Edwards, T.W.D. 2010. Characterizing the role of hydrological processes on lake water balances in the Old Crow Flats, Yukon Territory, Canada, using water isotope tracers. Journal of Hydrology, 386: 103-117.
Wolfe, B.B. Light, E.M., Macrae, M.L., Hall, R.I., Eichel, K., Jasechko, S., White, J., Fishback, L. and EdwardsT.W.D. 2011. Divergent hydrological responses to 20th century climate change in shallow tundra ponds, western Hudson Bay Lowlands. Geophysical Research Letters, 38, DOI: 10.1029/2011GL049766.
Yi, Yi, Brock, B.E., Falcone, M.D., Wolfe, B.B. and Edwards, T.W.D. 2008. A coupled isotope tracer method to characterize input water to lakes. Journal of Hydrology, 350:1-13.