DISTRIBUTION OF TEMPERATURE AND SALINITY IN THE CANADIAN ARCTIC ARCHIPELAGO DURING THE 2006 ARCTICNET SAMPLING
EXPEDITION
(FROM AUGUST 22nd TO NOVEMBER 9TH 2006)
By
Annie Simard1, Marie-Emmanuelle Rail1 and Yves Gratton1
1
INRS-Eau, Terre et Environnement 490, de la Couronne
Québec, Qc Canada, G1K 9A9
2010, INRS-Eau, terre et environnement
CORRECT CITATION FOR THIS PUBLICATION :
Simard, A., M.E. Rail and Y. Gratton. 2010. Distribution of temperature and salinity in the Canadian Arctic Archipelago during the 2006 ARCTICNET sampling expedition (from August 22nd to November 9th 2006). Report No R1127,
This report presents the CTD (Conductivity, Temperature and Depth) data obtained during the 2006 ArcticNet expedition held between August 22nd and November 9th in the Canadian High Arctic. The report also contains information on the data obtained by the Self Contained Autonomous Micro Profiler (SCAMP), moorings and ship mounted Acoustic Doppler Current Profiler (SM-ADCP) that were recorded during the same expedition. Detailed maps of sampling sites for each Arctic region are included. CTD’s temperature and salinity data are presented as contour plots following West-East or South-North sections. Examples of ADCP and SCAMP data are also included.
RÉSUMÉ
Ce rapport présente les données de CTD (conductivité, température et profondeur) recueillies au cours de la mission ArcticNet 2006 qui s’est déroulée dans l’Arctique canadien du 22 août au 9 novembre. Il présente également des informations sur les données du Self Contained Autonomous Micro Profiler (SCAMP), du Acoustic Doppler Current Profiler (ADCP) de coque et des informations sur les données de mouillage récupérées au cours de la même mission. Des cartes détaillées montrant les sites d’échantillonnage pour chacune des régions arctiques y sont incluses. Les données de température et de salinité du CTD y sont illustrées sous forme de contours effectués le long de sections ouest-est ou sud-nord. Deux exemples des données enregistrées par le SCAMP et un ADCP sont présentés.
LIST OF APPENDICES………... v
FOREWORD……… vi
1. INTRODUCTION……….. 1
2. SAMPLING PROGRAM………... 2
ROSETTE………. 2
SELF CONTAINED AUTONOMOUS MICRO PROFILER (scamp)……... 3
MOORINGS………. 4
SHIP MOUNTED ACOUSTIC DOPPLER CURRENT PROFILER (adcp).. 6
3. DATA PROCESSING AND QUALITY CONTROL……… 7
ROSETTE-CTD DATA……… 7
MOORINGS DATA………. 7
MOORED ADCP DATA………...……….. 7
4. DISCUSSION………..……….. 8
5. ACKNOWLEDGMENTS……….. 9
6. REFERENCES………... 9
TABLES………... 11
FIGURE 1 ArcticNet study area in 2006………. 1
FIGURE 2 Rosette sampling sites……… 3
FIGURE 3 SCAMP sampling sites……….. 4
FIGURE 4 Moorings location (2005-2006)………. 5
FIGURE 5 Moorings location (2006-2007) ……… 5
FIGURE 6 Moored-ADCP and ship-mounted ADCP sampling sites…………. 6
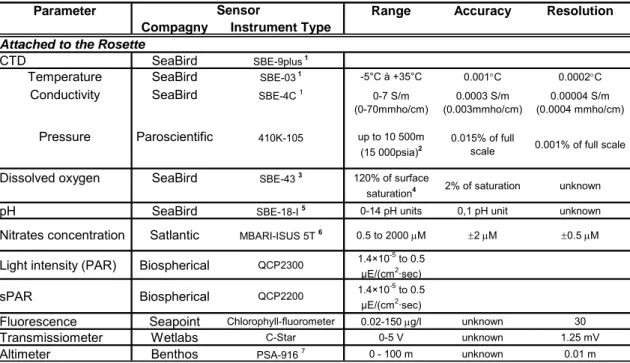
LIST OF TABLES TABLE 1 Rosette sensors specifications……… 11
TABLE 2 Summary of Rosette sampling………... 11
TABLE 3 List of Rosette sections and casts………...…... 12
TABLE 4 Summary of moored instruments 2005-2006……… 13
TABLE 5 Content of the ASCII Rosette-CTD data files………... 14
LIST OF APPENDICES APPENDIX 1 Higher resolution maps of Arctic areas where Rosette-CTD, SCAMP and moorings data were collected………….……….. 15
APPENDIX 2 Rosette-CTD data logbook……… 25
APPENDIX 3 SCAMP data logbook……….………... 32
APPENDIX 4 SCAMP data plots example……….……….. 38
APPENDIX 5 Plots of salinity and potential temperature, Leg 1………. 41
APPENDIX 6 Plots of salinity and potential temperature, Leg 2………. 55
Engineering Research Council of Canada (NSERC) and the Social Sciences and Humanities Research Council of Canada (SSHRC) and Industry Canada, have combined their efforts to financially support and oversee the initiatives of the NCE. (NCE web site at http://www.nce.gc.ca)
ArcticNet is one of the NCE networks and brings together scientists and managers in the natural, environmental, social sciences and human health. Several Inuit organizations, northern communities, as well as government and industrial agencies have joined ArcticNet in their mission. More than 100 ArcticNet researchers and students from 28 Canadian universities and 5 Federal departments collaborate on 27 research projects with teams from U.S.A., Japan, Denmark, Norway, Poland, the U.K., Spain, Russia, Greenland and France.
The ArcticNet Network investigators study the impacts of climate change in Canadian Arctic to assess the effect of ongoing warming and modernization on Canadian Arctic ecosystems, economies and societies, and help Canadians face the impacts and opportunities that may occur due to climate change in the Arctic. ArcticNet’s structure is set to translate the growing understanding of the changing Arctic ecosystem into national policies, adaptation strategies and impact assessment studies conducted on societies and marine / terrestrial coastal ecosystems in the Canadian High Arctic, the Eastern Arctic, Hudson Bay and Eastern Sub Arctic. (Please see the ArcticNet Annual Report 2004-2005 for more information). (ArcticNet web site at http://www.arcticnet.ulaval.ca)
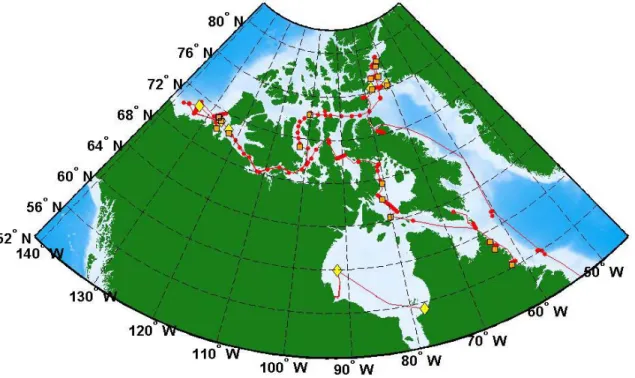
ArcticNet’s 2006 expedition was carried out from August 22nd to November 9th. During the first six weeks (leg 1 or 0602), the ship covered the coastal Canadian Arctic (Fig. 1) from Northern Baffin Bay in the East to Beaufort Sea in the West. On September 28th, it started a second six weeks journey (leg 2 or 0603) sailing through the Northwest Passage again, but passing through Bellot Strait, Gulf of Boothia and Foxe Basin to end up in Hudson Strait.
FIGURE 1. ArcticNet 2006 study area. Ship track is illustrated as a red line,
Rosette-CTD sampling locations are represented by red dots, yellow diamond-shaped dots show mooring sites and SCAMP sampling stations are represented by orange squares.
This report provides the ArcticNet community with a synthesis of the available data recorded during this 3-month expedition. Enclosed data consists of 253 Rosette-CTD (Conductivity Temperature Depth profiler) and 82 SCAMP (Self Contained Autonomous Profiler) profiles. Also included is information about a year of data recorded by 27 different instruments from nine (recuperated) mooring lines as well as current data recorded along the ship track by a ship mounted ADCP (Acoustic Doppler Current Profiler).
oceanography of the Northwest Passage was the subject of a chapter in a special issue of «The Sea» (volume 14, part B, 2005). In this paper, McLaughlin et al. presented their comprehensive study of all the oceanographic aspects and processes encountered in the Northwest Passage and explain in details the physical and chemical oceanography of this area. The Beaufort Sea and Amundsen Gulf are the Canadian Arctic regions that have been studied the most extensively over the years, especially during the Canadian Arctic Shelf Exchange Study (CASES) program and subsequently during ArcticNet expeditions and later on this year during various projects involved with the Circumpolar Flaw Lead System Study (CFL) and the International Polar Year (IPY) programs. All the publications regarding the CASES projects can be found on the CASES website (at http://www.cases.quebec-ocean.ulacal.ca). In 2008, the Journal of Geophysical Research published eleven papers from the CASES program in a special issue, volume 113, number C3. The same year, a book containing a synthesis of the work performed in every main research subject of the program was edited by L. Fortier, D. Barber and J. Michaud. It was titled : On thin Ice. Simard et al. (2008) have also prepared a synthesis report regarding the CTD profiles and other physics data generated during the CASES 2002-2004 expeditions. The oceanography of the Beaufort Sea was also discussed by Ingram et
al. in part «A» of the special issue of «The Sea» (volume 14, part A, 2005).
2. SAMPLING PROGRAM
Rosette
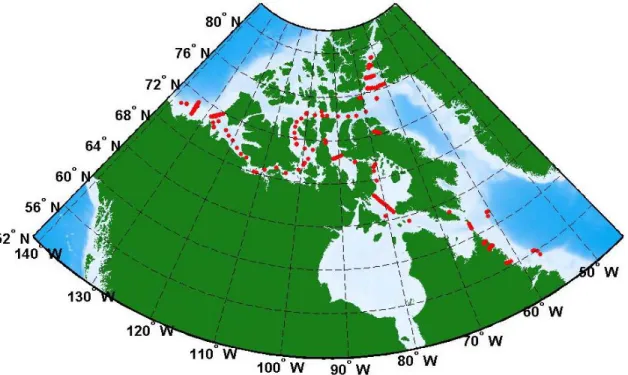
During the 2006 expedition, the rosette was equipped with 24 «Niskin» 12 L bottles, a CTD SeaBird 911+ and eight independent sensors (see Table 1 for sensors specifications). It was deployed from the ship and lowered into the water column at a rate of 1 m s-1. CTD profiles were carried out in the Canadian Arctic and Hudson Bay (see Fig. 2 and Appendix 1A) following a schedule of 6 sections, 72 stations and 115 casts during Leg 0602 and a schedule of 11 sections, 105 stations and 138 casts during Leg 0603 (see Table 2 and Table 3). A summary and the «Logbook» of the CTD profiles available for all stations are presented in Appendix 2 and in Rail (2006a and 2006b) sampling reports. Appendix 2 also presents the «Logbook» of the 7 CTD profiles performed in 2006 during a short mooring deployment and recovery expedition in Hudson Bay on the CCGS Pierre Radisson.
FIGURE 2. 2006 Rosette sampling sites
The processing and quality control of CTD data are presented in section 3 of this report. As a general «rule of thumb» CTD data are reserved for the ArcticNet Network Investigators for a period of 3 years. After this period, data will be hosted on the ArcticNet and/or the Integrated Service Data Management (ISDM) website and will be available to the international community.
Self Contained Autonomous Micro Profiler (SCAMP)
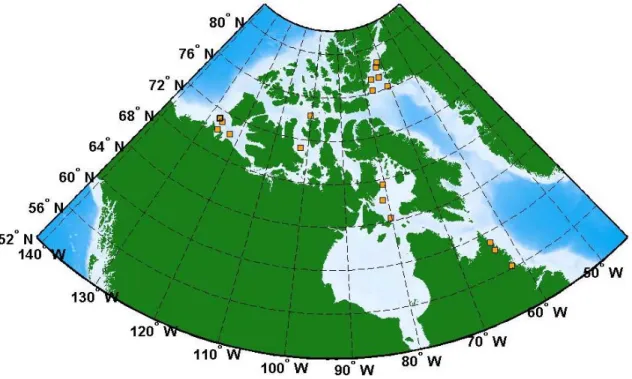
The SCAMP is a CTD-type profiler. It samples at a frequency of 100 Hz (i.e. 100 times per second). It free falls at approximately 10 cm s-1, resulting in a vertical resolution of approximately one (1) millimetre, down to a maximum depth of 100 m. The instrument measures the temperature and salinity fluctuations at the micro-scale in order to estimate the turbulent mixing occurring in the water column. To properly measure (as opposed to “estimate”) turbulence we should also be measuring the velocity fluctuations. Unfortunately, we do not have velocity sensors (due to budget limitations). The current sensors on the SCAMP include temperature (three sensors), salinity (i.e. conductivity; two sensors), a PAR (Photosynthetically Active Radiation) and fluorescence.
FIGURE 3. SCAMP 2006 sampling sites
Moorings
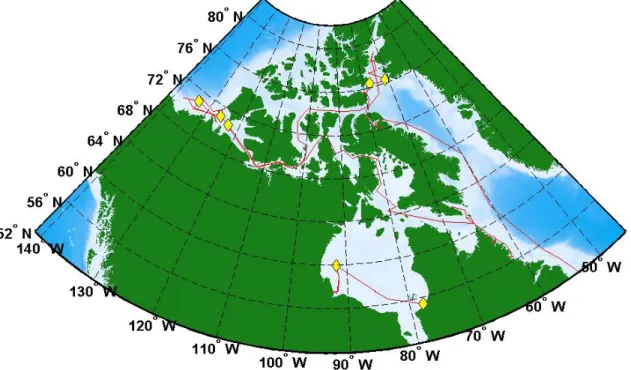
Nine moorings deployed in Beaufort Sea, Baffin Bay and Hudson Bay in 2005 were retrieved in August, September and October of the 2006 (see Fig. 4 and Appendix 1C). A summary of the 34 instruments, sensors, and validated data is presented in Table 4. The instruments included five RDI 300 kHz Workhorse ADCPs, two RDI 75 kHz Long Ranger ADCPs, eight Aanderaa RCM-11 (Recording Current Meters), six Aanderaa RCM-4 (Recording Current Meters), four Aanderaa RCM-7, three Alec conductivity-temperature sensors, four Sea-Bird SBE-37 conductivity-temperature sensors and two Sea-Bird SBE-26 wave and tide recorders. The data recovery was only partly successful due to instrument malfunctions and two moorings were never recovered (BA04-05 and AN02-05). Michaud et al. (2006) and Rail et al. (2010) have summarized all the problems encountered in their technical report. Some of the recovered moorings were processed and redeployed for another year of measurements (see Fig. 5 and Appendix 1C). ArcticNet moorings are identified according to the following guidelines: the letters and the first two digits represented the location (CA: Beaufort Sea; BA: Baffin Bay and AN: Hudson Bay); the last two digits are the deployment year.
FIGURE 4. Moorings deployed in 2005 and recovered in 2006 CA AN BA AN BA CA
m cell from 8 m under the ship hull to maximum bottom tracking depth. Averages are available for a five and a ten minutes period. The ADCP setting was changed at the end of the first leg in an attempt to synchronize the hull ADCP with another sensor (an EK-60) mounted close to the ADCP on the Amundsen’s hull. Because of sound attenuation by the ice window, the maximum bottom-tracking depth is around 240 m. This value is reduced to 100-150 m when the ship is steaming.
Data validation was not performed. Tests were done at the beginning of the expedition in the St Lawrence River near Sept-Îles and the collected data was saved for use in future data validation processes. Note that the raw data is available upon request.
FIGURE 6. Moored-ADCP deployed in 2006 and ship-mounted ADCP sampling sites.
The moored-ADCP stations are illustrated by yellow diamond markers and the ship-mounted ADCP is illustrated by the red ship track.
Rosette-CTD data
Rosette-CTD data processing and quality control are described in detail by Guillot (2003, 2006a and 2006b). The «READ ME » file attached to each yearly CTD data set also presents the most important processing steps and changes made to the data files. All users should read these files so they can be aware of data limitations.
Processing included the following steps: calibration of coefficients, conversion of data to physical units, alignment correction and extraction of useless data. Oxygen sensor calibration was done using Winkler titrations and salinity data were compared with water samples analysed with a Guildline 8400B autosal. The CTD data were passed through a quality control test based on UNESCO’s algorithm standards (1990). The recorded data were averaged every 1 db. The computed oceanographic parameters (see Table 5) were calculated using the averaged recorded data. Missing data were linearly interpolated. Finally, there is one ASCII file for every CTD cast. The content of a typical ASCII file is shown in Table 5.
CTD profiles cover the water column down to 10 meters from the sea-bed. To reduce the amount of information presented in this report, temperature and salinity contours are only provided for each section shown on Fig. 2 and Appendix 1A. The contours are presented in Appendices 5 and 6. All the profiles along the same section were used in the interpolation process. The temperature and salinity data were interpolated on a 5 km by 5 m grid with a triangle-based cubic interpolation method and contoured in Matlab®. The origin of each section is the westernmost or southernmost cast. For the West-East sections, Canada is on the left and Greenland on the right; for the South-North sections, South is on the left and North on the right.
Mooring data
Processing steps for mooring data are described in Rail et al. (2010). It consisted of meta-data and calibration coefficients validation, control of the instrument depth and clock, and comparison of mooring data with Rosette-CTD data recorded at the same location. Instrument depths and salinity data were corrected by adding an offset when requested. Erroneous time tags were corrected. Missing data and questionable data are mentioned in the quality control report, and they were replaced by NaNs. Users should consult the Quality Control Report (Rail et al. 2010). ASCII files were created for every instrument (Table 4).
Moored ADCP data
The processing and quality control of ArcticNet ADCP data are still ongoing. The quality control procedures on ADCP data were adapted from the «ADCPtools» box of the U.S. Geological Survey’s «Sediment Transport Instrumentation Group». The «ADCPtools» functions used by the USGS were adapted to the peculiarities of
4. DISCUSSION
The sampling area covered by the ArcticNet 2006 expedition was huge (as usual): Hudson Bay and Strait, Foxe Basin, northern Baffin Bay, Canadian Arctic Archipelago, Amundsen Gulf and southern Beaufort Sea. The associated data base is enormous and will take a few years to process. In a twelve-week (two six-week legs) yearly expedition we can barely obtain a snapshot of the four sub-regions. The CAA is much better sampled this year. Of special interest are the first and only ArcticNet sections in Foxe Basin (Appendix 6).
Three on-going studies are worth mentioning. Romain Lanos has completed his study of southern Beaufort Sea and Amundsen Gulf using the CASES (Canadian Shelf Exchange Study) and ArcticNet 2004-2006 CTD data. In his Ph.D. thesis (Lanos 2009), he describes the regional and seasonal variability in the Beaufort Sea – Amundsen Gulf region. An on-going study of the SCAMP turbulent profiles (C. Sévigny, Ph.D. thesis in progress) show from the 2005 data, that the turbulence is dominated by double-diffusive processes in Smith Sound. Additional SCAMP profiles were obtained in CAA and Beaufort Sea in 2006. We observed that the turbulent mechanical processes (probably wind and tidal mixing) are dominating the double-diffusive processes in Beaufort Sea and Amundsen Gulf. Current pulses were observed in the 2003-2004 and 2004-2005 mooring data at CA04. The pulses have been related to storms in Bering Strait by C. Bélanger (Bélanger et al., submitted). Once the 2007-2008 data has been processed we will have a six year time series of the general conditions in Beaufort Sea and Smith Sound.
We thank Captains Julien and Gariépy and their crew aboard the CCGS Amundsen for their outstanding collaboration. We also thank the «Rosette team», Véronique Lago, Stéphane Thanassekos, and all the «Rosette monkeys» for their outstanding sampling effort cast after cast after cast. Thanks to the mooring team: Luc Michaud, Pascal Massot, Sylvain Blondeau, Alexandre Forest, Louis Létourneau and Marc Robitaille. Thanks to Caroline Sévigny and Dany Dumont for their zodiac outings in order to obtain the SCAMP profiles. And last but not least, many thanks to Pascal Guillot for his data processing efforts.
6. REFERENCES
Bélanger, C., Y. Gratton, D. Dumont, A. Forest and L. Fortier. Observations of remote- wind-induced pulses of current under ice cover in the Canadian Beaufort Shelf Region. Submitted to Geophys. Res. Letters.
Fortier, L. D. Barber and J. Michaud [Eds], 2008. On thin Ice. Aboriginal Issues Press, Winnipeg, 215 p.
Blondeau, S., P. Massot, A. Forest, and L. Létourneau. 2006. Mooring Operation Cruise Report ArcticNet 2006 – Leg 1. Internal report, Laval University, Québec (Qc): 3 p. Gratton, Y., M. Ouellet, M.E. Rail, and R.G. Ingram. 2006. Distribution of temperature
and salinity in Northern Baffin Bay during the International North Water program (August 1997, April to July 1998, and September 1999). Internal Report No R897, INRS-ETE, Québec (Qc): x + 124 p.
Guillot, P. 2003. Sea-Bird CTD Processing and Quality Control Procedure. Technical report, draft version, Québec-Océan, Université du Québec à Rimouski: 42 p.
Guillot, P. 2006a. Processing notes about the ArcticNet 0602 data. Technical Report, Québec-Océan, Université du Québec à Rimouski: 41 p.
Guillot, P. 2006b. Processing notes about the ArcticNet 0603 data. Technical Report, Québec-Océan, Université du Québec à Rimouski: 88 p.
Guillot, P. 2007. Rapport de traitement de données Workhorse ADCP (Acoustic Doppler Current Profiler). Technical report, draft version, Québec-Océan, Université du Québec à Rimouski, 99 p.
Ingram, R.G., E.C. Carmack, F.A. McLaughlin, and S. Nicol. 2005. Polar Ocean Coastal Boundaries, chapter 3 in: The SeaIdeas and Observations on Progress in the Study
Observations on Progress in the Study of Seas, Volume 14 part B, A.R. Robinson
and K.H. Brink (eds), Harvard University Press, Cambridge: pp. 1213-1244. Melling, H. (1999). Observations by moored instruments in Northern Baffin Bay
1997-1998. Unpub. Rep., Institute of Ocean Sciences, Sydney, B.C.: 37 p.
Michaud, J. 2006. BAYSIS 2006, CCGS Pierre Radisson 12-24 September 2006. Internal report, Laval University, Québec (Qc) : 8 p.
Michaud, L., P. Massot, S. Blondeau, M. Robitaille and M.E. Rail. 2006. ArcticNet 2006 Cruise Report Leg 2 Mooring operations. Internal report, Laval University, Québec (Qc): 4 p.
Rail, M.E. 2006a. Physical Team Sampling Report ArcticNet 0602, from August 21st
to September 28th onboard the CCGS Amundsen. Internal report, INRS-ETE, Québec (Qc): 4 p.
Rail, M.E. 2006b. Physical Team Sampling Report ArcticNet 0603, from September 28th to November 9th onboard the CCGS Amundsen. Internal report, INRS-ETE, Québec (Qc): 3 p.
Rail, M.E., D. Boisvert, C. Bélanger and Y. Gratton. 2010. ArcticNet 2005-2006 mooring data - quality control report. Internal report (Unpublished), INRS-ETE, Québec (Qc): v + 26 p.
Simard, A., M.E. Rail, and Y. Gratton. 2008. Distribution of temperature and salinity in the southern Beaufort Sea during the CASES program. Internal Report, draft version, INRS-ETE, Québec (Qc): ix + 132 p.
Simard, A., M.E. Rail, and Y. Gratton. 2010. Distribution of temperature and salinity in the Canadian Arctic Archipelago during the 2005 ARCTICNET sampling expedition (from August 5th to October 27th 2005). Report No R1126, INRS-ETE, Québec (Qc): vi + 79 p.
Stewart, D.B., and Lockhart, W.L. 2005. An overview of the Hudson Bay marine ecosystem. Can. Tech. Rep. Fish. Aquat. Sci. 2586: vi + 487 p.
Compagny Instrument Type
CTD SeaBird SBE-9plus 1
Temperature SeaBird SBE-03 1 -5°C à +35°C 0.001C 0.0002C
Conductivity SeaBird SBE-4C 1 0-7 S/m
(0-70mmho/cm) 0.0003 S/m (0.003mmho/cm) 0.00004 S/m (0.0004 mmho/cm) Pressure Paroscientific 410K-105 up to 10 500m (15 000psia)2 0.015% of full
scale 0.001% of full scale Dissolved oxygen SeaBird SBE-43 3 120% of surface
saturation4 2% of saturation unknown
pH SeaBird SBE-18-I 5 0-14 pH units 0,1 pH unit unknown
Nitrates concentration Satlantic MBARI-ISUS 5T 6 0.5 to 2000 M 2 M 0.5 M
Light intensity (PAR) Biospherical QCP2300 1.4×10
-5 to 0.5
μE/(cm2·sec)
sPAR Biospherical QCP2200 1.4×10⁻⁵ to 0.5 μE/(cm2·sec)
Fluorescence Seapoint Chlorophyll-fluorometer 0.02-150 g/l unknown 30
Transmissiometer Wetlabs C-Star 0-5 V unknown 1.25 mV
Altimeter Benthos PSA-916 7 0 - 100 m unknown 0.01 m
Notes: 1 Maximum depth of 6800m 2 Depending on the configuration
7 Maximum depth of 6,000m
Attached to the Rosette
3 Maximum depth of 7,000m
4 In all natural waters, fresh and marine 5 Maximum depth of 1,200m
6 Maximum depth of 1,000m
TABLE 2. Summary of the Rosette sampling, ArcticNet scientific 2006 expedition
Start End 0602 1 August 22 September 28 115 72 6 0603 2 September 28 November 9 138 105 11 Number of sections Date Expedition number Number of CTD casts Number of stations Leg number
28 412 22 601 123 129 33 411 21 606 127 130 34 410 20 615 128 131 38 409 19 614 129 117 56 433 49 613 130 118 53 432 48 612 131 119 50 431 47 610 132 120 49 430 46 617 133 121 48 429 45 624 137 122 47 428 44 623 136 123 46 427 43 622 135 124 45 426 42 621 134 125 44 425 39 620 138 126 39 424 38 101 79 423 37 102 74 422 36 103 73 421 34 104 72 407 70 105 71 405 71 106 70 404 72 108 68 403 73 109 67 74 111 66 75 112 65 76 113 64 77 114 63 320 81 115 59 319 80 116 57 318 79 Belcher6 80 317 78 Belcher5 81 321 82 Belcher2 82 322 83 Belcher3 83 323 85 315 115 324 86 114 325 87 113 326 88 313 112 332 94 312 111 331 93 311 110 330 92 310.5 109 329 91 310 107 335 98 309.5 105 336 99 309 104 337 100 308.5 103 338 101 308 101 339 103 307.5 100 340 104 307 95 341 105 306 94 342 106 ResoluteBay 93 343 107 305 92 344 108 304 91 345 109 303 89 346 110 302 88 347 111 301 86 348 112 300 84 349 113 Anaktalak fjord Foxe Basin fjord Saglek fjord NOW S2 Beaufort S700 NOW S3 Northwest Passage Bellot Strait Belcher glacier Gulf of Boothia Northwest Passage 314 Igloolik Island NOW S1
Mooring Water depth North Latitude West Longitude Instr. Serial No Instr. Depth (m)
Date of first reliable data
Date of last reliable data Sampling frequency (min) Water Temp. (°C) Cond. (m S/cm) Pressure (dbar) Current Speed (cm/s) Current Direction (true) Turbidity (NTU) Dissolved Oxygen (μM)
Quality Control Comments
ALEC CT 688 39 2005-09-06 21:00 2006-10-07 19:00 10 X X WARNNG: this line as tilted WH-ADCP 333 82 2005-09-06 20:52 2006-10-07 17:50 60 X X X
RCM 11 289 210 2005-09-06 20:59 2006-10-07 18:27 30 X X X X X X WARNNG: this line as tilted; some missing data points; offset correction on salinity data SBE37 1697 38 2005-09-09 05:00 2006-10-02 21:10 10 X X X suspicious salinity data point on February 10th, 2006 WH-ADCP 2645 90 2005-09-09 04:54 2006-07-11 09:14 20 X X X RCM 11 285 163 2005-09-09 05:01 2006-10-02 20:58 30 X half of them X X X X b.c. b.c. b.d. b.c.
X some missing data points; many missing salinity data point; turbidity data are negative SBE26 372 179 2005-09-09 05:07 2006-10-02 20:37 30 X
SBE37 3463
WH-ADCP 2646 73 2005-09-10 04:52 2006-07-18 02:12 20 X X X
RCM 4 8677 91 ? ? ? b.d. b.d. b.d. b.c.
RCM 11 290 194 2005-09-10 05:00 2006-10-02 14:21 30 X X X X X X X some missing data points; offset correction on salinity data RCM 11 287 370 2005-09-10 04:59 2006-08-25 11:53 30 X X X X X X X some missing data points; offset correction on salinity data RCM 11 280 32 2005-09-12 23:00 2006-10-01 17:50 30 X X X X X X X some missing oxygen data points RCM 11 266 106 2005-09-12 23:00 2006-10-01 17:55 30 X X X X X X X some missing data points
RCM 11 273 203 2005-09-12 23:00 2006-10-01 17:52 30 X X X X X X X some missing data points; offset correction on salinity data RCM 7 10301 399 2005-09-12 23:30 2006-08-14 16:30 60 X X X X offset correction on salinity data
RCM 4 8859
RCM 4 8214 195 2005-08-17 07:00 2006-09-15 19:00 180 X X b.c. 3 hours sampling interval
SBE26 371 200 2005-08-17 05:49 2006-05-29 08:49 30 X X weird pressure data after May 29th, 2006 RCM 7 12800
LR-ADCP 3883
RCM 4 8572 104 2005-08-18 01:30 2006-09-08 02:30 60 X X X
RCM 4 8672 211 ? ? ? b.d. b.d. b.c.
LR-ADCP 3815 427 2005-08-17 23:17 2006-09-08 00:47 60 X X X
SBE37 1695 96 / 3 2005-08-18 23:00 2006-08-29 19:15 15 X X X dragged by sea ice on January 6th, 2006 RCM 7 10298 RCM 11 0284 BA04-05 475 75º 15.21 074º 58.65 ALEC CT 684 ALEC CT 592 WH-ADCP 3045 80 2005-10-13 03:05 2006-09-16 20:25 20 X X X AN02-05 80 58º 46.92 091º 31.39 SBE-37 2424
RCM 7 12796 35 2005-10-01 19:00 2006-09-13 13:00 60 X X b.c. temperature reachs its detection limit few time
RCM 4 8850 75 ? ? ? b.d. b.d. b.d. b.c. WH-ADCP 23 96 2005-10-01 17:54 2006-07-22 22:54 20 X X X 59º 58.67 444 CA18-05 70º 39.94 122º 59.30 BA01-05 76º 19.62 071º 11.90 In progress CORRUPTED FILE In progress AN03-05 55º 24.47 077º 55.79 BA02-05 76º 16.06 074º 34.50 AN01-05 540 649 127º 32.18 CA08-05 71º 00.41 126º 04.46 201 397 130 CA04-05 307 71º 04.81 133º 37.75 CA05-05 71º 16.84 077º 24.06 LOST 358 107 LOST 091º 56.62 NO DATA RECORDED NO DATA RECORDED NO DATA RECORDED LOST LOST Never recovered Never recovered BA03-05 76º 23.03
Salinity PSS (1978) 3
Density, (S,T,P) kg/m3 2
Specific volume anomaly 10-8 m3/kg 0
N2: Brunt-Väisälä frequency 1/sec2 2
Density; (S,T,O) kg/m3 3 Potential temperature (θ) C 3 θ; Sθ,O) kg/m 3 3 Freezing temperature C 2
Dissolved oxygen concentration ml/l 4
pH no units 3
Nitrates mmol/m3 2
PAR pressure dbars 2
PAR μEinsteins/m2/sec 3
APPENDIX 1. Higher resolution maps of Arctic areas where Rosette-CTD, SCAMP and
moorings data were collected.
1A. Rosette-CTD sampling sites in Baffin Bay, Northwest Passage, Beaufort Sea, Hudson Bay, Hudson Strait and Labrador Sea (Legs 1 and 2).
1B. SCAMP sampling sites in Baffin Bay, Northwest Passage, Beaufort Sea, Hudson Bay and Labrador fjords (Legs 1 and 2).
1C. Moorings recovered and deployed in Baffin Bay, Beaufort Sea and Hudson Bay (Legs 1 and from NGCC Pierre Radisson).
Baffin Bay (Leg 1)
Northwest Passage (Legs 1 & 2)
Beaufort Sea (Legs 1 & 2)
Hudson Bay (Leg 2)
Hudson Strait (Leg 2)
Labrador Sea (Leg 2)
132 131 117 126 115 101
Baffin Bay (Leg 1)
307
310
334
Northwest Passage (Legs 1 & 2)
414 407 408
405 436
Beaufort Sea (Legs 1 & 2)
338 345 350
Hudson Bay
615 602
624
BA04
Moorings recovered in Baffin Bay.
BA03
BA01
Moorings deployed in Baffin Bay.
CA05
CA04 CA08
CA18
Moorings recovered in Beaufort Sea.
CA08 CA04
CA18
Moorings deployed in Beaufort Sea.
AN02
AN03
Moorings recovered in Hudson Bay.
AN01
AN03
Moorings deployed in Hudson Bay.
APPENDIX 1C. Moorings recovered and deployed in Hudson Bay (from NGCC
APPENDIX 2. Rosette-CTD cast locations, sampling times, water depths and
corresponding station or mooring numbers during 2006 ArcticNet scientific expeditions.
2A. Rosette logbook for Leg 1 (expedition 0602) 2B. Rosette logbook for Leg 2 (expedition 0603)
5 Makkovik-3 2006-08-28 10:17 56° 06.92 057° 02.16 1820 1000 6 Makkovik-4 2006-08-28 22:17 55° 57.11 056° 36.99 2167 1000 7 2006-08-30 10:12 61° 26.36 060° 22.45 1463 1000 8 2006-08-30 22:14 61° 03.09 060° 48.24 1217 1000 9 2006-08-31 10:19 61° 25.40 060° 40.28 619 610 10 OliverS.A 2006-09-04 13:31 72° 15.23 077° 47.19 372 358 11 OliverS.B 2006-09-05 00:51 72° 24.34 078° 45.05 466 450 12 OliverS.C 2006-09-05 02:17 72° 19.53 078° 15.26 267 258 13 OliverS.A 2006-09-05 03:38 72° 15.36 077° 47.21 372 358 14 OliverS.D 2006-09-05 06:58 72° 11.41 077° 27.84 236 211 15 OliverS.E 2006-09-05 08:21 72° 09.62 077° 06.43 127 110 16 BA04 2006-09-07 02:05 75° 16.62 074° 56.89 489 467 17 BA04 2006-09-07 04:08 75° 16.36 074° 58.68 485 467 18 BA04 2006-09-07 06:07 75° 16.36 074° 58.39 484 467 19 BA02 2006-09-08 02:30 76° 15.94 074° 33.95 460 450 20 2006-09-08 15:07 78° 25.16 073° 51.02 512 502 21 132 2006-09-09 00:39 78° 59.73 072° 19.99 248 243 22 132 2006-09-09 07:09 79° 01.30 072° 01.88 193 181 23 132 2006-09-09 09:35 78° 59.80 072° 20.25 247 243 24 132 2006-09-09 12:40 78° 59.73 072° 20.55 241 236 25 132 2006-09-09 14:30 79° 00.14 072° 17.24 250 242 26 127 2006-09-10 03:14 78° 17.75 074° 35.69 604 278 27 127 2006-09-10 03:45 78° 17.10 074° 38.30 602 598 28 127 2006-09-10 17:28 78° 20.22 074° 11.42 512 502 29 127 2006-09-10 19:28 78° 19.06 074° 17.52 532 522 31 127 2006-09-11 00:55 78° 09.87 074° 44.27 600 602 32 129 2006-09-11 05:17 78° 19.75 074° 00.87 577 571 33 129 2006-09-11 07:01 78° 19.74 073° 59.70 566 555 34 130 2006-09-11 08:59 78° 19.45 073° 37.51 705 675 35 131 2006-09-11 11:17 78° 18.89 073° 07.80 245 239 36 131 2006-09-11 13:49 78° 19.36 073° 11.18 333 328 37 131 2006-09-12 03:40 78° 19.12 073° 11.01 257 260 38 131 2006-09-12 05:14 78° 19.09 073° 11.19 306 302 39 126 2006-09-12 17:53 77° 20.71 073° 24.88 334 325 40 126 2006-09-12 19:29 77° 20.81 073° 25.35 327 320 41 126 2006-09-13 02:14 77° 21.80 073° 25.16 317 312 42 126 2006-09-13 04:07 77° 21.54 073° 25.51 321 313 43 126 2006-09-13 05:57 77° 20.64 073° 25.66 323 319 44 125 2006-09-13 10:06 77° 20.52 073° 55.25 491 484 45 124 2006-09-13 11:02 77° 20.61 074° 18.11 705 696 46 123 2006-09-13 12:55 77° 20.55 074° 38.44 697 692 47 122 2006-09-13 17:05 77° 20.07 075° 00.72 653 645 48 121 2006-09-13 19:06 77° 20.25 075° 22.40 584 575 49 120 2006-09-13 20:23 77° 19.90 075° 41.19 563 560 50 119 2006-09-13 23:06 77° 20.17 076° 04.26 526 520
Cast number Station or mooring Start date UTC Start time UTC Latitude (North) Longitude (West) Cast depth (m) Sea bottom depth (m) 51 118 2006-09-14 05:11 77° 21.87 076° 32.69 277 261 52 118 2006-09-14 06:41 77° 22.18 076° 35.73 233 229 53 118 2006-09-14 08:30 77° 22.26 076° 40.60 255 250 55 117 2006-09-14 18:22 77° 20.40 076° 56.94 417 390 56 117 2006-09-14 20:16 77° 21.82 076° 58.31 184 173 57 116 2006-09-15 10:55 76° 20.03 070° 38.49 174 160 58 115 2006-09-15 14:13 76° 19.39 071° 10.13 660 650 59 115 2006-09-16 01:09 76° 19.92 071° 12.09 673 673 60 115 2006-09-16 08:05 76° 19.93 071° 11.98 672 660 61 115 2006-09-16 11:03 76° 20.61 071° 12.12 654 649 62 115 2006-09-16 13:06 76° 20.82 071° 12.50 653 651 63 114 2006-09-17 04:01 76° 19.37 071° 46.86 613 605 64 113 2006-09-17 05:11 76° 19.01 072° 13.29 553 544 65 112 2006-09-17 06:54 76° 18.81 072° 42.36 561 557 66 111 2006-09-17 08:50 76° 18.43 073° 12.77 596 586 67 109 2006-09-17 14:19 76° 15.28 074° 10.39 446 440 68 108 2006-09-17 16:03 76° 15.62 074° 35.41 446 440 69 108 2006-09-17 18:36 76° 16.13 074° 36.65 448 X 70 106 2006-09-17 22:34 76° 18.33 075° 20.78 383 376 71 105 2006-09-17 23:33 76° 19.47 075° 46.92 346 339 72 104 2006-09-18 01:12 76° 20.42 076° 10.82 197 188 73 103 2006-09-18 02:09 76° 21.66 076° 33.90 153 143 74 102 2006-09-18 03:21 76° 22.65 076° 59.00 243 236 75 101 2006-09-18 06:36 76° 23.47 077° 18.37 324 320 76 101 2006-09-18 08:10 76° 22.98 077° 23.76 351 344 77 101 2006-09-18 15:51 76° 24.63 077° 16.67 311 304 78 101 2006-09-18 19:38 76° 24.37 077° 17.46 309 305 79 101 2006-09-18 21:35 76° 22.94 077° 25.63 393 385 80 Belcher-6 2006-09-19 20:07 75° 40.22 081° 15.74 180 169 81 Belcher-5 2006-09-19 21:09 75° 42.35 081° 00.62 215 209 82 Belcher-2 2006-09-19 22:46 75° 42.70 080° 48.51 627 625 83 Belcher - 3 2006-09-20 00:09 75° 39.93 080° 33.99 630 626 84 300 2006-09-20 08:30 74° 22.33 079° 58.25 690 688 85 301 2006-09-20 19:24 74° 07.48 083° 19.43 676 674 86 301 2006-09-20 23:03 74° 07.44 083° 20.69 680 672 87 301 2006-09-21 01:21 74° 08.55 083° 22.83 678 675 88 302 2006-09-21 07:57 74° 09.22 086° 16.29 519 516 89 303 2006-09-21 13:24 74° 14.19 089° 40.65 229 219 90 303 2006-09-21 17:32 74° 14.12 089° 39.78 229 223 91 304 2006-09-22 00:28 74° 21.75 093° 18.97 173 165 92 305 2006-09-22 03:24 74° 19.75 094° 59.77 170 162 93 Resolute Bay 2006-09-22 10:17 74° 40.92 095° 11.43 152 140 94 306 2006-09-23 05:47 74° 20.96 097° 35.01 132 125 95 307 2006-09-23 12:07 74° 24.15 100° 35.05 167 158 96 307 2006-09-23 14:22 74° 24.25 100° 35.39 168 159 97 307 2006-09-23 22:21 74° 26.55 100° 27.52 154 144 98 307 2006-09-23 23:39 74° 23.84 100° 35.20 172 166 99 307 2006-09-24 00:52 74° 23.97 100° 34.46 168 163 100 307.5 2006-09-24 10:37 73° 53.97 101° 58.86 130 122
105 309.5 2006-09-25 04:14 71° 59.94 102° 59.88 247 237 106 310 2006-09-25 09:44 71° 29.66 102° 15.36 215 205 107 310 2006-09-25 11:28 71° 29.47 102° 13.43 210 202 108 310 2006-09-25 22:46 71° 29.92 102° 14.48 213 201 109 310.5 2006-09-26 06:04 71° 09.94 099° 45.13 139 131 110 311 2006-09-26 12:02 70° 16.38 098° 27.51 149 144 111 312 2006-09-26 18:34 69° 09.52 100° 42.13 57 53 112 313 2006-09-27 01:22 68° 40.81 103° 59.26 106 91 113 314 2006-09-27 06:45 68° 59.88 106° 35.57 110 103 114 315 2006-09-27 14:29 68° 32.85 109° 23.03 170 162 115 316 2006-09-28 02:41 68° 06.87 111° 09.24 294 281
Cast number Station or mooring Start date UTC Start time UTC Latitude (North) Longitude (West) Cast depth (m) Sea bottom depth (m) 1 400 2006-09-29 09:28 69° 05.49 114° 48.32 160 154 2 401 2006-09-29 13:02 69° 14.14 116° 36.20 177 168 3 402 2006-09-29 16:35 69° 35.74 118° 08.03 410 411 4 403 2006-09-30 00:53 70° 06.04 120° 05.94 417 406 5 403 2006-09-30 03:35 70° 06.05 120° 05.76 416 392 6 403 2006-09-30 06:00 70° 06.36 120° 05.42 408 407 7 405 2006-10-01 08:47 70° 39.07 122° 56.67 583 575 8 405 2006-10-01 12:10 70° 39.22 122° 59.24 610 592 9 405 2006-10-01 16:44 70° 39.49 123° 00.15 594 587 10 405 2006-10-01 20:44 70° 39.06 122° 56.90 579 570 11 405 2006-10-02 01:43 70° 38.56 122° 58.08 595 592 12 405 2006-10-02 04:37 70° 39.15 122° 58.33 598 584 13 407 2006-10-02 12:31 71° 01.24 126° 05.20 390 380 14 408 2006-10-02 20:20 71° 15.91 127° 31.00 187 186 15 408 2006-10-02 22:26 71° 15.92 127° 31.03 187 187 16 408 2006-10-03 01:09 71° 15.77 127° 29.93 193 187 17 408 2006-10-03 02:46 71° 15.81 127° 29.82 197 194 18 408 2006-10-03 04:43 71° 15.30 127° 29.20 194 186 19 409 2006-10-04 13:08 71° 52.14 125° 52.14 108 109 20 410 2006-10-05 10:15 71° 41.97 126° 29.37 400 400 21 411 2006-10-05 11:57 71° 37.76 126° 41.82 430 420 22 412 2006-10-05 13:31 71° 33.96 126° 54.44 410 400 23 413 2006-10-05 15:06 71° 29.60 127° 08.75 373 360 24 414 2006-10-05 16:50 71° 25.29 127° 22.04 305 299 25 415 2006-10-06 01:14 71° 21.72 127° 33.28 238 235 26 416 2006-10-06 02:03 71° 17.52 127° 46.08 158 149 27 417 2006-10-06 03:12 71° 13.30 127° 58.94 84 74 28 418 2006-10-06 03:58 71° 09.65 128° 09.85 65 58 29 419 2006-10-06 04:46 71° 06.39 128° 20.26 56 47 30 420 2006-10-06 05:31 71° 03.17 128° 31.03 40 33 31 420 2006-10-06 07:48 71° 03.19 128° 30.86 42 33 32 421 2006-10-06 18:58 71° 28.18 133° 56.17 1196 990 33 421 2006-10-06 20:57 71° 28.75 133° 56.14 1128 990 34 421 2006-10-06 22:59 71° 28.73 133° 56.91 1120 991 35 421 2006-10-07 04:11 71° 28.05 133° 54.47 1150 1000 36 422 2006-10-07 08:36 71° 22.20 133° 52.95 1083 1000 37 423 2006-10-07 10:51 71° 16.35 133° 51.14 790 790 38 424 2006-10-07 12:28 71° 10.24 133° 49.84 560 560 39 425 2006-10-07 14:17 71° 04.12 133° 47.18 286 272 40 425 2006-10-07 15:16 71° 03.75 133° 49.87 288 274 41 435 2006-10-07 18:30 71° 04.60 133° 38.86 285 275 42 426 2006-10-07 21:00 70° 59.22 133° 45.00 113 98 43 427 2006-10-07 22:24 70° 52.76 133° 43.79 70 69 44 428 2006-10-07 23:34 70° 47.42 133° 42.24 67 64 45 429 2006-10-08 01:20 70° 41.56 133° 41.35 62 58 46 430 2006-10-08 02:49 70° 35.77 133° 39.33 71 61 47 431 2006-10-08 04:44 70° 29.71 133° 37.89 66 58 48 432 2006-10-08 06:10 70° 24.37 133° 36.42 62 53 49 433 2006-10-08 08:05 70° 17.09 133° 36.00 66 58 50 436 2006-10-09 10:54 70° 20.82 126° 20.96 247 240
55 436 2006-10-10 00:17 70° 20.04 126° 26.77 253 246 56 2006-10-11 22:21 70° 39.04 127° 12.19 251 242 57 435 2006-10-12 13:36 71° 04.55 133° 34.94 310 299 58 435 2006-10-12 15:34 71° 50.00 133° 33.42 333 313 59 435 2006-10-12 17:35 71° 04.28 133° 34.10 290 279 60 435 2006-10-13 01:32 71° 05.03 133° 34.58 333 318 61 2006-10-13 21:41 70° 22.73 137° 36.39 432 423 62 437? 2006-10-15 20:49 70° 37.67 136° 14.83 548 546 63 2006-10-16 17:43 70° 36.89 136° 24.62 693 680 64 434 2006-10-17 00:22 70° 10.60 133° 33.40 46 39 65 434 2006-10-17 02:37 70° 10.86 133° 34.64 43 35 66 407 2006-10-17 22:15 71° 00.53 126° 04.32 391 384 67 407 2006-10-18 01:22 71° 00.67 126° 02.88 397 392 68 407 2006-10-18 03:11 71° 01.03 125° 57.12 395 389 69 407 2006-10-18 05:03 71° 00.45 126° 03.73 390 381 70 407 2006-10-18 07:30 71° 01.21 126° 00.50 398 388 71 405 2006-10-18 17:50 70° 39.65 122° 59.79 591 583 72 404 2006-10-18 20:54 70° 20.79 121° 36.05 464 458 73 403 2006-10-19 00:29 70° 05.86 120° 06.67 414 405 74 2006-10-20 07:26 68° 05.02 111° 57.51 226 218 75 2006-10-21 12:39 69° 40.66 099° 35.95 75 64 76 2006-10-21 18:34 69° 51.48 099° 16.74 119 110 77 2006-10-22 02:20 71° 07.29 097° 30.09 99 90 78 317 2006-10-22 16:49 72° 05.14 093° 54.25 112 103 79 318 2006-10-22 18:12 71° 59.21 093° 48.95 83 72 80 319 2006-10-22 19:09 71° 52.96 093° 42.68 100 91 81 320 2006-10-22 20:16 71° 48.23 093° 37.05 91 82 82 321 2006-10-23 04:47 70° 20.94 091° 33.99 96 87 83 322 2006-10-23 05:58 70° 24.06 091° 06.07 222 213 84 322 2006-10-23 08:40 70° 24.06 091° 05.95 222 212 85 323 2006-10-23 12:15 70° 26.95 090° 38.54 134 122 86 324 2006-10-23 13:22 70° 30.10 090° 08.64 134 122 87 325 2006-10-23 14:52 70° 33.17 089° 40.36 164 154 88 326 2006-10-23 16:06 70° 36.11 089° 13.53 86 74 89 327 2006-10-24 03:52 69° 57.12 085° 45.63 236 225 90 328 2006-10-24 05:12 69° 53.03 085° 44.25 114 108 91 329 2006-10-24 21:24 69° 22.02 080° 23.40 36 29 92 330 2006-10-24 22:06 69° 19.12 080° 33.00 58 50 93 331 2006-10-24 23:20 69° 15.11 080° 45.83 71 64 94 332 2006-10-25 00:14 69° 10.98 080° 59.88 77 72 95 333 2006-10-25 02:41 68° 45.94 081° 00.87 34 26 96 334 2006-10-25 09:09 67° 52.77 080° 47.99 82 75 97 334 2006-10-25 11:12 67° 53.02 080° 47.47 82 77 98 335 2006-10-25 20:06 66° 32.92 082° 08.11 99 92 99 336 2006-10-25 21:31 66° 25.23 081° 50.63 141 130 100 337 2006-10-25 23:06 66° 16.88 081° 36.89 70 61
Cast number Station or mooring Start date UTC Start time UTC Latitude (North) Longitude (West) Cast depth (m) Sea bottom depth (m) 101 338 2006-10-26 00:29 66° 09.98 081° 19.77 135 124 102 338 2006-10-26 02:30 66° 09.35 081° 19.81 134 125 103 339 2006-10-26 05:26 66° 00.97 081° 04.99 147 140 104 340 2006-10-26 06:36 65° 52.98 080° 46.93 133 126 105 341 2006-10-26 07:52 65° 47.08 080° 34.93 136 130 106 342 2006-10-26 09:09 65° 37.07 080° 16.81 113 107 107 343 2006-10-26 10:19 65° 31.01 080° 03.49 95 85 108 344 2006-10-26 11:53 65° 21.83 079° 47.52 93 88 109 345 2006-10-26 13:05 65° 14.98 079° 32.67 113 106 110 346 2006-10-26 14:19 65° 06.04 079° 18.66 90 80 111 347 2006-10-26 17:50 64° 59.13 079° 05.98 88 76 112 348 2006-10-26 19:07 64° 50.11 078° 51.08 133 120 113 349 2006-10-26 20:35 64° 41.07 078° 35.10 135 127 114 350 2006-10-27 01:00 64° 29.94 080° 30.08 385 378 115 350 2006-10-27 03:23 64° 29.66 080° 31.22 384 379 116 351 2006-10-27 18:08 63° 32.11 075° 50.09 353 343 117 356 2006-10-28 21:30 60° 44.53 064° 41.79 283 280 118 355 2006-10-28 23:02 60° 50.98 064° 42.73 410 417 119 354 2006-10-29 00:45 61° 00.10 064° 44.65 495 491 120 353 2006-10-29 02:19 61° 09.05 064° 47.40 397 401 121 352 2006-10-29 04:13 61° 15.98 064° 48.67 294 273 122 2006-10-29 15:46 63° 03.10 067° 22.78 449 433 123 601 2006-11-01 13:47 59° 02.90 063° 37.33 162 153 124 602 2006-11-01 16:28 59° 03.42 063° 51.72 155 147 125 605 2006-11-01 20:00 58° 58.43 063° 53.23 49 43 126 604 2006-11-01 23:10 59° 00.01 063° 53.71 67 60 127 606 2006-11-02 03:57 59° 05.52 063° 26.15 213 195 128 615 2006-11-02 18:57 58° 18.67 063° 33.71 132 128 129 614 2006-11-02 23:42 58° 23.57 063° 23.92 171 166 130 613 2006-11-03 05:17 58°29.07 063° 13.32 238 234 131 612 2006-11-03 07:47 58° 28.31 062° 58.05 80 80 132 610 2006-11-03 08:34 58° 31.99 062° 50.39 113 103 133 617 2006-11-03 10:31 58° 30.04 062° 41.32 130 129 134 621 2006-11-04 08:40 56° 24.88 061° 31.56 114 108 135 622 2006-11-04 09:42 56° 25.00 061° 43.89 79 78 136 623 2006-11-04 10:34 56° 26.83 061° 56.31 111 109 137 624 2006-11-04 11:26 56° 25.32 062° 04.17 70 66 138 620 2006-11-04 22:26 56° 23.85 061° 13.00 95 86
APPENDIX 3. SCAMP cast locations, sampling times, water depths and corresponding
station numbers during 2006 ArcticNet scientific expedition
3A. SCAMP logbook for Leg 1 (expedition 0602) 3B. SCAMP logbook for Leg 2 (expedition 0603)
LOCALISATION Kane Basin Baffin Bay Baffin Bay Baffin Bay Lat. 78º 59.837' 78º 19.541' 77º 20.717' 77º 22.432' Long. -072º 18.714' -073º 14.802' -073º 24.880' -076º 57.619' DEPARTURE date (TU) 2006-09-09 2006-09-11 2006-09-12 2006-09-14 time (TU) 13:39 18:30 17:00 19:45 RETURN time (TU) 15:39 21:10 19:00 21:26 CONDITIONS wind direction 235/240 20 130 330 wind speed 14 30 15 12 Pa 996.85/996.78 1003 1000.48 1019.8 Rel. Hum. 87% 74% 61% 82% air temp. (°C) -0.0/-0.3 -1.7 1.4 -2.6 water temp. (°C) (SST) -0.17/-0.15 1.0 2.87 -1.05 sea state 2 5-6 5-6 4 ice (1/10) 2 1 iceberg 1 clouds (1/8) 6 6 3 6 CTD CAST # 25 36 39 55 Water depth (m) 250 333 334 417 SCAMP 1 143245 202509 171111 203450 SCAMP 2 145827 204001 173943 205146 SCAMP 3 151519 175740 210658 SCAMP 4 SCAMP 5 MISCELLANEOUS Profil depth (m) 50 50 50 50-60 Max # scans 50000 50000 50000 80000 Chrono (min) 8.5 8.5 8.5 9 Start of GPS UTC 13h39 18h32 17h01 19h45 GPS file name 09092006gps 11092006gps 12092006gps 14092006gps MINILOGS
File name 09092006Top.txt none 12092006Top.xt 14092006Top.txt 09092006Middle.txt 12092006Bottom.txt 14092006Middle.txt
09092006Bottom.txt 14092006Bottom.txt
Person in charge: Caroline Sévigny
COMMENTS
Problem with the connector.
Ongoing problems with data salvaging. Two important shearing «areas» are illustrated in the first profile, they are less evident in the second profile. Heavy seas.
Installation of the USB connection in the SCAMP. Impossible to download the data from the «middle» minilog.
RETURN time (TU) 15:15 15:26 19:59 20:44 CONDITIONS wind direction 135 275 160 30 wind speed 6 11 8 18 Pa 1006.28 1015 1012.83 1014.66 Rel. Hum. 83% 91% 99% 99% air temp. (°C) 2.5 0.1 -3.3 -2,4 water temp. (°C) (SST) 2.54 0.16 -0.59 -0,55 sea state 3 3 1 3
ice (1/10) iceberg iceberg 2 3
clouds (1/8) 1 1 0 fog, 7 CTD CAST # 62 77 96 108 Water depth (m) 654 311 168 216 SCAMP 1 134341 134341 181847 194516 SCAMP 2 140206 140206 183312 200012 SCAMP 3 141702 141702 184937 201712 SCAMP 4 143053 143053 190336 SCAMP 5 144528 144528 192324 MISCELLANEOUS Profil depth (m) 50-60 50-60 80-90 80-90 Max # scans 80000 80000 80000 80000 Chrono (min) 9 10 9-10 8 Start of GPS UTC 13h03 17h25 19h07 GPS file name 16092006gps 18092006gps 23092006gps 25092006gps MINILOGS
File name 16092006Top.txt 18092006Top.txt none none 16092006Middle.txt 18092006Middle.txt
16092006Bottom.txt 18092006Bottom.txt
Person in charge: Caroline Sévigny Potential problems with one of the temperature sensors. Had to add a rubber ring.
Stong currents. Drill overheating while recovering. Speed still too fast.
Will have to change all the batteries before the next sampling.
LOCALISATION Amundsen Gulf Amundsen Gulf Amundsen Gulf Franklin Bay Lat. 70º 39.08' 71º 15.91' 71º 25.27' 70º 19.76' Long. -122º 56.86' -127º 31.04' -127º 22.02' -126º 22.46' DEPARTURE date (TU) 2006-10-01 2006-10-03 2006-10-05 2006-10-09 time (TU) 20:38 00:12 16:34 19:25 RETURN time (TU) 22:15 01:58 18:20 21:30 CONDITIONS wind direction 160 150 53 70 wind speed 8 10 21 8 Pa 1011.2 1009.7 1011.3 1033.5 Rel. Hum. 86% 93% 83% 67% air temp. (°C) 0.0 0.8 -2.5 -5.0 water temp. (°C) (SST) 3.9 2.1 1.9 1.3 sea state 3 4 6 2 ice (1/10) --- --- --- ---clouds (1/8) 4 6 6 5 CTD CAST # 10 16 24 53 Water depth (m) 579 193 305 254 SCAMP 1 205319* 232156 165743 022441 SCAMP 2 212222 233927 171456 023826 SCAMP 3 213809 235554 172950 025213 SCAMP 4 215430 001510 174620 030932 SCAMP 5 003205 032417 MISCELLANEOUS Profil depth (m) 85-88 88 30-40 65-70 Max # scans 80000 80000 80000 80000 Chrono (min) 8 8 7 8 Start of GPS UTC 19:34 00:12 15:34 19:26 GPS file name 01102006gps 02102006gps 05102006gps 09102006gps MINILOGS
File name Bin01102006top.003 Bin02102006top.004 Bin05102006top.004 Bin09102006top.005 Bin01102006middle.000 Bin02102006middle.001 ---
---B12-01102006bottom.003 B12-02102006bottom.004 B12-05102006bottom.004 B12-09102006bottom.005
Person in charge: Dany Dumont
COMMENTS Rapid descent speed (>0.2m/s) following Caroline's last
configuration or «tune up». *The first cast (205319) is incomplete due to a deployment delay.
Descent speed of >0.2m/s. Descent speed of ~ 0.1m/s. The blue carrier box got stock in the zodiac during the recovering. The box has a crack on his cover. Had to change the SCAMP's batteries after sampling. Unable to download the data from the middle minolog.
Replacement of a blue plastic link/chain that broke off due to cold weather. The hour and date registered in the SCAMP files
(09OCT2006_??????.txt) are not valid date. Descente spedd of ~0.15m/s. Unable to download data from the middle minilog.
RETURN time (TU) 02:57 12:45 03:20 15:24 CONDITIONS wind direction 18 253 308 10 wind speed 7 10 9 9 Pa 1012.9 1021.5 1025 1022.2 Rel. Hum. 81% 92% 87% 86% air temp. (°C) -2.7 1.1 -1.1 -1.3 water temp. (°C) (SST) 1.58 1.94 1.49 0.48 sea state 1 1 3 3 ice (1/10) --- --- --- ---clouds (1/8) 8 8 6 7 CTD CAST # 69 97 102 110 Water depth (m) 390 82 134 84 SCAMP 1 010610 112024 012512 142620 SCAMP 2 012053 113209 013916 143900 SCAMP 3 013519 114414 015453 145125 SCAMP 4 014932 120019 020903 150235 SCAMP 5 020414 121250 022305 MISCELLANEOUS Profil depth (m) 55-60 55-70 50-65 55-75 Max # scans 80000 50000 50000 60000 Chrono (min) 8 7 8 8 Start of GPS UTC 00:53 10:56 01:12 ---GPS file name 18102006gps 25102006gps 26102006gps ---MINILOGS
File name Bin18102006top.005 Bin25102006top.005 Bin26102006top.005 Bin26102006top(2).005
--- --- Bin26102006middle.001
---B12-18102006bottom.005 B12-25102006bottom.005 B12-26102006bottom.005 B12-26102006bottom(2).005
Person in charge: Dany Dumont
Got out before dawn. Nothing to report.
COMMENTS Sampling during the night.
The GPS fell at the bottom of the zodiac and got wet with sea water. It's not working anymore and will have to be rinced thoroughly before the next sampling.
Did not used the GPS. Le coordonates of the station were noted at the end of the last
LOCALISATION Foxe Basin Nachvak Fjord Saglek Fjord Anaktalak Fjord Lat. 64º 29.96' 59º 03.30' 58º 20.60' 56º 25.30' Long. -080º 30.00' -063º 51.40' -063º 30.90' -062º 04.10' DEPARTURE date (TU) 2006-10-27 2006-11-01 2006-11-02 2006-11-04 time (TU) 00:54 18:30 18:40 15:00 RETURN time (TU) 02:30 20:30 20:30 17:00 CONDITIONS
wind direction 124 calm 221 292
wind speed 7 calm 28 9
Pa 1017.2 999.8 997.8 1004.7
Rel. Hum. 84% 83% 64% 72%
air temp. (°C) -1.2 1.6 -0.1 -3.3
water temp. (°C) (SST) 1.03 1.92 1.58
sea state 1 0 4 3
ice (1/10) --- beginning to form ---
---clouds (1/8) 8 6 6 0 CTD CAST # 114 124 129 137 Water depth (m) 350 162 131 70 SCAMP 1 010500 172919 181047 142407 SCAMP 2 011804 174944 183437 145032 SCAMP 3 013102 180726 185723 151102 SCAMP 4 014519 182133 SCAMP 5 020020 184224 MISCELLANEOUS Profil depth (m) 52-72 40-50 24-33 33-50 Max # scans 60000 60000 80000 80000 Chrono (min) 8 8 10 8 Start of GPS UTC --- --- 19:01 14:54
GPS file name --- --- 02112006gpsqo 04112006gpsqo
MINILOGS
File name Bin27102006top.005 --- Bin02112006top.005 Bin04112006top.005
--- --- ---
---B12-27102006bottom.005 --- B12-02112006top.005 B1204112006bottom.005
Person in charge: Dany Dumont
The zodiac is rapidly drifting due to winds. I had to unwind 500m of cable in 10 minutes. The spedd descent slowed significantly at 15-20m, probably due to cable drag. The GPS still cannot receive the satellite signal (maybe there is an internal malfunction?!). The minilogs were not
deployed. The GPS is not receiving the satellite signal. The sea surface is like a mirror and crystal ice is forming.
The GPS was not used (getting repared). The postion of the station was noted between casts 2 and 5: #2:64o30.1N/80o30.1W;
#3:64o30.1N/80o30.2W; #4:64o30.1N/80o30.2W; #5:64o30.1N/80o30.3W. Will
be able to use the GPS for the next sampling. I rinced it toroughly with distilled water.
APPENDIX 4. SCAMP data plots
4A. Example of SCAMP data from Leg 1 (expedition 0602) 4B. Example of SCAMP data from Leg 2 (expedition 0603)
station 115 during leg 0602. The blue line represented the temperature (oC), the green one is fluorescence (volts), the red one is density (kg m-3), the gray is light penetration and
APPENDIX 5. Sections of salinity and potential temperature for ArcticNet expedition
0602 (Leg 1).
The same color scale is used for all sections except 5.6 where fresher water was recorded. For the sections in northern Baffin Bay, Canada is on the left and Greenland is on the
right.
5.1. Section in Oliver Sound
5.2. Section NOW S1 in northern Baffin Bay (same as named location than during NOW program in 1998)
5.3. Section NOW S3 in northern Baffin Bay (same as named location than during NOW program in 1998)
5.4. Section NOW S5 in northern Baffin Bay (same as named location than during NOW program in 1998)
5.5. Section in front of Belcher Glacier in northern Baffin Bay 5.6. Section along Northwest Passage.
APPENDIX 5.1.A. The yellow arrow identifies the location of the section in Oliver
APPENDIX 5.1.B. Salinity and potential temperature along the section in Oliver Sound.
APPENDIX 5.2.A. The yellow arrow identifies the location of the section NOW S1 in
northern Baffin Bay. This section is contoured on the next page. (NOW referring to North Water polynya expedition).
APPENDIX 5.2.B. Salinity and potential temperature along the section NOW S1. The
APPENDIX 5.3.A. The yellow arrow identifies the location of the section NOW S3 in
APPENDIX 5.3.B. Salinity and potential temperature along the section NOW S3. The
APPENDIX 5.4.A. The yellow arrow identifies the location of the section NOW S5 in
APPENDIX 5.4.B. Salinity and potential temperature along the section NOW S5. The
APPENDIX 5.5.A. The yellow arrow identifies the location of the section in front of
APPENDIX 5.5.B. Salinity and potential temperature along the section in front of
APPENDIX 5.6.A. The yellow arrow identifies the location of the section along the
Northwest Passage. This section is contoured on the next page. The boat sailed from East to West, but the section is plot from West (left) to East (right).
APPENDIX 5.6.B. Salinity and potential temperature along the section along the
APPENDIX 6. Contours of salinity and potential temperature for the different sections of
ArcticNet expedition 0603 (Leg 2).
The same color scale is used for all sections except 6.2 where fresher water was recorded. For West to East sections, West is on the left and East is on the right. For South to North
sections, South is on the left and North is on the right.
6.1. Section S400 in Beaufort Sea (same location than in 2003-2004 during CASES program)
6.2. Section S700 in Beaufort Sea (same location than in 2003-2004 during CASES program)
6.3. Section along the Northwest Passage 6.4. Section on the eastern side of Bellot Strait 6.5. Section across the Gulf of Boothia
6.6. Section in front of Igloolik Island 6.7. Section across Foxe Basin
6.8. Section 13 across Hudson Strait (as named in 2005) 6.9. Section in Nachvak fjord along Labrador coast 6.10. Section in Saglek fjord along Labrador coast 6.11. Section in Anaktalak fjord along Labrador coast
APPENDIX 6.1.A. The yellow arrow identifies the location of section S400 in Beaufort
APPENDIX 6.1.B. Salinity and potential temperature along section S400. The southern
APPENDIX 6.2.A. The yellow arrow identifies the location of the section S700 in
APPENDIX 6.2.B. Salinity and potential temperature along S700. The southern sites are
APPENDIX 6.3.A. The yellow arrow identifies the location of the section along the
APPENDIX 6.3.B. Salinity and potential temperature along the section along the
APPENDIX 6.4.A. The yellow arrow identifies the location of the section on the eastern
APPENDIX 6.4.B. Salinity and potential temperature along the section on the eastern
APPENDIX 6.5.A. The yellow arrow identifies the location of the section across the gulf
APPENDIX 6.5.B. Salinity and potential temperature along the section across the gulf of
APPENDIX 6.6.A. The yellow arrow identifies the location of the section in front of
APPENDIX 6.6.B. Salinity and potential temperature along the section in front of
APPENDIX 6.7.A. The yellow arrow identifies the location of the section across Foxe
APPENDIX 6.7.B. Salinity and potential temperature along the section across Foxe
APPENDIX 6.8.A. The yellow arrow identifies the location of the section 13 across
APPENDIX 6.8.B. Salinity and potential temperature along section 13 across Hudson
APPENDIX 6.9.A. The yellow arrow identifies the location of the section in Nachvak
APPENDIX 6.9.B. Salinity and potential temperature along the section in Nachvak fjord.
APPENDIX 6.10.A. The yellow arrow identifies the location of the section in Saglek
APPENDIX 6.10.B. Salinity and potential temperature along the section in Saglek fjord.
APPENDIX 6.10.A. The yellow arrow identifies the location of the section in Anaktalak
APPENDIX 6.10.B. Salinity and potential temperature along the section in Anaktalak