OATAO is an open access repository that collects the work of Toulouse researchers and
makes it freely available over the web where possible.
This is an author-deposited version published in :
http://oatao.univ-toulouse.fr/
Eprints ID : 9010
To link to this article : DOI:10.1061/(ASCE)HY.1943-7900.0000122
URL : http://dx.doi.org/10.1061/(ASCE)HY.1943-7900.0000122
O
pen
A
rchive
T
OULOUSE
A
rchive
O
uverte (
OATAO
)
To cite this version : Belaud, Gilles and Cassan, Ludovic and
Baume, Jean-Pierre Calculation of Contraction Coefficient under
Sluice Gates and Application to Discharge Measurement. (2009)
Journal of Hydraulic Engineering, vol. 135 (n° 12). pp. 1086-1091.
ISSN 0733-9429
Any correspondence concerning this service should be sent to the repository
administrator:
[email protected]
㩷
Calculation of Contraction Coefficient under Sluice Gates
and Application to Discharge Measurement
Gilles Belaud
1; Ludovic Cassan
2; and Jean-Pierre Baume
3Abstract: The contraction coefficient under sluice gates on flat beds is studied for both free flow and submerged conditions based on the
principle of momentum conservation, relying on an analytical determination of the pressure force exerted on the upstream face of the gate together with the energy equation. The contraction coefficient varies with the relative gate opening and the relative submergence, especially at large gate openings. The contraction coefficient may be similar in submerged flow and free flow at small openings but not at large openings, as shown by some experimental results. An application to discharge measurement is also presented.
CE Database subject headings: Gates; Contraction; Coefficients; Hydraulic structures; Potential flow; Submerged flow; Free flow;
Discharge measurement.
Introduction
Vertical sluice gates spanning the entire width, B, of a rectangular channel are among the most common structures in hydraulic en-gineering, and consequently have been much studied in the past ~see Fig. 1 for a definition sketch!. Attention has been mostly given to free flow conditions, and little theoretical work has been done for the submerged flow conditions that may frequently occur in open-channel networks. When gate openings are large, the head loss through the gate is small and the flow is largely sub-merged. Such conditions generally lead to large deviations be-tween models and discharge measurements. One reason is, of course, the large uncertainty in the measurement of the difference between upstream and downstream water levels, but a variable contraction coefficient, Cc, may also play a role. Indeed, no con-traction occurs when a submerged gate hardly penetrate the water stream. In this work, the variation of Ccunder vertical sluice gates on horizontal beds is reexamined for free and submerged conditions.
Potential flow theory led to the analytic determination of Ccin free flow ~von Mises 1917!, based on conformal mapping be-tween the physical plane and the complex potential plane ~see review by Montes 1997!. Using numerical methods, the effect of gate opening, W, on Ccwas demonstrated ~see e.g., Binnie 1952; Marchi 1953; Larock 1969; Fangmeier and Strelkoff 1968; among
others!. More recently, Montes ~1997! and Vanden-Broeck ~1997! presented numerical solutions of this potential flow with an im-proved determination of the free surface, again in free flow.
Much less has been done for the submerged conditions. In fact, due to the lack of theoretical background, a common assumption is that Ccis the same in submerged flow as in free flow. Rajarat-nam and Subramanya ~1967! performed a detailed analysis of the flow structure under submerged sluice gates, up to W = h0/10,
where h0 denotes the upstream depth. They pointed out the
ex-perimental difficulty of determining the contracted section in sub-merged flow but proposed a clear definition of the depth of the contracted stream based on the mass conservation. More recently and for radial gates, Tel ~2000! noted that the vena contracta thickens at the beginning of submergence due to the pressure exerted on the jet. Using these observations and a review of ex-isting works on submerged jets, Clemmens et al. ~2003! intro-duced an energy correction to account for change in Ccat initial submergence.
A theoretical framework based on energy and momentum con-servation, as well as on a recently developed description of pres-sure field on the upstream face of the gate, is proposed. The method leads to an analytic determination of Cc, both in free flows and submerged flows, and then to a discharge coefficient, Cd.
Energy and Momentum Balance
Energy Balance
Assuming no energy loss in the upstream pool, the water level on the upstream side of the gate H0is equal to the total head, E0, in
section A ~Fig. 1!
H0= E0= h0+ Q2/s2gB2h02d s1d
in which Q = discharge; and g = acceleration due to gravity. Then, the energy conservation equation is written between section A and the contracted section ~C!. As done by Clemmens et al. ~2003!, a correction factor k $ 1 may be introduced to account for kinetic energy correction and head loss
1Assistant Professor, UMR G-EAU, SupAgro 1, place Pierre Viala,
34060 Montpellier Cedex 1, France ~corresponding author!. E-mail: [email protected]
2
Researcher, UMR G-EAU, SupAgro 1, place Pierre Viala, 34060 Montpellier Cedex 1, France ~corresponding author!. E-mail: ludovic. [email protected]
3Research Engineer, UMR G-EAU, Cemagref, 361 rue Jean-François
Breton, 34196 Montpellier Cedex 5, France. E-mail: jean-pierre.baume@ cemagref.fr
E0= h1+ k
Q2
2gB2h32 s2d
where h1= depth at C and h35thickness of the vena contracta.
Clemmens et al. ~2003! give experimental values of k with re-spect to the Reynolds number, and suggest values around 1.01– 1.02 for field scale gates. Deviation from hydrostatic pressure in the vena contracta can also be considered. At section C, Rajarat-nam and Subramanya ~1967! showed that the pressure distribu-tion deviates from hydrostatic pressure linearly with z
Dp< l
S
1 − zh3
D
r Q22B2h32 for 0 # z # h3, Dp< 0 otherwise
s3d with l< 0.08 ~at a distance x = 1.25 W from the gate in their runs!, and r the mass density of water. Integrating with respect to
zgives a correction factor of 1 + l / 2 on the kinetic energy. Hence,
kmay also account for pressure correction.
In dimensionless form, using X = h0/H0 ~dimensionless
up-stream depth!, s = h1/H0 ~dimensionless downstream depth!,
a= W / H0 ~relative opening! and the upstream Froude number
F0= Q /sB
Î
gh03d leads to F02= 2a 2C c 2 X3 s1 − sd k s4d X= 1 −S
aCc XD
2s1 − sd k s5d Momentum BalanceThe momentum balance is applied in the x direction rQ 2 Bh0 +1 2rgBh0 2+ F gd= bur Q2 Bh3 + FpC+ Fgu s6d where Fgd, Fgu, and FpC= pressure forces on the downstream face of the gate, on its upstream face, and at section C, respectively; and bu= momentum correction factor.
On the downstream face of the gate, above the jet, the velocity magnitude is small, and therefore the pressure can be assumed hydrostatic ~Rajaratnam and Subramanya 1967!
Fgd= e 1
2rgBsh1− Wd
2 s7d
with e = 1 if h1. W, e = 0 if h1# W.
The pressure force at the contracted section is written taking account of pressure correction
FpC= 1 2rgBh1 2+1 2lr Q2 2Bh3 s8d The pressure force on the upstream face, Fgu, is obtained from a closed-form expression for the potential velocity upstream of a rectangular contraction ~Belaud and Litrico 2008!. The method assumes that the horizontal velocity is uniform under the gate, which is verified whether in free flow or in submerged flow ~Rajaratnam and Subramanya 1967!. In the case of a gate on a horizontal bed, the vertical component of the velocity on the up-stream face of the gate, vszd, is given by
vszd = − Q pWBlog
S
sinpsz+Wd2H 0 sinpsz−Wd2H 0D
s9d Applying the Bernoulli theorem yields the dimensionless pres-sure, p˜ = p / rgH0 p ˜sz˜d = 1 − z˜ − 1 2p2 F02X3 a2F
logS
sinspsz˜ + ad/2d sinspsz˜ − ad/2dDG
2 s10d where z˜ = z / H0. Eq. ~10! yields p˜ → −` when z˜ → a. The physicallimit of validity is given by p˜ = p˜0, where p˜0= dimensionless gauge pressure exerted on the jet when it separates from the gate. This pressure is given by continuity of the pressure exerted down-stream from the gate. As long as h1, W, such as in free flow,
p
˜0= 0, otherwise the hydrostatic assumption on the downstream face leads to p˜0= s − a. Belaud and Litrico ~2008! showed that the value zlfor which pszld = 0 ~in free flow! is very close to W. This approximation is easily extended to submerged conditions
z ˜l. a + 2 sinspad/p exp
f
CpÎd cÎ1−sg
− cosspad − sinspad CcÎ1−sÎd s11d where d = 1 − a − p˜0. When h1. W, d = 1 − s, otherwise d = 1 − a.Note that z˜l is a function of Cc, a, and s. By making use of trigonometric identities and the change of variables t
= tanspz / 2H0d / tansap / 2d and tl= tanspzl/2H0d / tansap / 2d,
inte-gration of Eq. ~10! is expressed in dimensionless form as
F ˜ gu=s1 − ad2− 2F02X3fsa,tld s12d where fsa,tld = tansap/2d p3a
E
tl ` 11 + tan2sap/2dt2log 2
S
t+ 1t− 1
D
dt s13d The dimensionless momentum equation is obtained from Eq. ~6! as 2F02X2+ X2+ ess − ad2= 2 F02X3 aCc + s2+l 2 F02X3 aCc +s1 − ad2 − 2F0 2 X3 a fsa,tld s14dCombining Eqs. ~4!, ~5!, and ~14! leads to 4X − 3X2+ ess − ad2=s4 + ldbu kaCcs1 − sd + s 2+s1 − ad2 −4 kaCc 2s1 − sdfsa,t ld s15d
Solving the system of Eqs. ~5!–~15! leads to the values of Ccand
X as functions of a and s. The effect of l on momentum is, to some extent, counterbalanced by its effect on energy, and the
same for velocity distribution at section C. Therefore, most cor-rections can be considered through coefficient k, setting l = 0 and bu= 1. We now distinguish the free flow conditionsss = ad and two regimes in submerged flow, according to the value of e.
Contraction Coefficient in Free Flow
In this case the water level h1is equal to h3= CcW and Fgd= 0. Therefore, we have e = 0 and s = h1/H0= aCc. In the limiting case,
a → 0, the solution of Eqs. ~15! and ~5! is found as Cc= Cc0 = 0.6182 which is close to that obtained by the conformal map-ping method sp / sp + 2d < 0.611d, the slight difference being ex-plained by the different assumptions made for the potential solution. For finite a, Eqs. ~15! and ~5! are valid until h0. W
sX . ad, which corresponds to a mathematical limit of a . 0.815,
F1= 1.44, and F0< 0.7. This is higher than the physical limit
iden-tified by Montes ~1997! who reports free surface instabilities for
a. 0.5 and a physical limit of a< 0.6 sF1< 1.9d.
The variation of Cc with a are compared in Fig. 2 with the numerical results of Fangmeier and Strelkoff ~1968!, Vanden-Broeck ~1997!, Marchi ~1953!, and Chung ~1972!. Cc decreases when a increases from 0–0.5, then slightly increases for larger values of a. The minimum value of Ccis slightly below 0.6. The results presented here are also very close to those presented by Montes ~1997!.
Experimental values of Ccare generally higher than the theo-retical predictions, as illustrated on Fig. 3 with the data provided by Fawer ~1937!, Rajaratnam ~1977!, and Defina and Susin ~2003!. This is particularly true at smaller laboratory scales where fluid viscosity, surface tension, relative boundary roughness, and exact geometry may be of importance ~Speerli and Hager 1999!. The main energy loss is due to friction in the boundary layers, especially in the vena contracta and near the separation point. These effects are all the higher when the gate Reynolds number is low ~Roth and Hager 1999; Clemmens et al. 2003!, which leads to scale effects between laboratory data and field data. Also, the relative importance of the boundary layer in the vena contracta affects the velocity distribution, and therefore the downstream kinetic energy ~Ohtsu and Yasuda 1994!. The influence of the corner vortices and eddies in the upstream recirculation zone should be considered too. The energy transferred to turbulence by these large scale structures are not necessarily dissipated before the contracted section. However, the velocity distribution can be affected even if the total energy ~mean kinetic plus turbulent
ki-netic energy! is roughly constant. These effects may be consid-ered in the correction factors. Fig. 3 illustrates the effect of k for values up to 1.04 ~which corresponds to a kinetic energy correc-tion of 4%!, showing that consistent and plausible values of k can be fitted to experimental data. Experimental observations and nu-merical simulations ~Kim 2007! also suggest to consider a head loss in the conversion of kinetic energy in the upstream pool. In simulations for free flow of Kim ~2007!, the conversion is correct up to a. 0.4 but head loss appears above this value. He obtained contraction coefficients between 0.618 and 0.630.
Contraction Coefficient in Submerged Flow
Analytical Formulation
From Eq. ~14!, Ccshould be modified compared to free flow. Two different regimes must be distinguished according to the value of e. We define the partially submerged flow as the regime where the vena contracta is drownedsh1. CcWd but the downstream water level does not reach the gate sh1, Wd. In this case, Fgd= 0 and e = 0. This regime occurs when the downstream water level ~far from the gate! is increased progressively from the free flow regime.
A fully submerged flow occurs when h1 reaches the
down-stream side of the gate. In this case, h1. Wss . ad and e = 1, and
Eq. ~15! reduces to as3X − 1dCc 2 2X2= 2Cc− 1 − 2Cc 2fsa,t ld s16d
Fig. 4 gives the values of Cc in the planesa , sd for all regimes. The line s = a . Ccgives the limit between free flow and submerged flow, while s = a is the limit between partially and fully submerged flow. For small a, Cc< Cc0even for high s. Indeed, setting a = 0 in Eq. ~16! leads to the same equation as in free flow. When
a= 0.5, Cc is much more sensitive to s, and its value remains above 0.65 when s . 0.5. In this case, Ccis about 10% higher than in free flow at the same opening. At a much larger opening
0.0 0.2 0.4 0.6 0.8 0.58 0.60 0.62 0.64 0.66 0.68
Relative opening, a=W/Ho
Contraction coefficient, Cc Present model Fangmeier&Strelkoff 1968 Marchi 1953 Vanden−Broeck 1997 Chung 1972
Fig. 2. Contraction coefficient as a function of relative opening a in
free flow 0.70 0.75 0.80 fic ie nt , Cc Fawer (4cm) Defina&Susin 2003 Fawer (3cm) This study, k=1 Fawer (2cm) This study, k=1.01 Rajaratnam 1977 This study, k=1.02 Benjamin (3.57 inches) This study, k=1.04 Benjamin (1.2 inches) 0.55 0.60 0.65 0.0 0.2 0.4 0.6 0.8 Co nt ra ct io n co ef f
Relative opening, a=W/H0
Fig. 3. Contraction coefficient in free flow: Experimental data by
Defina and Susin ~2003!; Fawer ~1937!; Benjamin ~1956!; Rajarat-nam ~1977! ~dots! and present model with different values of correc-tion factor k on the downstream kinetic energy. The dotted line is the best fitting proposed by Defina and Susin ~2003!.
sa = 0.8d, this deviation from the free flow reaches a maximum of 25%.
Effect of Gate Opening on Cc
For different fixed values of s = h1/H0, Ccis plotted as a function of the relative opening a ~Fig. 5!. Unlike in free flow, Cctends to increase when a increases. Then, when the flow becomes partially submerged, Cc slightly decreases to reach the free flow value when a = s / Cc< 1.67 s. In fully submerged flow ss . ad, s has little influence on Cc. The influence is due to the function fsa , tld in which tldepends on s, but the variation of f with s is small compared to its variation with a. A good approximation of f, calculated numerically with Cc= Cc0, s = 0.95 is given by
fsa,tld . Fsad = 0.194a2− 0.499a + 0.308 s17d Setting X = 1 in Eq. ~16! and fsa , tld . Fsad gives the following approximation:
Cc.
1 −
Î
1 −s2Fsad + ad2Fsad + a s18d
Some experimental results confirm the increase of Ccwith a for submerged flow, such as Woycicki ~1935! who proposed the fol-lowing relation:
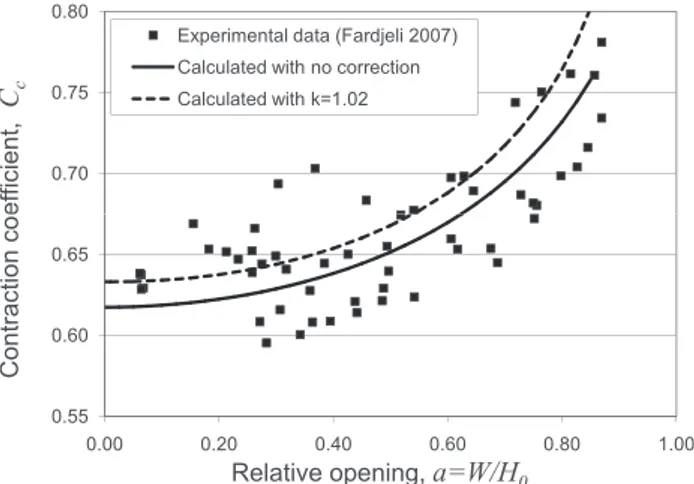
Cc= 0.617 + 0.04a s19d For large opening and large submergence, higher values of Ccare expected. This domain was explored experimentally by Fardjeli ~2007!. The canal is 30-cm-wide with a maximal depth of 45 cm. Discharge was measured using a calibrated V-notch weir and water levels were measured using point gauges. The discharge was set at two different values, 16 and 30 l/s. For each discharge, five gate openings were used ~3, 6, 12, 20, and 30 cm!. Different water levels were controlled by a downstream sluice gate. The experimental Cc was estimated indirectly from Eq. ~2!, and is plotted with respect to a on Fig. 6. Although some discrepancy appears in the relation, the trend is well reproduced by Eq. ~18!. As for free flow, correction factors may be used to account for simplifications, such as no energy loss, hydrostatic pressure and nonuniform velocity in contracted section. Although these as-sumptions are justified by a few experimental results of Rajarat-nam and Subramanya ~1967!, more investigation is needed to quantify them and modify the corresponding forces and momen-tum accordingly. As for free flow, increasing k tends to increase
Cc, as shown in Fig. 6 with k = 1.02.
Effect of Downstream Level h2
The previous calculations used h1 rather than h2. This is
physi-cally justified since h1is more representative of the flow
condi-tions that prevail in the vicinity of the vena contracta. The use of
h2is often preferred since it is less variable, whereas h1should be
filtered. While both quantities are almost equal at large submer-gence, they largely deviate as s becomes small. The link between
h1 and h2 depends on the downstream pool characteristics. In
particular, if several gates flow in parallel, they should have the same h2but may be not the same h1.
To illustrate the effect of h2, a rectangular downstream channel
is considered. The momentum principle leads to
s=
Î
s82+ 4a2C c 2s1 − sdS
1 s8− 1 aCcD
s20d where s8= h2/H0. Fig. 7 shows the variations of s and Ccwith s8 for a = 0.2, a = 0.4, and a = 0.6. The appearance of partially sub-merged flow, as h2increases, is clearly visible. For a fullysub-merged flow, Cc is almost constant. Considering three gates in
Fig. 4. Flow regime and Ccin planesa , sd
0.0 0.2 0.4 0.6 0.8 0.55 0.60 0.65 0.70 0.75 0.80 0.85
Relative opening, a=W/Ho
Contraction coefficient, Cc Free flow s=0.2 s=0.5 s=0.8 s=0.9
Fig. 5. Variation of Cc as a function of relative gate opening
a= W / H0. Different downstream conditions are applied: free flow,
s= 0.2, s = 0.5, s = 0.8, and s = 0.9. 0.70 0.75 0.80 ef fic ie nt , Cc
Experimental data (Fardjeli 2007) Calculated with no correction Calculated with k=1.02 0.55 0.60 0.65 0.00 0.20 0.40 0.60 0.80 1.00 Co nt ra ct io n co e
Relative opening,a=W/H0
Fig. 6. Experimental results for Cc in submerged flow ~dots!, pre-dicted Cc without correction ~plain line! and with k = 1.02 ~dashed line!, and the data set of Fardjeli ~2007!
parallel with different gate openings, such as on Fig. 7, h2~and s8!
can be the same, but the contraction coefficient can be signifi-cantly different. Taking s8= 0.85 gives variations of 10% on Cc between a = 0.2 and a = 0.6, and s values of 0.66 and 0.80, respec-tively, both effects leading to discharge four times larger for
a= 0.6 than for a = 0.2.
Application to Discharge Measurement
Assuming that W and H0 are measured, as well as h1 in
sub-merged flow, a and s are calculated. The flow regime is deter-mined, and then Ccusing Eqs. ~5! and ~15!. Alternatively, Cccan be determined from Fig. 4. The discharge is calculated from the energy equation
Q=C
Î
ckWB
Î
2gsH0− h1d s21dwith h1= CcWin free flow. The coefficient k can be considered as a calibration coefficient. However, k . 1 increases Cc to some extent, and therefore its sensitivity is rather limited.
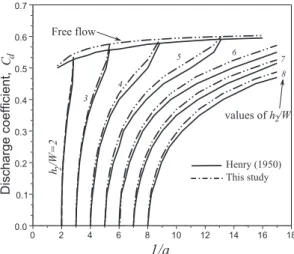
The approach is applied to well known experimental results of Henry ~1950! ~see Fig. 8!. Since h2is used rather than h1, Eq. ~20!
is used. The present method slightly overpredicts the discharge coefficient. A k factor of 1.05 in Eq. ~21! gives an excellent su-perposition with Henry’s curves, which means that the present
method overpredicts the discharge coefficient by about 2.5%. In these curves, however, large openings sa $ 0.5d were little ex-plored. The performance of the method is also evaluated on the data set of Fardjeli ~2007!. The formulas of Garbrecht ~1977! and Swamee ~1992! were applied too. Swamee’s formula performs poorly in the studied domain ~Fig. 9! as can be expected from its mathematical formulation, obtained by fitting on Henry’s curves where a # 0.5. In particular, Swamee’s formula gives no solution for a $ 0.811/0.72. 0.746. The formulation proposed by Garbrecht ~1977! performs better, except for lower values of Cd, correspond-ing to large submergence. Uscorrespond-ing the present method gives the best results, all prediction errors being lower than 10%.
Conclusion
We proposed a new theoretical framework for the calculation of contraction coefficients under sluice gates on flat bed. The ap-proach, based on momentum and energy conservation between the upstream pool and the contracted section, relies on an analyti-cal analyti-calculation of the pressure field upstream of the sluice gate.
In free flow, results are consistent with published results. The study was extended to submerged conditions, for which few the-oretical results are available. A partially submerged regime was defined to occur when the vena contracta is drowned but the downstream water body does not touch the downstream side of the gate. In submerged flow, Cc remains close to its free flow value when the relative gate opening is small whatever the sub-mergence, which confirms experimental results and a generally admitted assumption. This is no longer valid at large opening, where Cccan be much higher than 0.6, provided the flow is suf-ficiently submerged. In this case, the value of Ccdepends little on the submergence. Such a variation of Cc should be taken into account when calculating the flow through a largely open and largely submerged gate, for modeling or measuring purpose for instance. Experimental results confirm such variation with gate opening. The method is then applied to discharge calculation with good results, especially at large opening and large submergence. The approach can be directly used to gates with a sill, possibly with a different height in the upstream and downstream pools. For that, additional pressure forces need to be included in the
momen-0 5 0.6 0.7 0.8 0.9 1 s Cc (a=0.2) s (a=0.2) Cc (a=0.4) s (a=0.4) Cc (a=0.6) s (a=0.6) 0 0.1 0.2 0.3 0.4 0.5 0.4 0.5 0.6 0.7 0.8 0.9 1 Cc , s'=h2/H0
Fig. 7. Variation of Cc and s with s8= h2/H0, a = 0.2, a = 0.4,
and a = 0.6
Fig. 8. Application of present method to experimental results of
Henry ~1950! 0.40 0.50 0.60 0.70 ue s of Cd 0.00 0.10 0.20 0.30 0.00 0.10 0.20 0.30 0.40 0.50 0.60 0.70 Pr ed ic te d va lu Experimental values of Cd Garbrecht (1977) Swamee (1992) This study Perfect agreement Overpredict by 10% Underpredict by 10%
Fig. 9. Predicted values of discharge coefficient Cdwith the model of ~diamonds! Garbrecht ~1977!, formula ~crosses! of Swamee ~1992!, and present model ~triangles!, versus experimental values using the data set of Fardjeli ~2007!
tum balance. Also, real fluid effects may be of importance in some regimes. Such effects can be introduced using correction coefficients in energy and momentum equations.
Notation
The following symbols are used in this technical note: a 5 relative gate opening= W / H0;
B 5 gate or channel width;
Cc 5 contraction coefficient= h3/H0;
Cc0 5 contraction coefficient for a = 0;
E0 5 upstream energy;
Fp 5 pressure force;
F0 5 Froude number at the upstream section = Q /sB
Î
gh03d;g 5 gravity constant= 9.81 m / s2;
H0 5 depth ~also head! on the upstream face on the gate;
h0 5 upstream depth or level;
h1 5 downstream depth or level ~immediately downstream of the gate!;
h2 5 downstream depth or level ~far from the gate!;
h3 5 thickness of the vena contracta;
k 5 coefficient for energy correction;
p 5 pressure;
p
˜ 5 dimensionless pressure= p /srgH0d;
Q 5 discharge through the gate;
s 5 submergence ratio= h1/H0;
tl 5 relative limit for pressure integration;
v 5 vertical velocity component; W 5 gate opening;
X 5 dimensionless upstream depth= h0/H0;
z 5 elevation;
z
˜ 5 dimensionless elevation= z / H0;
zl 5 lower limit of z for pressure integration; a 5 correction coefficient on energy; bu 5 correction coefficient on momentum;
e 5 1 if h1. W, e = 0 if h1# W;
l 5 correction coefficient on pressure distribution; and
r 5 mass density. References
Belaud, G., and Litrico, X. ~2008!. “Closed-form solution of the potential flow in a contracted flume.” J. Fluid Mech., 599, 299–307.
Benjamin, T. B. ~1956!. “On the flow in channels when rigid obstacles are placed in the stream.” J. Fluid Mech., 1, 227–248.
Binnie, A. ~1952!. “The flow of water under a sluice gate.” Q. J. Mech.
Appl. Math., 5, 395–407.
Chung, Y. ~1972!. “Solution of flow under sluice gates.” J. Engrg. Mech.
Div., 98~1!, 121–140.
Clemmens, A., Strelkoff, T., and Replogle, J. ~2003!. “Calibration of submerged radial gates.” J. Hydraul. Eng., 129~9!, 680–687. Defina, A., and Susin, F. ~2003!. “Hysteretic behavior of the flow under a
vertical sluice gate.” Phys. Fluids, 15, 2541–2548.
Fangmeier, D., and Strelkoff, T. ~1968!. “Solution for gravity flow under a sluice gate.” J. Engrg. Mech. Div., 94~EM1!, 153–176.
Fardjeli, N. ~2007!. “Modélisation d’ouvrages de régulation pour l’aide à la gestion des canaux.” MS thesis, Montpellier Supagro, France, 57 ~in French!.
Fawer, C. ~1937!. “Etude de quelques écoulements permanents à filets courbes.” Ph.D. thesis, EPF Lausanne, Switzerland ~in French!. Garbrecht, G. ~1977!. “Discussion of ‘Discharge computations at river
control structures’ by L. Dannie.” J. Hydr. Div., 103~2!, 1481–1484. Henry, R. ~1950!. “Discussion to ‘On submerged jets.’” Trans. ASCE,
115, 687–694.
Kim, D. ~2007!. “Numerical analysis of free flow past a sluice gate.”
KSCE J. Civil Engineering, 11~2!, 127–132.
Larock, B. ~1969!. “Gravity-affected flow sluice gate.” J. Hydr. Div., 95~HY4!, 153–176.
Marchi, E. ~1953!. “Sui fenomeni di efflusso piano da luci a battente.”
Ann. Mat. Pura Appl., 35~1!, 327–341 ~in Italian!.
Montes, J. S. ~1997!. “Irrotational flow and real fluid effects under planar sluice gates.” J. Hydraul. Eng., 123~3!, 219–232.
Ohtsu, I., and Yasuda, Y. ~1994!. “Characteristics of supercritical-flow below sluice gate.” J. Hydraul. Eng., 120~3!, 332–346.
Rajaratnam, N. ~1977!. “Free flow immediately below sluice gates.” J.
Hydr. Div., 103~4!, 345–351.
Rajaratnam, N., and Subramanya, K. ~1967!. “Flow immediately below submerged sluice gate.” J. Hydr. Div., 93~4!, 57–77.
Roth, A., and Hager, W. ~1999!. “Underflow of standard sluice gate.”
Exp. Fluids, 27, 339–350.
Speerli, J., and Hager, W. ~1999!. “Discussion to ‘Irrotational flow and real fluid effects under planar sluice gates’ by J.S. Montes.” J.
Hy-draul. Eng., 125~2!, 208–210.
Swamee, P. ~1992!. “Sluice gate discharge equations.” J. Irrig. Drain.
Eng., 118~1!, 56–60.
Tel, J. ~2000!. “Discharge relations for radial gates.” MS thesis, Delft Technical Univ., The Netherlands.
Vanden-Broeck, J. ~1997!. “Numerical calculations of the free-surface flow under a sluice gate.” J. Fluid Mech., 330, 339–347.
von Mises, R. ~1917!. Berechnung von ausfluß und ueberfallzahlen, Zeitschrift des Vereine Deutscher Ingenieure, Berlin ~in German!. Woycicki, K. ~1935!. “The hydraulic jump on its role on discharge of
sluice gates.” Technical Rep. No. 3-2, U.S. Bureau of Reclamation, Denver, 65.