arXiv:1811.05742v2 [astro-ph.EP] 20 Feb 2019
WASP-190b: Tomographic discovery of a transiting hot Jupiter.
L. Y. Temple,1 C. Hellier,1 Y. Almleaky,2, 3D.R. Anderson,1 F. Bouchy,4 D.J.A. Brown,5, 6 A. Burdanov,7 A. Collier Cameron,8 L. Delrez,9 M. Gillon,7E. Jehin,7 M. Lendl,10, 4 P.F.L. Maxted,1C. Murray,11
L. D. Nielsen,4 F. Pepe,4 D. Pollacco,5, 6 D. Queloz,11 D. S´egransan,4 B. Smalley,1 S. Thompson,11 A.H.M.J. Triaud,12 O.D. Turner,4, 1S. Udry,4 and R.G. West5
1
Astrophysics Group, Keele University, Staffordshire, ST5 5BG, UK 2
Space and Astronomy Department, Faculty of Science, King Abdulaziz University, 21589 Jeddah, Saudi Arabia
3
King Abdullah Centre for Crescent Observations and Astronomy (KACCOA), Makkah Clock, Saudia Arabia 4
Observatoire astronomique de l’Universit´e de Gen`eve 51 ch. des Maillettes, 1290 Sauverny, Switzerland 5
Department of Physics, University of Warwick, Gibbet Hill Road, Coventry, CV4 7AL, UK 6
Centre for Exoplanets and Habitability, University of Warwick, Gibbet Hill Road, Coventry CV4 7AL, UK
7
Space sciences, Technologies and Astrophysics Research (STAR) Institute, Universit´e de Li`ege, All´ee du 6 Aoˆut 17, 4000 Li`ege, Belgium 8
SUPA, School of Physics and Astronomy, University of St. Andrews North Haugh, Fife, KY16 9SS, UK
9
Cavendish Laboratory, J J Thomson Avenue, Cambridge, CB3 0HE, UK
10
Space Research Institute, Austrian Academy of Sciences, Schmiedlstr. 6, 80 42, Graz, Austria 11
Cavendish Laboratory, J J Thomson Avenue, Cambridge, CB3 0HE, UK 12
School of Physics & Astronomy, University of Birmingham, Edgbaston, Birmingham, B15 2TT, UK
Submitted to AJ ABSTRACT
We report the discovery of WASP-190b, an exoplanet on a 5.37-day orbit around a mildly-evolved F6 IV-V star with V = 11.7, Teff= 6400 ± 100 K, M∗= 1.35 ± 0.05 M⊙ and R∗= 1.6 ± 0.1 R⊙. The planet
has a radius of RP= 1.15 ± 0.09 RJup and a mass of MP= 1.0 ± 0.1 MJup, making it a mildly inflated hot
Jupiter. It is the first hot Jupiter confirmed via Doppler tomography with an orbital period > 5 days. The orbit is also marginally misaligned with respect to the stellar rotation, with λ = 21 ± 6◦ measured
using Doppler tomography.
Keywords: planets and satellites: detection — planets and satellites: individual (WASP-190b ) — stars: individual (WASP-190 )
1. INTRODUCTION
The Rossiter–McLaughlin (RM) effect, a distortion of the line profiles of a star caused by an occulting body blocking part of the stellar face, was first detected for a transiting hot Jupiter by Queloz et al. (2000) in ob-servations of HD 209458, whereby the distortion was
Corresponding author: L. Y. Temple
detected as a perturbation to radial velocity measure-ments. It has since been used extensively to measure the projected angle between the planet’s orbit and the stellar rotation axis in many hot-Jupiter systems (e.g.
Triaud 2017). The current alignment of a planetary or-bit with respect to the stellar rotation is an indicator of the dynamical history of the planet, and can point to the formation mechanisms at play.
One can also plot the line profiles as a function of phase, looking for the Doppler shadow of the planet
as it moves across the line profiles. The detection of the Doppler tomographic signal of a candidate exo-planet can rule out transit mimics such as blended eclipsing binaries. This “tomographic” method was first used in the discovery of a planet for WASP-33b (Collier Cameron et al. 2010b). The tomographic tech-nique is particularly useful for systems with hotter and fast-rotating stars, with fewer and broader spectral lines, which may give only less-accurate radial-velocity measurements and thus were previously paid less at-tention by transit and radial velocity surveys. Thus Doppler tomography has now been used in the dis-covery of hot Jupiters transiting hot stars, including KELT-20b (Lund et al. 2017), HAT-P-67b (Zhou et al. 2017), WASP-167b/KELT-13b (Temple et al. 2017), MASCARA-1b (Talens et al. 2017) and WASP-189b (Anderson et al. 2018).
Brown et al. (2017) compare tomographic and RM analyses of the same datasets for six WASP systems. They find that the tomographic method consistently gives better constraints on values for the projected stellar rotational velocity v sin i⋆ and the sky-projected
obliquity angle λ. Note that the tomographic analysis method uses the line profiles more directly, while an RM analysis in terms of radial-velocity measurements (RVs) needs one to translate the change in the line profiles ow-ing to a planet shadow into a change in the overall radial velocity (e.g.Hirano et al. 2011;Bou´e et al. 2013).
The number of known exoplanets has grown to the point where population studies can draw significant and meaningful conclusions about their bulk properties and dynamical histories. For example, Schlaufman (2018) uses a sample of 146 systems comprised of a solar-like star and a giant planet, brown dwarf, or low-mass stellar companion, to place a mass-limit boundary between hot Jupiters and brown dwarfs which relies on their forma-tion mechanism. It is not possible, however, to perform the same scale of population studies for hot Jupiters or-biting early-type stars, due to the relative lack of such objects discovered so far (resulting, at least partially, from selection biases in past transit and radial-velocity surveys).
Hot Jupiters orbiting hot stars are of interest due to the orbital and physical differences between them and hot Jupiters orbiting later-type stars. They are more likely to be in misaligned orbits Winn et al.
(2010); Triaud (2017), often have stars which rotate more quickly than the planet’s orbit (e.g.Crouzet et al. 2017;Temple et al. 2017), and are inflated, with hotter dayside temperatures, due to the increased irradiation from their host star (Hartman et al. 2016;Temple et al. 2018). The increased irradiation might also result in
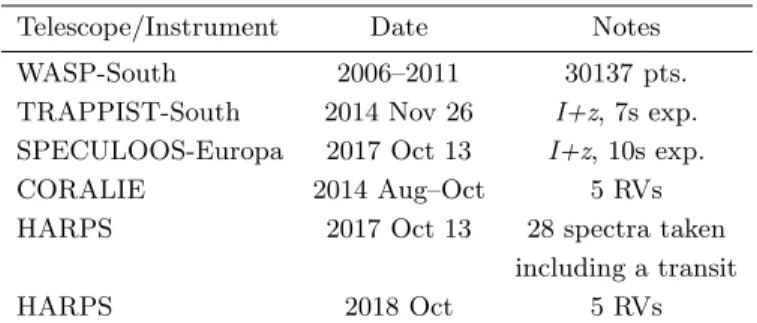
Table 1. Observations of WASP-190b.
Telescope/Instrument Date Notes
WASP-South 2006–2011 30137 pts.
TRAPPIST-South 2014 Nov 26 I+z, 7s exp. SPECULOOS-Europa 2017 Oct 13 I+z, 10s exp.
CORALIE 2014 Aug–Oct 5 RVs
HARPS 2017 Oct 13 28 spectra taken
including a transit
HARPS 2018 Oct 5 RVs
planetary magnetic fields which are stronger than in cooler Jupiters, since the continuous injection of energy into the interior of a gas giant might produce a more efficient planetary dynamo (Yadav & Thorngren 2017). In this work, we report the discovery and character-isation of WASP-190b, a hot Jupiter orbiting a star of Teff= 6400 K which can be found in TESS Sector 2
as TIC ID:116156517 (Ricker et al. 2015;Stassun et al. 2018). We use both tomographic and RM analyses to determine the geometry of the system, and confirm the existence of the planet via the detection of its Doppler shadow and by measuring its mass using orbital RV mea-surements.
2. DATA AND OBSERVATIONS
We observed WASP-190 using the WASP-South tele-scope (Hellier et al. 2011) at the South African Astro-nomical Observatory (SAAO) from 2006 to 2011. After the detection of a planet-like transit dip in the WASP lightcurve we confirmed the transit with a follow-up lightcurve obtained using the TRAPPIST-South tele-scope (Jehin et al. 2011), and proceeded to obtain recon-naissance spectroscopy with the Euler/CORALIE spec-trograph (Queloz et al. 2001). These were sufficient to rule out a stellar-mass binary, but with relatively large errors were consistent with no motion at the level of 250 m s−1and were inconclusive about whether the
tran-siting body was a planet.
We thus attempted tomography of a transit, obtain-ing a series of 28 spectra through transit on the night of 2017 October 13 using the ESO 3.6-m/HARPS spectro-graph (Pepe et al. 2002), accompanied by simultaneous photometry using the SPECULOOS-Europa telescope (Burdanov et al. 2018;Gillon 2018;Delrez et al. 2018). After tomographic detection of a planet-like signal, we obtained 5 further orbital RVs with HARPS to constrain the planetary mass.
The HARPS spectra were cross-correlated over a window of ± 350 km s−1, using a mask matching a
G2 spectral type, and the standard HARPS Data Reduction Software as described by Baranne et al.
Table 2. RV measurements of WASP-190, taken using the CORALIE and HARPS spectrographs for this work.
BJDT DB RV σRV BS σBS
–2,450,000 (km s−1) (km s−1) (km s−1) (km s−1) CORALIE (out of transit):
6871.794771 0.89 0.05 –0.07 0.10 6895.811527 0.94 0.05 –0.16 0.10 6922.731329 0.90 0.03 –0.05 0.06 6952.511870 0.95 0.04 0.15 0.08 7000.625106 0.87 0.04 –0.22 0.08 8392.595422 0.84 0.07 –0.24 0.14
HARPS (including a transit):
8040.529251 0.84 0.02 0.04 0.04 8040.540026 0.82 0.02 –0.04 0.04 8040.550489 0.84 0.02 0.05 0.04 8040.561472 0.86 0.02 –0.02 0.04 8040.572351 0.85 0.02 –0.05 0.04 8040.582918 0.85 0.02 –0.02 0.04 8040.593797 0.87 0.02 –0.00 0.04 8040.604572 0.92 0.02 0.02 0.04 8040.615243 0.89 0.02 –0.07 0.04 8040.626122 0.90 0.02 –0.13 0.04 8040.636897 0.87 0.02 –0.06 0.04 8040.647776 0.84 0.02 –0.01 0.04 8040.658459 0.80 0.02 –0.02 0.04 8040.669130 0.79 0.02 0.04 0.04 8040.680113 0.80 0.02 0.10 0.04 8040.690784 0.80 0.02 0.03 0.04 8040.701350 0.78 0.02 –0.07 0.04 8040.712334 0.76 0.02 –0.03 0.04 8040.723016 0.73 0.02 –0.03 0.04 8040.733791 0.76 0.02 –0.05 0.04 8040.744670 0.73 0.03 –0.05 0.06 8040.755341 0.76 0.03 0.05 0.06 8040.766220 0.77 0.03 0.09 0.06 8040.777100 0.81 0.03 –0.10 0.06 8040.787770 0.83 0.03 –0.02 0.06 8040.798545 0.82 0.03 0.10 0.06 8040.809112 0.85 0.03 –0.06 0.06 8040.820107 0.82 0.03 0.06 0.06
HARPS (out of transit):
8393.843700 0.92 0.01 –0.20 0.02
8396.706300 0.73 0.01 0.10 0.02
8397.590800 0.86 0.04 –0.15 0.08
8398.611000 0.92 0.02 –0.24 0.04
8399.542350 0.85 0.04 –0.13 0.08
(1996),Pepe et al.(2002). We then analysed the cross-correlation functions (CCFs) themselves, and computed radial velocity (RV) measurements from the CCFs which we list in Table2 along with bisector spans (BS).
We used the WASP photometric data to look for any evidence of rotational modulation of the host star, using the methods ofMaxted et al. (2011). We find no such variability at periods longer than a day, with a 95%-confidence upper limit on the amplitude of 1 mmag.
3. STELLAR PARAMETERS FROM SPECTRAL ANALYSIS
In order to determine stellar parameters of WASP-190 we co-added the HARPS spectra obtained on the night of 2017 Oct 13 and performed a spectral analysis. We adopted a microturbulent velocity of vmic= 1.6 km s−1
from the calibration ofBruntt et al.(2010) and a macro-turbulent velocity of vmac= 6.5 km s−1 from the
calibra-tion ofDoyle et al.(2014). We used the Hα line to deter-mine an effective temperature Teff= 6400 ± 100 K, while
using the Na D feature to measure log g∗= 3.9 ± 0.1. We
also determined the projected stellar rotational veloc-ity v sin i⋆= 13.8 ± 0.7 km s−1, and the surface metallicity
[Fe/H] = −0.02 ± 0.05. These results are also listed in Ta-ble3. Using the MKCLASS program (Gray & Corbally 2014) we then obtained a spectral type of F6 IV–V.
4. COMBINED MCMC ANALYSIS
We conduct an analysis very similar to that conducted byTemple et al.(2018) for WASP-174b, which involves the use of Markov Chain Monte Carlo (MCMC) methods to analyse the combined photometric and spectroscopic datasets. As one approach we use the in-transit spec-troscopy data in the form of RV measurements, follow-ing the method ofHirano et al.(2011), and as a second approach we use the same data in the form of CCFs, following methods similar to that used byBrown et al.
(2017); Temple et al. (2017). We call the former the Rossiter–McLaughlin (RM) analysis and the latter the tomographic analysis.
The code we use is described byCollier Cameron et al.
(2007) andPollacco et al.(2008), which in the latest ver-sion includes the tomographic analysis as described by
Collier Cameron et al. (2010a). In both analyses, fit-ting the photometric lightcurves allows direct measure-ment of the planet-to-star area ratio (Rp/R⋆)2, the
im-pact parameter b and the key transit timing information Tc, P, T14 and by extension T12, which are respectively the epoch of mid-transit, the orbital period, the tran-sit duration and the duration of ingress (or equivalently egress). We use the value of Teff obtained in the
Table 3. All system parameters obtained in the combined analyses for WASP-190b .
1SWASP J003050.23–403424.3 2MASS 00305023–4034243 TIC ID:116156517 Gaia DR2 4994237247949280000 RA = 00h30m50.233s, Dec = –40◦34′ 24.36′′ (J2000) V = 11.7 ± 0.1 (TYCHO2)
GaiaDR2 Proper Motions:
(RA) 38.23 ± 0.03 (Dec) –9.14 ± 0.04 mas/yr GaiaDR2 Parallax: 1.82 ± 0.03 mas Rotational Modulations: < 1 mmag (95%) Stellar parameters from spectral analysis:
Parameter Value
(Unit)
Spectral type F6 IV–V
Teff (K) 6400 ± 100 log g∗ 3.9 ± 0.1 [Fe/H] –0.02 ± 0.05 vsin i∗(km s−1) 13.8 ± 0.7 vmic (km s−1) 1.6 (assumed) vmac (km s−1) 6.5 (assumed)
Parameters from photometric and RV analysis:
Parameter DT Value (Unit) (adopted): P(d) 5.367753 ± 0.000004 Tc(BJDTDB) 2457799.1256 ± 0.0007 T 14(d) 0.186 ± 0.002 T12= T34(d) 0.017 ± 0.002 R2 P/R2∗ 0.0062 ± 0.0002 b 0.45 ± 0.09 i(◦) 87.1 ± 0.7 a(AU) 0.0663 ± 0.0008 M∗(M⊙) 1.35 ± 0.05 R∗(R⊙) 1.6 ± 0.1 log g∗ (cgs) 4.17 ± 0.04 ρ∗(ρ⊙) 0.34 ± 0.05 T eff (K) 6400 ± 100 [Fe/H] –0.02 ± 0.05 K (km s−1) 0.099 ± 0.009 M P(MJup) 1.0 ± 0.1 RP(RJup) 1.15 ± 0.09 log gP (cgs) 3.2 ± 0.1 Teql(K) 1500 ± 50
Parameters from RM and DT analyses:
Parameter DT Value RM Value:
(Unit) (adopted): γ(km s−1) 0.82 ± 0.01 0.823 ± 0.009 λ(◦) 21 ± 6 23 ± 12 vFWHM(km s−1) 10 ± 1 – vsin i⋆(km s−1) 13.3 ± 0.6 14.1 ± 0.7
-0.30 -0.20 -0.10 0.00 0.10 0.20 0.30
0.99
1.00
1.02
No
rm
ali
ze
d F
lux
WASP
-0.04 -0.03 -0.01 0.00 0.01 0.03 0.04
0.97
0.98
0.99
1.00
1.01
No
rm
ali
ze
d F
lux
2014-11-26
TRAPPIST
-South
2017-10-13
SPECULOOS
-Europa
-0.04 -0.03 -0.01 0.00 0.01 0.03 0.04
Phase
0.97
0.98
0.98
0.99
0.99
1.00
1.00
1.01
No
rm
ali
ze
d F
lux
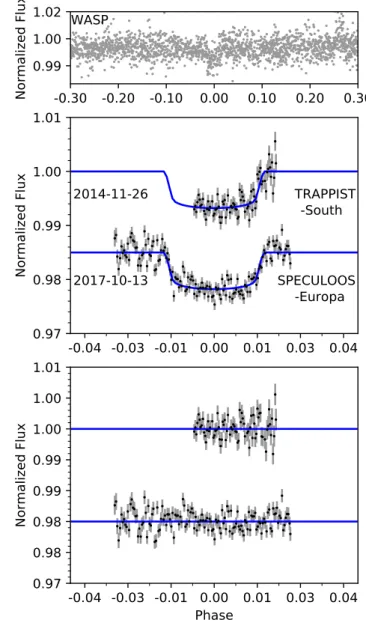
Figure 1. Top: the discovery lightcurve for WASP-190b (WASP-South). Middle: the two follow-up lightcurves with the best-fitting model shown in blue. Bottom: the residuals of the fits to the follow-up lightcurves.
value for the MCMC chains, and for each new value of Teff we interpolate four-parameter law limb-darkening
coefficients from the tables ofClaret(2000,2004). Stel-lar mass is calculated at each step using the Enoch– Torres relation (Enoch et al. 2010; Torres et al. 2010). The photometric data are displayed in Fig.1along with the best-fit model and residuals of the fit.
The RV analysis then enables measurement of the barycentric system velocity γ and the stellar reflex ve-locity semi-amplitude K. We expect that most hot Jupiters will settle into a circular orbit on a shorter timescale than their lifetimes (Pont et al. 2011), but
Table 4. Parameters for WASP-190 from bagemass: Parameter (Unit) Value
Age (Gyr) 2.8 ± 0.4 M∗ (M⊙) 1.30 ± 0.05 [Fe/H]init 0.03 ± 0.04
with an orbital period of ∼ 5 days WASP-190b is entering the regime where eccentricity may remain. However, we do not have sufficient orbital RVs to constrain the eccen-tricity and so assume a circular orbit. We do not include the CORALIE measurements in the model adopted here, although including them changes the planetary mass by much less than the error bar.
Both the RM analysis and the tomographic analysis can allow the measurement of v sin i⋆ and λ, while
pro-viding an additional constraint on the values of γ and b. However, it can often be the case that for RM analysis a prior on v sin i⋆ is required in order to obtain a
well-constrained fit, and so we adopt the spectral v sin i⋆ as
a prior for both analyses. In the tomographic analysis we also fit the local line width vFWHM, resulting from
stellar turbulence and instrumental broadening, which influences the width of the planetary perturbation of the line profiles, and whose shape is assumed to be Gaus-sian.
We show all RV measurements used in this work, along with the best fitting RV and RM models in Fig.3. We also display the tomographic data (the time series of CCFs with the average of the out-of-transit CCFs sub-tracted from all CCFs) in Fig.4, along with the best-fit planet model and residuals. The best fit parameters are listed in Table 3. We adopt the solution to the tomo-graphic analysis (see Section6) and, to avoid duplicating parameters derived from the same data (which are con-sistent in any case), the only parameters for which we list values from both analyses are γ, v sin i⋆and λ.
5. RESULTS FOR THE STAR
We find WASP-190 to have a large radius of R∗=
1.6 ± 0.1 R⊙ and a density of ρ∗= 0.34 ± 0.05 ρ⊙. This
implies that the star is beginning to evolve away from the main sequence, which would be consistent with the spectral type of F6 IV–V.
The effective temperature (Teff) was also obtained
us-ing the Infrared Flux Method (IRFMBlackwell & Shallis 1977). The stellar spectral energy distribution (SED) was obtained using literature broad-band photome-try from 2MASS (Skrutskie et al. 2006), APASS9 B, V, g′, r′ and i′ (Henden et al. 2015), USNO-B1 R (Monet et al. 2003) and WISE (Cutri & et al. 2012). The photometry was converted to fluxes and the best-fitting Kurucz (1993) model flux distribution found
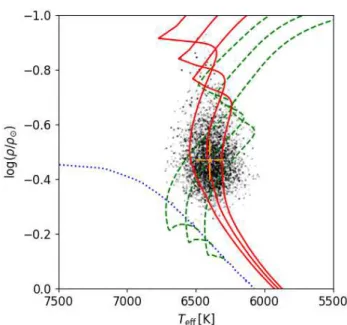
Figure 2. The best fitting evolutionary tracks and isochrones of WASP-190 obtained using bagemass. Black points: individual realisations of the MCMC. Dotted blue line: Zero-Age Main Sequence (ZAMS) at best-fit [Fe/H]. Green dashed lines: evolutionary track for the best-fit [Fe/H] and mass, plus 1σ bounds. Red lines: isochrone for the best-fit [Fe/H] and age, plus 1σ bounds. Orange star: measured values of Teff and ρ∗for WASP-190 obtained in the spectral
and photometric analyses respectively.
and integrated to determine a bolometric flux of 5.27 ± 0.26 × 10⁻¹⁰ erg s−1cm−2. No visible interstellar
lines were seen around the Na D line, so E(B − V) was assumed to be zero. The IRFM was then used, with the 2MASS fluxes, to obtain a value of Teff = 6560 ± 140 K as well as an angular diameter of θ = 0.029 ± 0.001 mas. The Gaia DR2 (Gaia Collaboration et al. 2016, 2018) lists the parallax of WASP-190 as 1.82 ± 0.03 mas. Using these values and accounting for the correction to Gaia DR2 parallax values suggested by Stassun & Torres
(2018), we obtain a stellar radius of 1.65 ± 0.08 R⊙,
which is consistent with our result from the MCMC analysis.
We investigate the age of WASP-190 using the open source software bagemass1 (Maxted et al. 2015). bagemassallows the user to fit Teff and M∗using stellar
evolutionary models calculated for different He abun-dances and mixing lengths (garstec;Weiss & Schlattl 2008). As inputs we use the values of Teff and [Fe/H]
derived from the spectral analysis in Section3, and also use the value of ρ∗ obtained in the combined analysis
(Section4) as a constraint.
0.70
0.75
0.80
0.85
0.90
0.95
RV
[k
m
s
−1]
0.6
0.8
1.0
1.2
1.4
Phase
-0.20
0.00
BS
[km
s
−1] 0.96 0.98 1.00 1.02 1.04 Phase-0.10
-0.05
0.00
0.05
0.10
RM
[k
m
s
−1]Figure 3. Top: The HARPS RV measurements used in the analysis of WASP-190b. The blue line shows the best-fit Ke-plerian RV curve and the fit to the RM effect. Centre: the bisectors for the out-of-transit RVs plotted against phase, which show no correlation with the RV measurements. Bot-tom: The region around transit on a larger scale.
Assuming solar values for the He abundance and mix-ing length gave the best-fit solution. We display the cor-responding isochrones and evolutionary tracks in Fig.2. We find the current age of WASP-190 to be 2.8 ± 0.4 Gyr, implying that the star is beginning to evolve off the main sequence. This is consistent with our finding that the star has a radius larger than expected for a main se-quence star. For comparison, the time taken to exhaust all hydrogen in the core is 3.8 ± 0.5 Gyr.
6. RESULTS FOR THE PLANET
We find a best fit K of 0.099 ± 0.009 km s−1, giving a
planet mass of Mp= 1.0 ± 0.1 MJup. The fitted planetary
radius is 1.15 ± 0.09 RJup.
The in-transit RVs, showing the RM effect, are dis-played in the lower panel of Fig. 3. The equivalent to-mogram of the same data is shown in Fig.4. Both are consistent with a planet in a prograde orbit. The pro-jected spin-orbit angle, λ, is measured as 23 ± 12◦in the
RM analysis and as 21 ± 6◦ in the tomographic
analy-sis. The planet trace is faint and hard to see, which we attribute to the star being relatively faint for tomo-graphic analysis, at V = 11.7, and the transit dip being relatively shallow for a hot Jupiter, at 0.6%. The lat-ter results from the star being relatively large at 1.6 R⊙
when compared to the planet, which has only a mildly inflated radius of 1.15 RJup.
7. DISCUSSION AND CONCLUSIONS We have shown that WASP-190b is a typical hot Jupiter with a mass of 1.0 ± 0.1 MJup and a mildly
in-flated radius of 1.15 ± 0.09 RJup. It is in a 5.4-day orbit
that is marginally misaligned with respect to the stellar rotation, with λ = 21±6◦.
The measured values of v sin i⋆ and λ are consistent
between the spectral analysis, the tomographic anal-ysis and the RM analanal-ysis. The tomographic analanal-ysis produced similar fits, giving a v sin i⋆ value consistent
with the spectroscopic value, regardless of whether we adopted the spectroscopic v sin i⋆ as a prior. In
con-trast, the RM analysis was less constrained without a prior, and the fit tended to favour values that were too large. This often occurs for systems with a low impact parameter b, since it is difficult to differentiate the ef-fects of v sin i⋆and λ on the shape of the RM curve when
it is symmetrical (e.g. Albrecht et al. 2011). Since, in WASP-190, the impact parameter has a mid-level value of b = 0.45, this tendency should be reduced, but it may be that the low signal-to-noise of the data is leading the fit to be less constrained than usual. Overall, we found that the parameters were better constrained in the to-mographic analysis than in the RM analysis, and so we adopt that fit.
While there is a well-established trend between the ir-radiation of a hot Jupiter and the inflation of its radius (e.g.Enoch et al. 2012), hot Jupiters also display a wide range of radii (e.g.Burrows et al. 2007). Sestovic et al.
(2018) investigates the relationship between planet ra-dius, mass and irradiation, finding that a more massive planet is usually less inflated than a low-mass planet of the same temperature, due to the planet’s gravity counteracting the inflation. In Fig.5we show planetary radius as a function of equilibrium temperature, and use planetary mass as a third dimension, for all plan-ets with 0.6 MJup< Mp<4.0 MJup as listed in the TEP-Cat database (Southworth 2011). The figure indicates
-60.0-40.0-20.0 0.0 20.0 40.0 60.0 80.0
Barycentric RV [km
−1]
0.99
1.00
1.01
NormalizedFlux
−0.03
−0.02
−0.01
0.00
0.01
0.02
0.03
Ph
a e
-60.0-40.0-20.0 0.0 20.0 40.0 60.0 80.0
Barycentric RV [km
−1]
−0.002 −0.001 0.000Inten ity
0.001 0.002 0.003 0.004-60.0-40.0-20.0 0.0 20.0 40.0 60.0 80.0
Barycentric RV [km
−1]
Figure 4. Centre-left: The Doppler tomogram comprised of the time series of residual HARPS CCFs calculated by subtracting the average of the out-of-transit CCFs from all CCFs. Left: the SPECULOOS-Europa lightcurve taken simultaneously with the HARPS observation. Centre-right: The best-fit planet model. Right: the residuals remaining after subtracting the best-fit planet model from the centre-left tomogram. In the three tomographic panels, the start and end times of the transit are marked with horizontal white dashes, while the vertical dashes mark respectively the positions of γ-v sin i⋆ , γ and γ+v sin i⋆ . We
interpret the tomogram as showing a very faint, prograde planet signal which in places is completely masked by background noise.
that planets of a given mass and equilibrium temper-ature can have a wide range of radii, and shows that planets of ∼ 1 MJup like WASP-190b are not necessarily
inflated, implying that the invocation of some third pa-rameter is required. Possible causes of the disparity in-clude different evolutionary histories, leading to different amounts of irradiation over time (e.g. Hartman et al. 2016), the possibility of internal heating mechanisms (e.g.Kurokawa & Inutsuka 2015;Ginzburg & Sari 2015;
Thorngren & Fortney 2018;Ryu et al. 2018) and differ-ences in the mass and metallicity of the planets’ cores (e.g. Enoch et al. 2012).
With λ = 21 ± 6◦, WASP-190b is marginally
mis-aligned. This is consistent with the known trend in hot-star systems, whereby planets around stars beyond the Kraft break have a wider range of obliquities, with most being in misaligned orbits (e.g. Winn et al. 2010;
Dai & Winn 2017). The true orbit may be more strongly misaligned, however, since the value of |λ| for non-polar misaligned orbits represents a lower limit for the true obliquity |ψ|. To measure ψ it would be necessary to independently measure the stellar equatorial rota-tional velocity v or stellar inclination i⋆ (for example,
by looking for differential rotation effects as described byCegla et al. 2016).
WASP-South is hosted by the South African As-tronomical Observatory and we are grateful for their ongoing support and assistance. Funding for WASP
Figure 5. Rp vs. Teql, colour coded by mass, of all known
planets with 0.6 MJup< Mp<4.0 MJup. WASP-190b is dis-played including the error bars on the measured radius and temperature.
comes from consortium universities and from the UK’s Science and Technology Facilities Council. The re-search leading to these results has received funding from the European Research Council (ERC) under the FP/2007-2013 ERC grant agreement no. 336480, and under the H2020 ERC grant agreement no. 679030; and from an Actions de Recherche Concert´ee (ARC) grant, financed by the Wallonia-Brussels Federation. The Euler Swiss telescope is supported by the Swiss
National Science Foundation (SNF). TRAPPIST-South is funded by the Belgian Fund for Scientific Research (Fond National de la Recherche Scientifique, FNRS) under the grant FRFC 2.5.594.09.F, with the partici-pation of the SNF. M. Gillon and E. Jehin are F.R.S.-FNRS Senior Research Associates. We acknowledge use of the ESO 3.6-m/HARPS spectrograph under programs 0100.C-0847(A), PI C. Hellier, and 0102.C-0414, PI L. Nielsen. This work has made use of data from the European Space Agency (ESA) mission Gaia (https://www.cosmos.esa.int/gaia), processed by the GaiaData Processing and Analysis Consortium (DPAC,
https://www.cosmos.esa.int/web/gaia/dpac/consortium). Funding for the DPAC has been provided by national institutions, in particular the institutions participating in the Gaia Multilateral Agreement.
Facilities:
SuperWASP,ESO:3.6m(HARPS),Eu-ler1.2m(CORALIE), WASP-South, TRAPPIST, SPECU-LOOS
Software:
HARPS Data Reduction Software (Baranne et al.1996; Pepe et al. 2002), bagemass (Maxted et al. 2015), garstec (Weiss & Schlattl 2008), MKCLASS (Gray & Corbally 2014)
REFERENCES Albrecht, S., Winn, J. N., Johnson, J. A., et al. 2011, ApJ,
738, 50, doi:10.1088/0004-637X/738/1/50
Anderson, D. R., Temple, L. Y., Nielsen, L. D., et al. 2018, ArXiv e-prints. https://arxiv.org/abs/1809.04897 Baranne, A., Queloz, D., Mayor, M., et al. 1996, A&AS,
119, 373
Blackwell, D. E., & Shallis, M. J. 1977, MNRAS, 180, 177,
doi:10.1093/mnras/180.2.177
Bou´e, G., Montalto, M., Boisse, I., Oshagh, M., & Santos, N. C. 2013, A&A, 550, A53,
doi:10.1051/0004-6361/201220146
Brown, D. J. A., Triaud, A. H. M. J., Doyle, A. P., et al. 2017, MNRAS, 464, 810, doi:10.1093/mnras/stw2316 Bruntt, H., Bedding, T. R., Quirion, P.-O., et al. 2010,
MNRAS, 405, 1907,
doi:10.1111/j.1365-2966.2010.16575.x
Burdanov, A., Delrez, L., Gillon, M., & Jehin, E. 2018, SPECULOOS Exoplanet Search and Its Prototype on TRAPPIST, ed. H. J. Deeg & J. A. Belmonte (Cham: Springer International Publishing), 1–17.
https://doi.org/10.1007/978-3-319-30648-3 130-1 Burrows, A., Hubeny, I., Budaj, J., & Hubbard, W. B.
2007, ApJ, 661, 502, doi:10.1086/514326
Cegla, H. M., Lovis, C., Bourrier, V., et al. 2016, A&A, 588, A127, doi:10.1051/0004-6361/201527794 Claret, A. 2000, A&A, 363, 1081
—. 2004, A&A, 428, 1001, doi:10.1051/0004-6361:20041673 Collier Cameron, A., Bruce, V. A., Miller, G. R. M.,
Triaud, A. H. M. J., & Queloz, D. 2010a, MNRAS, 403, 151, doi:10.1111/j.1365-2966.2009.16131.x
Collier Cameron, A., Wilson, D. M., West, R. G., et al. 2007, MNRAS, 380, 1230,
doi:10.1111/j.1365-2966.2007.12195.x
Collier Cameron, A., Guenther, E., Smalley, B., et al. 2010b, MNRAS, 407, 507,
doi:10.1111/j.1365-2966.2010.16922.x
Crouzet, N., McCullough, P. R., Long, D., et al. 2017, AJ, 153, 94, doi:10.3847/1538-3881/153/3/94
Cutri, R. M., & et al. 2012, VizieR Online Data Catalog, 2311
Dai, F., & Winn, J. N. 2017, AJ, 153, 205,
doi:10.3847/1538-3881/aa65d1
Delrez, L., Gillon, M., Queloz, D., et al. 2018, in Society of Photo-Optical Instrumentation Engineers (SPIE) Conference Series, Vol. 10700, Society of Photo-Optical Instrumentation Engineers (SPIE) Conference Series, 107001I
Doyle, A. P., Davies, G. R., Smalley, B., Chaplin, W. J., & Elsworth, Y. 2014, MNRAS, 444, 3592,
doi:10.1093/mnras/stu1692
Enoch, B., Collier Cameron, A., & Horne, K. 2012, A&A, 540, A99, doi:10.1051/0004-6361/201117317
Enoch, B., Collier Cameron, A., Parley, N. R., & Hebb, L. 2010, A&A, 516, A33, doi:10.1051/0004-6361/201014326 Gaia Collaboration, Prusti, T., de Bruijne, J. H. J., et al.
2016, A&A, 595, A1, doi:10.1051/0004-6361/201629272 Gaia Collaboration, Brown, A. G. A., Vallenari, A., et al.
2018, A&A, 616, A1, doi:10.1051/0004-6361/201833051 Gillon, M. 2018, Nature Astronomy, 2, 344,
doi:10.1038/s41550-018-0443-y
Ginzburg, S., & Sari, R. 2015, ApJ, 803, 111,
doi:10.1088/0004-637X/803/2/111
Gray, R. O., & Corbally, C. J. 2014, AJ, 147, 80,
doi:10.1088/0004-6256/147/4/80
Hartman, J. D., Bakos, G. ´A., Bhatti, W., et al. 2016, AJ, 152, 182, doi:10.3847/0004-6256/152/6/182
Hellier, C., Anderson, D. R., Collier Cameron, A., et al. 2011, in European Physical Journal Web of Conferences, Vol. 11, European Physical Journal Web of Conferences, 01004
Henden, A. A., Levine, S., Terrell, D., & Welch, D. L. 2015, in American Astronomical Society Meeting Abstracts, Vol. 225, American Astronomical Society Meeting Abstracts #225, 336.16
Hirano, T., Suto, Y., Winn, J. N., et al. 2011, ApJ, 742, 69,
doi:10.1088/0004-637X/742/2/69
Jehin, E., Gillon, M., Queloz, D., et al. 2011, The Messenger, 145, 2
Kurokawa, H., & Inutsuka, S.-i. 2015, ApJ, 815, 78,
doi:10.1088/0004-637X/815/1/78
Kurucz, R. 1993, ATLAS9 Stellar Atmosphere Programs and 2 km/s grid. Kurucz CD-ROM No. 13. Cambridge, Mass.: Smithsonian Astrophysical Observatory, 1993., 13 Lund, M. B., Rodriguez, J. E., Zhou, G., et al. 2017, AJ,
154, 194, doi:10.3847/1538-3881/aa8f95
Maxted, P. F. L., Serenelli, A. M., & Southworth, J. 2015, A&A, 575, A36, doi:10.1051/0004-6361/201425331 Maxted, P. F. L., Anderson, D. R., Collier Cameron, A.,
et al. 2011, PASP, 123, 547, doi:10.1086/660007 Monet, D. G., Levine, S. E., Canzian, B., et al. 2003, AJ,
125, 984, doi:10.1086/345888
Pepe, F., Mayor, M., Rupprecht, G., et al. 2002, The Messenger, 110, 9
Pollacco, D., Skillen, I., Collier Cameron, A., et al. 2008, MNRAS, 385, 1576,
doi:10.1111/j.1365-2966.2008.12939.x
Pont, F., Husnoo, N., Mazeh, T., & Fabrycky, D. 2011, MNRAS, 414, 1278,
doi:10.1111/j.1365-2966.2011.18462.x
Queloz, D., Eggenberger, A., Mayor, M., et al. 2000, A&A, 359, L13
Queloz, D., Mayor, M., Udry, S., et al. 2001, The Messenger, 105, 1
Ricker, G. R., Winn, J. N., Vanderspek, R., et al. 2015, Journal of Astronomical Telescopes, Instruments, and Systems, 1, 014003, doi:10.1117/1.JATIS.1.1.014003
Ryu, T., Zingale, M., & Perna, R. 2018, MNRAS, 481, 5517, doi:10.1093/mnras/sty2638
Schlaufman, K. C. 2018, ApJ, 853, 37,
doi:10.3847/1538-4357/aa961c
Sestovic, M., Demory, B.-O., & Queloz, D. 2018, A&A, 616, A76, doi:10.1051/0004-6361/201731454
Skrutskie, M. F., Cutri, R. M., Stiening, R., et al. 2006, AJ, 131, 1163, doi:10.1086/498708
Southworth, J. 2011, MNRAS, 417, 2166,
doi:10.1111/j.1365-2966.2011.19399.x
Stassun, K. G., & Torres, G. 2018, ApJ, 862, 61,
doi:10.3847/1538-4357/aacafc
Stassun, K. G., Oelkers, R. J., Pepper, J., et al. 2018, AJ, 156, 102, doi:10.3847/1538-3881/aad050
Talens, G. J. J., Albrecht, S., Spronck, J. F. P., et al. 2017, A&A, 606, A73, doi:10.1051/0004-6361/201731282 Temple, L. Y., Hellier, C., Albrow, M. D., et al. 2017,
MNRAS, 471, 2743, doi:10.1093/mnras/stx1729 Temple, L. Y., Hellier, C., Almleaky, Y., et al. 2018,
MNRAS, 480, 5307, doi:10.1093/mnras/sty2197 Thorngren, D. P., & Fortney, J. J. 2018, AJ, 155, 214,
doi:10.3847/1538-3881/aaba13
Torres, G., Andersen, J., & Gim´enez, A. 2010, A&A Rv, 18, 67, doi:10.1007/s00159-009-0025-1
Triaud, A. H. M. J. 2017, The Rossiter–McLaughlin Effect in Exoplanet Research, ed. H. J. Deeg & J. A. Belmonte (Cham: Springer International Publishing), 1–27. https://doi.org/10.1007/978-3-319-30648-3 2-1 Weiss, A., & Schlattl, H. 2008, Ap&SS, 316, 99,
doi:10.1007/s10509-007-9606-5
Winn, J. N., Fabrycky, D., Albrecht, S., & Johnson, J. A. 2010, ApJL, 718, L145,
doi:10.1088/2041-8205/718/2/L145
Yadav, R. K., & Thorngren, D. P. 2017, ApJL, 849, L12,
doi:10.3847/2041-8213/aa93fd
Zhou, G., Bakos, G. ´A., Hartman, J. D., et al. 2017, AJ, 153, 211, doi:10.3847/1538-3881/aa674a