Contents lists available atScienceDirect
Sustainable Cities and Society
journal homepage:www.elsevier.com/locate/scsAdaptive approach of thermal comfort and correlation between
experimental data and mathematical model in some schools and traditional
buildings of Madagascar under natural ventilation
Modeste Kameni Nematchoua
a,⁎, Paola Ricciardi
a, Cinzia Buratti
baDepartment of Civil Engineering and Architecture, University of Pavia, Via Ferrata1, 27100 Pavia, Italy bDepartment of Engineering, University of Perugia, Via G. Duranti 63, 06125 Perugia, Italy
A R T I C L E I N F O Keywords:
Adaptive approach Thermal comfort Mathematical model
Schools and traditional buidings Tropical island
A B S T R A C T
A good ventilation is important to improve indoor air in buildings. In Sub-Saharan Africa regions and other countries, both health and productivity are indeed elements depending on indoor comfort. The purpose of this research is to suggest a new thermal comfort approach based on subjective responses of occupants and math-ematical models. There is a lack of data about indoor comfort in residential buildings in the tropical islands of Indian Ocean and the aim of the research is to propose guidelines for more comfortable constructions in Madagascar and other countries of the Indian Ocean. Experimental and subjective data were collected in 67 traditional habitats and 25 public and private schools, located in 25 districts of urban communes in the Northern Madagascar. Mathematical modelling was based on Rohles approach. At total of 992 questionnaires were col-lected and analysed during rainy and dry seasons. The results showed that traditional buildings were more comfortable than schools. Comfort temperature varied from 24.6 to 28.4 °C during both seasons in residences and schools. When the indoor air temperature varied in the 24.5–27.5 °C range, more than 80% of peoples were satisfied.
1. Introduction
Temperature often significantly varies in naturally ventilated buildings (Lu, Xia, Wei, Fang, & Qi, 2016). Natural ventilation is an important sustainable building design strategy, known to mankind for centuries (Fergus Nicol and Michael Humphreys, 2012;Lu et al., 2016). In some studies, it is recommended to improve indoor air for building natural ventilation (Nematchoua, Tchinda, Djongyang, & Ricciardi, 2014a) and, according to other researches, the energy consumption in building can be minimized, also by exploiting natural ventilation (De Dear, Brager, & Cooper, 1997). The results of surveys still depend of several parameters coming from studied place and the obtained data cannot always been extended to different regions (Fergus Nicol and Michael Humphreys, 2012). Thermal comfort heavily depends not only on environmental factors, but also on physical, physiological and psy-chological aspects (Fergus Nicol and Michael Humphreys, 2012). Thermal sensations and preferences of occupants are always different in a same environment (Nematchoua, Tchinda, Orosa et al., 2014) and a comfortable and healthy environment is a prerequisite (De Dear et al., 1997). The concept of thermal comfort is quite complex and varies according to each subject (CIBSE and CIBSE Guide A, 1999), however,
although many international standards define the range of comfort conditions, opinions still stand widely divided (Yau, 2008). Worldwide researchers are presently focusing on the energy efficiency of buildings (Nematchoua, Tchinda, & Orosa, 2014a).
Several Literature works testify the importance of the adaptive ap-proach.van der Linden, Loomans, and Hensen (2008), aiming to study the linkage between the predicted mean vote (PMV) and the adaptive thermal comfort (ATC) model, showed that, for a moderate outdoor climate as in The Netherlands, the PMV-approach is well able to explain the results derived from the ATC approach.Tan and Kosonen (2003), by studying many buildings in the tropical hot-and-humid climates, showed that the adaptive approach to thermal comfort is also suitable in tropical hot-and-humid climate, providing the means to determine the thermal comfort requirement of occupants.Halawa and van Hoof (2012)looked critically at the foundation and underlying assumptions of the adaptive model approach and itsfindings. They found that this new approach may take credit for widening the range of acceptable comfort temperature, which allows to obtain more energy savings in buildings.
Adaptive comfort concerns have already been introduced in ASHRAE Standard 55, but just as an option in certain conditions.Hong,
https://doi.org/10.1016/j.scs.2017.11.029
Received 9 August 2017; Received in revised form 16 October 2017; Accepted 21 November 2017
⁎Corresponding author.
E-mail address:[email protected](M.K. Nematchoua).
Available online 26 November 2017
2210-6707/ © 2017 Elsevier Ltd. All rights reserved.
D'Oca Yan, and Chen (2017)analysed some questions and suggested a method to improve energy savings and occupant behaviour in build-ings. The new methods suggested by the researchers allow to increase energy efficiency and to reduce energy use in residences. Karyono (2000), after a study in 596 offices in Jakarta, found that comfort conditions could be achieved without unnecessary cooling in air con-ditioned buildings. The research carried out in some schools by Nematchoua, Tchinda, and Ricciardi (2014)showed that the increase of air velocity is an essential phenomenon for obtaining thermal comfort. Jentsch, James, and Bahaj (2018), after several investigations carried out in an UK primary school, suggested that children have a different thermal perception than adults. Sullivan and Trujillo (2015) showed that in a given environment, when the air temperature is so high or very weak, a majority of occupants are uncomfortable. Other studies were applied in schools and buildings in several places with different cli-mates (Deuble and Johnde Dear, 2012; Fahmy and Sharples, 2009; Jensen, 2008;Lan, Wargocki, & Lian, 2011;Sekhar, 1995;Tablada, De Troyer, Blocken, Carmeliet, & Verschure, 2009; vander Lindena, Boerstra, Raue, & Kurvers, 2002;Wong and Khoo, 2003).
In Sub-Saharan Africa and Indian Ocean, some studies were carried out in thisfield (Nematchoua, Tchinda, Orosa et al., 2014;Nematchoua, Tchinda, Ricciardi et al., 2014;Nematchoua et al., 2014a;Nematchoua, Tchinda, & Orosa, 2014b;Noël, René, & Donatien, 2010;Noël, René, & Donatien, 2012;Ogbonna and Harris, 2008), but they need to be im-proved in order to allow the development of specific standards for these regions. Today, the modern buildings are in many cases built by means of imported materials. The choice of Madagascar as the place for this study was not carried out randomly. It is the biggest island of Indian Ocean and the 4th in the world. Madagascar, according to the World Meteorological Organization, is considered as the third-ranking country in the world that is most vulnerable to climate change. This change affects indoor air in buildings.
Madagascar is ranked among those countries that are rich in solar energy, with an estimated potential of around 2000 kWh/m2/year.
Madagascar’s largely rural population mainly depends on subsistence agricultural activities, which contribute to habitat degradation, espe-cially the loss of forests (Tadross, Randriamarolaza, Rabefitia, & Yip, 2008). Several areas of the island have over 2800 h of sunshine per year. According to the report of the Diagnosis of Energy Sector (Madagascar National Communication, 2004), Madagascar has a po-tential of over 2000 MW of wind power. The country fragility in the face of multiple climates and crossing cyclone motivates the population of the Northern Madagascar to build with temporary materials and with the cheapest on the market, generating uncomfortable residential buildings. The choice of traditional residences and schools as subjects of
the research is due to their excellence because they host people of different ages and from all parts of the country. Moreover, no in-vestigations on thermal comfort have been carried out previously in regularly-occupied buildings such as traditional habitats and schools in Indian Ocean with new adaptive approach, except for those in (Nematchoua, Ricciardi, Reiter, Asadi, & Demers, 2017;
Rakotondramiarana, Ranaivoarisoa, & Morau, 2015;
Razanamanampisoa, Randriamanantany, & Rakotondramiarana, 2018). The researches carried out this last decade in Sub-Saharan Africa had some limits: they were only referred to sedentary activity and to afixed range of thermal clothing insulation. It is important to study the action of physical parameters on the health and productivity of occupants. This study analyses the influence of gender, clothing, activities, parti-cipants’ mind state, and occupants’ control strategies on adaptive comfort assessment.
Physical measures were also carried out, while questionnaires were simultaneously distributed to the occupants. The analysis of the indoor air data gave some information about the studied environments. Furthermore, for studying the variation of the effect of indoor para-meters on the participants’ health and productivity, a statistical analysis of the subjective questionnaires was carried out. An adaptive approach to the thermal comfort assessment is necessary because of the growing interest in the energy performance of buildings related to the envelope characteristics and to the occupants’ satisfaction.
The overall purpose of the research is to create an important data-base on thermal comfort in Indian Ocean and to suggest another ap-proach of thermal comfort studies based on the analysis of the sub-jective responses of occupants and mathematical models, in order to suggest the development of a standard norm more suitable for these countries. Results could help building designers to be more efficient and to help the regions with similar climates to expand their database.
2. Materials and methods
2.1. The studied region
Located between 20°00S and 47°00E, Madagascar lies almost en-tirely within the tropical region. It has an area of 592.000 km2. The
island is separated from Africa by the Mozambique Channel by about 400 km. There are two main seasons in Madagascar: dry, from May to October, and rainy, from November to April. Two short seasons of ap-proximately 1-month duration separate these two seasons. From May to October, the climate is characterized by an anticyclone to the Indian Ocean, that directs a wind regime of trade winds from South-Eastern Madagascar. During this season, the eastern part of the island Nomenclature
ASHRAE American Society of Heating, Refrigerating and Air Condition Engineers
ATC Adaptive thermal comfort Icl Insulation (Clo)
M Metabolism(met)
MAX Maximum
Med Medium
Min Minimum
PMV Predicted mean vote PMVd Adaptive PMV
PMVq Predicted mean votefrom questionnaire Pv Air vapour partial pressure(pa) RH Relative humidity(%)
RHint Indoor relative humidity TAI Thermal acceptability index TC Comfort temperature
Temp Temperature(°C) Tint Indoor temperature Tu Uniform air temperature
Tr Mean radiant temperature
Trad.build Traditional building Tsens Thermal sensation
TWI Thermal preference index Va Air speech(m/s)
Greek symbols
βS Proportion of occupant having voted“comfortable”
α Slope
Subscripts
tn Neutral temperature
experiences a humid climate “in the wind”, while the western part undergoes a drought-like climate termed“down wind”. The study was conducted in the tropical city Antsiranana (Northern Region), (Fig. 1). Antsiranana is the largest city in Northern Madagascar and is the capital of the province of Diego-Suarez. Its population was estimated at 257,163 inhabitants in 2014. The town of Antsiranana is sheltered by the bay of Diego-Suarez (156 km of coast) the second port of the country. It is the second largest bay in the world after Rio de Janeiro. About 25 districts constitute the Urban Commune of Antsiranana, which extends over 47 km2. The town is bounded to the north by the
coves of the Dordogne and Melville, to the south and South-East by the plateau of Antanamitarana, to the east by the bay of the French, and to the west by the deltaic plain of Antomboko and the plateau of Cape Diego. Detailed characteristics of the studied area are reported in Table 1. Average rainfall of 12.4 mm makes the month of June the driest one, while in January rainfall is the highest in the year with an average of 204.9 mm.
2.2. Experimental campaign
An experimental campaign was carried out in 67 traditional habitats or residential buildings, and in 25 private and public schools, elemen-tary and high schools, located in 25 districts of the urban commune of Antsiranana. Most of the selected traditional habitats were older than 70 years; traditional houses were built using local materials, such as dry bamboo, red earth, straw leaf, enamelled iron, and sometimes using provisional materials. Their heights vary between 1.9 and 4.5 m. Most of the buildings have square or rectangular plans, and their roof are formed of dry straw leaves, more than 5 cm thick, with an inclination of 45 °C and, sometimes, covered by old rusted metal sheets (Fig. 2).
These types of habitats are mostly located in the peripheral quarters of the town and often grouped near the main road. Some of them in-clude sheet fences and earth block walls around. Other habitats are open to the public, allowing the indoor natural lighting during the day. These buildings have small verandas on the main faҫade that are used for rest and protection against sun and rain. The height or the length of
most of the doors are less than 1.77 m. In the majority of cases, the windows are on the main façade and oriented to North East, with a small area of about 0.12 m2. The provisional materials are similar to
wall, such as bamboo and plank.
The schools are mostly located in densely populated neighbourhood and close to roads. Most of them were built between 10 and 150 years ago, with plastered and painted walls and, sometimes, with earth block walls. InTable 2, the physical parameters evaluated for the different buildings are reported.
Traditional buildings are characterized by bamboo, steel sheets and planks, while schools are constructed with parpen bricks and earth block wall.
Data reported inTable 2show that the habitats with steel sheet material present the worst thermal performance while the ones with bamboo material present the highest thermal performance. In all the different studied schools, there were at least 50 students per classroom (Fig. 1b). During this study, for both schools and traditional houses, the occupants were not subjected to any constraints, except for the com-plete interruption of the cooling and heating systems. The study was conducted during the periods reported inTable 3.
2.3. Instruments and questionnaires
The maximum, minimum, and mean air temperature, relative hu-midity and air speed were measured by a probe thermometer, thermo-hygrometer and anemometer. All these parameters allow to char-acterize the studied physical indoor environments (ASHRAE, 2004). The characteristics of the instruments are reported inTable 4. Before each experimental campaign, the equipment was calibrated in order to ensure reliability and precision in the readings taken (Feriadi and Wong, 2004;Roaf, Fuentes, & Taylor, 2001;Wong et al., 2002).
The sensitive infrared thermometer allowed to detect the max-imum, minimum and mean temperature inside the wall. Some of the specific characteristics of this infrared thermometer are the espe-cially clear laser point; a wide range temperature and an adjustable emissivity (depending on the material). This device easily detects
the characteristics of objects at more than 10m.Measurements were taken every 5 min at a height of 1.5 m from the ground level, in strict compliance with the prescriptions of the ASHRAE Standard 55 and ISO 7730 Standard (UNI EN. ISO 7730, 2006). During the in-vestigations, physical measures were carried out, while the ques-tionnaires were simultaneously distributed, as suggested in (Brager and de Dear, 1998;De Dear, 2004; ;De Dear and Brager, 2001). The probes were installed far from heat sources, but next to strong people’s concentration. A total of 22 students were selected and trained to conduct the surveys. For each campaign,data was col-lected continuously from 8:00AM to 6:00 PM The measurements provided three of the six parameters of interest: air velocity, re-lative humidity, and air temperature inside the buildings. They were used in order to calculate the PMV and PPD indices, in com-pliance with Finger’s model. Just 30 min after the beginning of the lesson, both measurements and questionnaire distribution took place, in order to allow the students, villagers, and instruments to adjust to the environmental conditions.
The opinions and feelings of individuals were obtained by a careful analysis of questionnaires. They were developed in previous works (Buratti, Ricciardi, & Vergoni, 2013; Ricciardi and Buratti, 2012). A total of 992 questionnaires were collected during both seasons: 25 students for each of the 25 schools (625) and the re-maining in traditional buildings (367). Questionnaires were written in French and Malagasy language, which are the country official languages. The language preferences of the occupants were
considered while distributing questionnaires. The questionnaire was subdivided into two different parts: a section with the personal data (age and sex) and one about the thermal aspects (judgement about tolerability of thermal environment, air movement, tem-perature difference between head and ankle, activity performed in the last period, etc.). A synthesis of measured data is reported in Table 5.
2.4. Characteristics of the voters
The school inhabitants were young and more capable of an-swering the questionnaires than the buildings occupants. The height of the voters varied in the 1.41–1.65 m range in traditional buildings and in the 1.55 m–1.89 m range in schools. The weights ranged between 35 and 95 kg. The thermal clothes varied according to sex and age of the occupants, with an average thermal insulation of 0,86clo in schools and 0.92 clo in traditional buildings. The ac-tivity level varied according to seasons, but it was noticed more intense activities in traditional habitats than in schools. The main characteristics of the voters are reported inTable 6.
2.5. Mathematical models
The mean radiant temperature (Tr) was estimated using the
fol-lowing regression model, as function of the measured air temperature (Ta), proposed inDjongyang and Tchinda (2010):
Tr= 0.99Ta− 0.01, R2= 0.99 (1)
The operative temperature (To) was determined from the measured
air temperature (Ta) and the mean radiant temperature (Tr) by the
following relationship (De Dear and Brager, 2001):
To= A Ta+(1a− A) Tr (2)
where the weighting factor (A) depends on the air velocity(w). A = 0.5 for w < 0.2m/s;A = 0.6 for 0.2 < w < 0.6m/s; A = 0.7 for 0.6 < w < 1m/s.
Table 1
Some climatic characteristics of Antsiranana city.
City Latitude Longitude Altitude(m) Temp. (°C) RH(%) Wind Speed (m/s) precipitation (mm)
Max. Min. Max Min. Max min Max Min
Antsiranana 12°16′S 49°17′E 43.0 33.5 20.0 85.5 60.5 9.0 4.5 338.0 0.0
Fig. 2. An example of traditional habitat in Madagascar.
Table 2
Building thermal characteristics.
Building [Wall kind] floor area (m2) Windows surface (m2) thermal transmittance of wall (W/m2k) thermal transmittance of window(W/m2k) heatflux w/m2 position
Parpen brick 9.5–18.5 0.5–1.5 0.001–0.025 0.35–0.7 0.95−1.55 NE,SO
Earth block 11.5–14.5 0.2 1.5 0.07–0.55 0.15–1.5 2.5−5.5 NE, NO
Bamboo 9.5–13.5 0.0.3 0.21–0.75 0.12–0.7 2.1–9.3 SE, NE
Steel sheet 8.5–12.5 0.1–0.3 (1.5–2.8)*10-5 0.1–1.1 5.4–12.7 NO, NE
Plank 9.5–16.5 0.2–0.6 0.01–0.15 0.15–0.5 4.5- 10.5 SE, NO
Table 3 Periods of study.
Dry season Rainy season
city Time Month Years Time Month Year
Antsiranana Traditional habitat
3 weeks May–June 2016& 2017
1 week December 2016 School 2 weeks September 2016 1week November 2016
Thermal neutrality temperature (Tn) was defined as the optimal
temperature in order to guarantee the best comfort conditions (ASHRAE, 2004). It could be an useful tool in order to quickly estimate thermal comfort. The surveyed conditions could be considered in the comfort zone, assuming 80% of satisfied persons as a good design target. Some researches (ASHRAE, 2004) showed that it is possible to estimate Tn, adapted PMV and Tsensunder basic of several formulas in
the Literature, including the results of physical measurements and questionnaires. By means of the calculated Tndata, a correlation
be-tween Tnand operative temperature (To) was found (Mui and Chan,
2003):
Tn= 0.7677To+ 4.5842 (3)
Furthermore, the Neutral Temperature was correlated to the External Temperature Te, by means of the following equation:
Tn= 0.1544Te+ 19.3520, with a good correlation (R2= 0.56). (4)
Adapted PMV (PMVd) was estimated by means of the following
Rohles equation (Rohles, 1971):
PMVd= aTa− bPva− c (5)
in which T is the air temperature, Pvis the air vapour pressure
(which could be calculated by means of the relative humidity), and a, b, and c are coefficients calculated by the authors inBuratti et al. (2013), which depend on sex (male or female) and thermal clothing insulation. The Rohles model was only valid in the 0–0.5 clo range of thermal insulation of clothing; nevertheless, the new coefficients associated to the model developed inBuratti et al. (2013)could be employed with Iclvarying in the 0.25–1.65 clo range.
The thermal sensation air temperature (Tsens) was calculated
ac-cording toNematchoua et al. (2014b). It is described by the following
equation:
Tsens= 0.407·Ta− 9.855, R2= 0.937 (6)
3. Results and discussions
Approximately 1100 questionnaires were distributed in 25 schools and 67 traditional habitats in 25 districts situated in the Northern part of the island, but only the 90.2% (992) of the ques-tionnaires were collected and analysed. The 37% of the 992 re-ceived questionnaires were collected in traditional residences and the 63% in schools. It was very difficult to retrieve all ques-tionnaires distributed in the study site, because of the high density of students per classroom. The low response rate (37%) for tradi-tional habitats was due to motivation's lack of villagers, most of them require a salary at the end of survey. In total, the 9.8% (108) of the questionnaires distributed were not recovered from voters. Before suggesting an adaptive approach, it was very important to understand the voter responses to their environment. With this purpose, in the next sub-paragraph, statistics of the subjects of re-sidential occupants and personal thermal variables were analysed.
3.1. Subjective approach
3.1.1. Habitat and personal data
In this study, the voter ages varied from 15 to 75 years (Fig. 3a). Among the voters, the 69.9% (male) and the 22.2% (female) have an age in the 15–24 years range and the 14.2% (male) and the 13.4% (female) an age in the 24–34 years range. In addition, the 4.4% (male) and the 1.5% (female) have an age in the 55–64 years range while no voter's female were in the 65–75 years range, but only the 1.8% (male). It may be concluded that more than the 80% of voters were young people.
The construction period of each studied place is indicated in Fig. 3b. No school built between 0 and 9 years ago were in-vestigated, while the 36.4% of traditional residences, the 31.8% of traditional habitats and the 3.5% of schools were built in the 20–29 years ago range. The 3.1% of traditional habitats and in mean the 12.5% of both were built from 50 to 59 years ago. No one of the studied traditional habitats was more than 70 years old, while the 31.6% of schools were more than 60 years old. According to pre-vious researches (McCartney and Nicol, 2001;Nicol and McCartney, Table 4
Characteristics of the measurement system.
EMC 50081-1(model) Function Range Resolution Accuracy
Infrared thermometer Temperature -50 to + 1000 ºC 0.1ºC ± 1.5 % ± 0.2 °C Thermo-hygrometer Temperature 0–50 °C 0.1 °C ± 0.5 °C Humidity 0.1% to 99.9% 0.10% ± 3% (10–90%) Anemometer Model:DA01 Wind speed 0 to 30 m/s 0.1 m/s ± 5% Temperature -10 to 45 °C 0.2 °C ± 2 °C Table 5
Synthesis of measured data in traditional residential buildings and schools. Traditional residences Schools
Parameters Min Max Min Max
Tint[°C] 20.5 31.5 20.7 32.4
RHint[%] 45.5 77.5 51.5 70.5
Va [m/s] 0.0 1.0 0.0 0.65
Pv [pa] 1869.5 2104.6 1721.7 2506.6
Table 6
Characteristics of the voters.
Occupants Height(m) Weight(kg) Icl(Clo) M(met) Age
M F T Min Med Max Min Med Max Min Med Max Min Med Max Min Med Max
Trad.build. 137 230 367 1.41 1.59 1.65 55 60.5 95 0.5 0.92 1.5 1 1.1 1.2 18 38 64
Schools 250 375 625 1.55 1.65 1.89 35 59 79 0.4 0.86 1.45 1 1 1.1 14 18 25
1999), the voters’ age and the building construction period can be two precious parameters to be taken into account in the results analysis of thermal comfort.
3.1.2. Thermal acceptability (TAI) and thermal preference (TWI) In this study, the thermal acceptability index (TAI) is defined as the ratio of persons who consider acceptable to the total number of persons who express an evaluation, and thermal preference index (TWI)as the ratio of persons who want to change to the total number of persons who express an appreciation for the environment, such as reported inBuratti and Ricciardi (2009).
According to the analysis carried out byLu et al. (2016), it was found that the thermal sensation varied in function of voters sex. Data showed inFig. 4confirm this result: in the schools no males voted“cold”, as thermal acceptability and only the 6.9% of females voted this index. The 35.7% of males and the 42.5% of females indicated“neutral” during both seasons. The 15.5% and the 27.4% of males voted " slightly warm and warm”, respectively Further-more only the 3.4% and the 17.2% of females indicated the same sensation. Generally, the 11.1% of persons voted “hot”. On the other hand, in traditional habitats, no voters indicated “cold” for the thermal environment; however, the 6.4% of males, were voting “cool” and the 60.5% of females were sharing the same feeling during both seasons. The 8.5% of occupants voted“slightly warm”, while the 35.4% of males and 23.6% of females were voting “warm”. Taking into account both sex, approximately the 52.8% found the environment neutral, the 4.5% cool and the 29.6% warm during the two seasons. These results are almost the same as those obtained by Djongyang and Tchinda (2010) in North Cameroon, where they found that the 52.5% of occupants indicated that their residence was neutral during the studied period.
FromFig. 5, it appears that in traditional residences, when in-door air temperature varies in the 20–21.9 °C and in the 22 °C–23.9 °C ranges, no occupants wanted a “cooler” sensation. The 33.4% and the 100%,preferred no changes, while the 66.7% and the 0,4% of occupants voted, as thermal preference,“warmer”
in the same environment for habitats and schools respectively. In addition, in the 24–25.9 °C range, the 24.3%, the 67.6%, and the 8.1% of occupants wanted” cooler”, “no change”, and “more warm” respectively. In the 28 °C–30 °C range, the 90% and the 10% of in-habitants voted again“cooler” and “warmer” as thermal preference during both seasons. However, in schools (Fig. 5b), in the 20 °C–22 °C range, the 66.7% voted “warmer”, the 16.7% voted “cooler and no changes”, otherwise the 25.6%, the 58.1%, and the 16.3% voted as thermal preference “cooler”, “no change” and “warmer”, respectively. These results confirm that in both studied places, when air temperature is in the 24–26 °C range, more than the 60% of voters wanted as thermal preference“no changes”, while when temperature is more than 28 °C, the 75% of occupants were preferring “cooler” for their environment. These findings confirm the results found in the Literature (Buratti and Ricciardi, 2009; Ricciardi and Buratti, 2012),which showed that thermal preference of people varies according to temperature. A great difference re-garding the people’s feelings can be due to activity level and clothing in this place. Data are reported inTable 7.
3.2. Adaptive approach
Before comparing the results obtained for traditional residences and schools, it was important to perform a Chi-square test or a t-test. The Chi-square test can be used to evaluate or to compare two groups (or two measures) and to easily take the best possible de-cision (Boslaugh, 2012; Lehmann and Romano, 2005). Generally, when the Chi-square test is applied for an analysis and a comparison of the results obtained in both the studied places, it allows to confirm whether they provide similar results or not and if there is a big discrepancy. All the statistical analyses were carried out by means of IBM SPSS 24.0 Statistical software. The 95% of confidence level (CL) assessed as level of significance was equal to 5%,which is majority used in t-test applications. The software allows to freely take, the value of the significance interval (called the p-value). Results are reported inTable 8.
The test is significant for p < 0.05 (5%),as above explained: in our case study, (p-value) is equal to 0.026. Thus it can be concluded Fig. 3. voter ages (a) and construction period of studied habitats and schools
(b).
Fig. 4. Occupants’ thermal sensation during both seasons in schools(a) and traditional habitats(b).
that thermal and indoor air sensations of the occupants are different in the two studied places. These discrepancies can be due to the strong activities in traditional habitats. Clothing and construction materials can also have a significant effect on heat transfer. 3.2.1. People and indoor climate
Fig. 6shows the variation of Predicted Mean Vote (PMV) with the mean indoor temperature in traditional habitats and schools. Linear regression was used for the equations(6)and(7), as reported in another study (Kuchen and Fisch, 2009). Good correlations (R2= 0.72 and
R2= 0.61) were found between the predicted mean vote (PMV) and the indoor air temperature (Ta):
PMV = 0.173 Taa− 4.252, R = 0.85 in schools (6)
PMV = 0.141Taa− 3.332, R = 0.78 in traditional buildings (7)
Correlations between Taand PMV could also be evaluated good if
regarding the main importance that mental and behaviour parameters have when data are coming from response to questionnaires (see Fig. 6).
When the air temperature was in the 21.1–35.5 °C range, the Predicted Mean Vote varied in the−1.5 to + 2.2 range in traditional buildings and in the−1 to +1.9 in schools. For PMV = 0, the neutral temperature was around of 24.57 °C in schools and 23.65 °C in tradi-tional habitats.
According to the Literature review, it is possible to estimate the comfort temperature when more than 80% of occupants find the environment comfortable (De Dear et al., 1997). The experimental PMV values indicated that the thermal neutrality range is much higher than the one suggested by the direct votes. This seems to confirm the opinions by previous scientists regarding the restric-tions of the PMV for predicting thermal comfort in naturally- ven-tilated residences (Nicol, 2004). In the Literature, it is important to notice that several adaptive comfort models were developed during the last two decades (Nguyen, Singh, & Reiter, 2012;Nguyen and Reiter, 2014a).
The following model defines the indoor comfort temperature (TC) as a linear function of the indoor air temperature found in this study, as showed inFig. 7; the following equations were found:
TC= 0.286Ta + 18.86, R = 0.58 in school (8)
TC= 0.250 Ta + 19.6, R = 0.78 in traditional residence (9)
This model was based on data collected within this region. When the indoor air temperature was in the 23.5–35.2 °C range, the comfort temperature was varies in the 24.6–27.6 °C range in traditional habitats and in the 24.9−28.4 °C in schools. This result shows that the comfort temperature is higher in schools than in traditional habitats. The thermal neutrality temperature is around of 25.3 °C in both the studied places and during both the rainy and dry seasons.
Fig. 5. Occupants’ thermal preference as a function of air temperature values in habitats(a) and schools(b).
Table 7
summary of TAI and TWI. Traditional buildings Schools
Male Female both Male Female both
Number of questionnaires 137 230 367 250 375 625
Average age 41 35 38 18 18 18
TAI 45.1 60.5 52.8 35.7 48.2 41.9
TWI 16.7 33.2 25.4 16.7 25.5 21.2
Table 8
Results of Chi-square tests in traditional residences and schools.
Datasets value df asymp. Sig.(2-sided)
Pearson chi-square 66.500a 60 0.026
Likelihood ratio 46.168 60 0.905
Linear-by-linear association 0.973 1 0.324
Superscript (a) indicates that it is RC table Chi-Square Test,aCorrelation is
significant at the (P < 0.05), level (2-tailled) .
Fig. 6. The variation of PMV with mean indoor temperature in both seasons.
Fig. 7. The comfort temperature as function of the mean indoor temperature in both seasons.
According to field surveys conducted over a wide range of buildings and countries, it was found that the comfort temperature is closely correlated to the outdoor or indoor temperature. A similar result was found analysing the collected data throughout the year from a particular group of surveys in Pakistan and Europe (McCartney and Nicol, 2001;Nicol, Raja, Allaudin, & Jamy, 1999). At the time of the break between 12.00 and 2:00 PM, the comfort temperature was almost similar in all the schools and residences; it could be due to the absence of activity during these times.
As an example of how effectively adaptive actions can be used to achieve comfort,Fig. 8shows the percentage of comfortable sub-jects (PMV = 0) among students and inhabitants in Madagascar (Antsiranana) at different indoor temperatures. Data were collected over dry and rainy seasons when the comfort temperature was continually changing, as it was the indoor temperature. Several good correlations (R2= 0.82 and R2= 0.79) between the
percen-tage of occupants who found the environment comfortable, and the mean indoor air temperature are given in Eqs.(10)and(11). βS=− 0.019 T2a + 1.014 Ta− 12.52, R = 0.91 in schools (10)
βS=− 0.013 T2a + 0.712Ta− 8.347, R = 0.89 in traditional
buildings (11)
where βSis the proportion of occupant having voted “comfortable”
their environment.
These curves show the mean probability of comfort calculated using the regression method. Each point represents the percentage of comfort conditions in a particular place and during a given day (Fergus Nicol and Michael Humphreys, 2012).
With a continually changing indoor temperature and comfort tem-perature, Antsiranana residences were found comfortable at tempera-tures Taranging between 25.1 and 27.6 °C (comfort range for at least
80% acceptability). It was also noticed that on many studied places, the occupants recorded no discomfort. This result was almost similar to the ones byNicol and McCartney (1999), who found when air temperature is in the 23–26 °C range, more than 80% of voters estimated the en-vironment comfortable.
The next sub-section has the aim to study the relation between PMV from questionnaires and adaptive PMV, in order to understand the difference between voters opinion.
3.2.2. People and adaptive temperature
InFig. 9, the difference between operative temperature (to) and
neutral temperature (tn) versus PMV (PMVq) from questionnaire for
male and female in schools and traditional habitats or the re-spondents’ thermal sensation was investigated. Three linear equa-tions (from 12 to 14) were obtained, with significant correlations. In traditional buildings, it was noticed that all the correlation lines between both sex have the same slope (α = 0.486) and similar coefficient (R2= 0.79):
PMVq = 0.918 (to-tn) + 0.13, R = 0.93 for female students (12) PMVq = 0.629(to-tn) + 0.20, R = 0.95 for male students (13) PMVq = 0.486(to-tn) + 0.31, R = 0.89 for traditional occupants
(both male and female) (14)
PMVq varied in the−1.5 to +1.5 range, while (toa− tn) were in
the−2 to +2.5 range. When to= tn, PMVq was expected to be very
low or zero and people should feel neutral and wanted no change on thermal preference. However, when the neutral temperature is higher than the operative temperature, people should feel cold or sometimes slightly cool, and therefore PMVq is expected to be ne-gative. Vice-versa in the case of tn< to, people should feel hot or
slightly warm and wanted their environment to be cooler. In this condition, PMVq is expected to be positive. These results are in agreement with those found byRicciardi and Ziletti Buratti (2016),
who demonstrated that thermal preference and thermal sensation of inhabitants in residential buildings varied according to to and tn.
The neutral temperature(tn), is one of the parameters depending on
the studied environment and De Dear and Brager (2000) showed that the adaptation's behavioral mechanism can directly act on the thermal balance of human body, because of personal comfort given to this one.
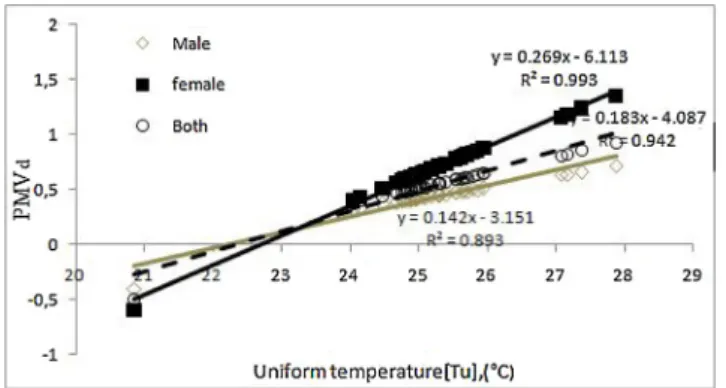
Adaptive PMV (PMVd) as function of the uniform temperature is shown inFig. 10. The different values of PMVd were estimated on the basis of the equation given inBuratti et al. (2013), with clothing re-sistance from 0.51 to 1.00. The following equations were obtained in this study, that will allow to improve the Literature with a new data base:
PMVd= 0.269 Tua− 6.115, R = 0.99 female (15)
PMVd= 0.142 Tua− 3.141 R = 0.94 male (16)
PMVd= 0.183 Tua− 4.087, R = 0.97 both (17)
For uniform air temperature Tuin the 20.5–29.0 °C range, the
ob-tained adaptive PMV varied in the−0.61 to +1.40 and in the −0.41 to +0.8 ranges, for females and males respectively. For PMVd= 0,
(neutral environment),uniform neutral temperature was around 23.0 °C for both genders.
In addition, Fig. 11 shows the adaptive PMV versus equivalent uniform temperature in both seasons. The equivalent uniform tem-perature was obtained according to (ASHRAE, 2004; Ricciardi and Buratti, 2012). For both genders, the following equation was obtained:
PMVd = 0.161Tuea− 3.587, R = 0.79 (18)
When PMVd = 0, the equivalent uniform neutral temperature was about 22.5 °C. When equivalent uniform temperature varied in the18.5–22.1 °C range, people should feel cold and therefore PMVq is expected to be negative. On the other hand, in the 27.9 °C–31.5 °C range, people wanted colder environments, because indoor air was in-tolerable in residences.
In the Literature several studies (Buratti, Palladino, & Ricciardi, 2016;Nematchoua et al., 2015;Nguyen and Reiter, 2014b;Ricciardi and Buratti, 2015) showed that at a certain threshold temperature (greater than 30 °C), voters preferred their environment to be colder.
Correlation between adaptive PMV (PMVd) and PMV from ques-tionnaires (PMVq) in traditional buildings and schools are given in Figs. 12 and 13, with clothing resistance in the 1.01–1.40 clo range. In traditional residences, for PMVq values in the−1.0 to +2.5 range, PMVd, oscillated in the 1.1–2.1 range. The following equations were obtained forum stable indoor temperatures:
PMVd= 0.048(PMVq)2+ 0.050 (PMVq) + 1.621, R = 0.72 for male
(19) PMVd= 0.0 38(PMVq)2+ 0.126(PMVq) + 1.292, R = 0.54 for female
Fig. 8. The percentage of occupants who were comfortable at different indoor temperatures in both studied places during the two seasons.
(20) PMVd= 0.042(PMVq)2+ 0.041 (PMVq) + 1.493, R = 0.67 for both
(21) In fact, during the dry season (June), PMVq varied in the 0.5–2.5 range for both genders, while PMVdwas in the 1.3–1.8 and in the
1.5–2.1 ranges for females and males respectively. In these conditions, the 81.5% of voters found the environment warm and would prefer a more neutral one. However, in rainy season (December), PMVq varied in the −1.0 to 1.5 range for both genders, while PMVd was in the 1.1–1.5 and in the 1.3–1.8 for females and males respectively. When PMVq =−0.5, PMVd was 1.6 (females) and 1.2 (males); when
PMVq = 0, PMVd increased up to 1.63 (males) and 1.29 (females). In these conditions, the 44.5% of occupants were voting “warm” and
wanted a neutral environment.
From these results, it can be concluded that the adaptive PMV coming from mathematical models and subjective response of questionnaire (PMVq) varied in the same direction. On the other
hand, in school, PMVdvaried in the−0.5 to 1.5 range, while PMVq
was oscillating from−2 to +2. For PMVq= 0, PMVdwas expected
to be positive during both seasons. Generally, experimental results still depend on environmental climate. Exceptionally in this study, somefindings were similar to results found byBuratti et al. (2013), who showed that PMVqwas within−1 to +2 range, corresponding
to the +0.45 to +0.50 range for PMVd. A great discrepancy was
often noticed between objective results derived from measurements (PMVd) and subjective ones from questionnaires (PMVq). It explains
why the sensation of neutral comfort is often majority in ques-tionnaire answers, in comparison with the objective experimental results.
Thermal sensation (Tsens) was obtained from the questionnaires
and other environment parameters, which allowed to obtain Fig. 9. PMV from questionnaires (PMV q) as function of the difference between
operative temperature and thermal neutral temperature (analytical method) for males and females in both seasons.
Fig. 10. Adaptive PMV(PMVd) versus uniform temperature during both per-iods.
Fig. 11. Adaptive PMV versus equivalent uniform temperature during both periods.
Fig. 12. Correlation between Adaptative PMV(PMVd) and PMV from ques-tionnaire(PMVq) in traditional buildings.
Fig. 13. Correlation between Adaptative PMV and PMV from questionnaire in Schools.
Fig. 14. Thermal sensation temperature versus operative temperature in tra-ditional residences and schools.
Fig. 14, where the thermal sensation temperature was plotted versus operative temperature in traditional residences and schools during both seasons. By fixing relative humidity in the 55–75% range and air speed in the 0.15–0.55 m/s range, it is very inter-esting to notice that almost the same slope (around α = 0.2) and good correlation coefficients (R2
= 0.88 and R2= 0.76)were ob-tained. The following equations were applied:
Tsens= 0.28 Toa− 7.006, R = 0.94 in School (22)
Tsens= 0.22 Toa− 5.316, R = 0.87 in traditional (23)
In these equations, the good correlation can explain that there was not a great discrepancy between objective results, derived from mea-surements, and subjective ones, from questionnaires.
Clothing insulation is always the most difficult factor to be es-timated in any field of investigation, due to the wide variety of clothing models and, consequently, it cannot be accurately esti-mated, in accordance with the clothing index tabulated by the ASHRAE and ISO standards (ASHRAE, 2004; UNI EN. ISO 7730, 2006). For values in the 0.51–1.50 clo range, the different Tsens
obtained values varied from−0.47 to 1.13, with the average op-erative temperatures ranging from 22.4 °C to 28.5 °C in traditional residences and from −0.12 to 1.58 with the average operative temperatures ranging from 23.5 °C to 29.5 °C in schools. For Tsens= 0, the neutral temperature obtained in traditional buildings
during both seasons was 24.5 °C, while in schools it was about 25.1 °C. With an operative temperature greater than 28 °C, Tsenswas
almost identical in schools and residences during rainy season. Si-milar results were found byNematchoua et al. (2014b), who found that when the different Tsensvalues obtained vary from−2.03 to
2.05, the average internal temperatures range from 16.5 °C to 28.5 °C in the tropical wet warm climate of Douala.
3.2.3. People and the outdoor air temperature
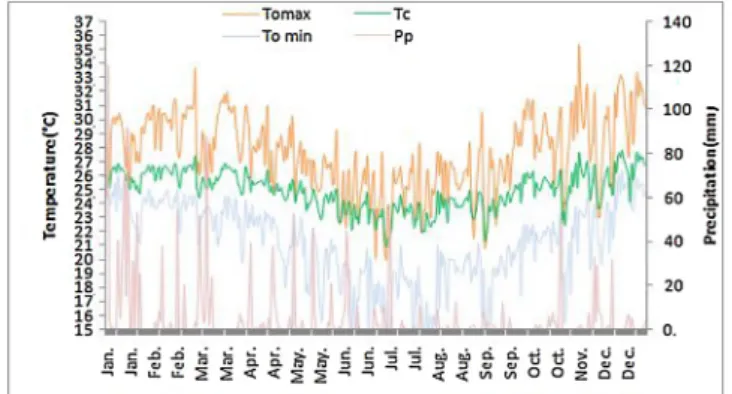
The adaptive relationship between comfort temperature and the outdoor air temperature can be used for designing comfortable buildings. An example is shown in Fig. 15. It was noticed an in-stability of minimum, maximum, and comfort temperature. The trend of rainfall is also reported on the samefigure. It was noticed that rainfall varied in the 0–120 mm range, when comfort tem-perature was in the24.5−27.5 °C range.
Globally, in this study, it was found that more than 80% of vo-ters have an age between 15 and 35 years. This can explain why, during the two seasons, more than 50% of occupants voted “neu-tral” as thermal sensation. It was saw that occupant’s thermal pre-ference varied according to studied place. Some researchers (such as Nicol and Cartney (Nicol and McCartney, 1999)) showed that the occupant’s age and number of years spent in a dwelling can affect
thermal sensation and thermal preference of occupants.Roaf et al. (2001) showed that it is important to establish the relationship between outdoor and comfort temperature. In a previous study carried out in Cameroon, results confirmed that the comfort tem-perature ranged between 23 °C and 28 °C (Nematchoua et al., 2014a). Several researches considered by ASHRAE (ASHRAE, 2004) found that the comfort temperature is between 23 °C and 26 °C. In this study, the comfort temperature was between 25.1 and 27.6 °C. All these above conclusions showed that comfort zone varied as function of the studied place. The thermal comfort range allows the selection of materials regarding micro-climate of environment. This choice is very important, keeping in mind the health and pro-ductivity of occupants in an environment. The experimental and simulation data can help the architects to build more modern buildings, with weak energy consumption. It is very interesting to note that the thermal modelling of the buildings could be useful to find solutions on how to manage the heat flux, so that the building performs better.
These results contribute to the advancement of the research because they propose a database on thermal comfort in an area that does not yet have a reliable construction standard.
4. Conclusion
In this study, an adaptive approach based on the analysis of questionnaires and mathematical models was applied, in order to evaluate thermal comfort in Madagascar. The experimental study was conducted in 67 traditional buildings and 25 schools in tran-sition tropical climate of Indian Ocean. Some linear equations were obtained with significant correlations. The correlations could be evaluated good if considering the great importance that behaviour and mental parameters have when data are coming from ques-tionnaires. The adaptive approach to thermal comfort reveals the new conditions of environment. It’s interesting to study thermal comfort using adaptive approach because this method gives new results coming from studied environment. The variation of the air temperature has always significant effects on people’s feeling, for example in this study, at more than 28 °C, the 75% of occupants preferred their environments to be “cooler”. In this case, people should feel warm and therefore PMVq is expected to be positive.
The votes given in the questionnaires vary always in a wider range of values with respect to the measured data, due to the per-sonal sensation.PMV from questionnaires varied from 0.5 to 2.5 for both studied places (traditional buildings and schools), while the adaptive PMV was in the 1. 3–1.8 range for females and in the 1.5–2.1 range for males. In these conditions, the 81.5% of voters found their environment warmer and preferred a neutral environ-ment. Sometimes, when the operative temperature is equal to the neutral temperature, PMVq was expected to be very low or zero and people should feel neutral.
The results of the present can be useful for the development of sustainable standards for indoor climate for buildings in the future in several islands in the Indian Ocean.
Conflict of interest statement
The authors disclose any relevant associations that might pose a conflict of interest.
Acknowledgment
The authors of this article acknowledge the Centre for International Cooperation and Development (CICOPS). Project for their support in this work.
Fig. 15. The seasonal changes in mean comfort temperature TC in Antsiranana and its relation to mean daily maximum, minimum outdoor temperatures and precipitation.
References
ASHRAE (2004). ANSI/ASHRAE standard 55R,‘Thermal environmental conditions for hum occupancy’. Atlanta: American Society of Heating, Refrigerating and Air-Condition Engineers Inc.
Boslaugh, S. (2012). 2nd ed. Statistics in a nut shell. O’Reilly Media, Inc.
Brager, G. S., & de Dear, R. J. (1998). Thermal adaptation in the built environment: A literature review. Energy and Building, 27(1), 83–96.
Buratti, C., & Ricciardi, P. (2009). Adaptive analysis of thermal comfort in university classrooms: Correlation between experimental data and mathematical models. Building and Environment, 44, 674–687.
Buratti, C., Ricciardi, P., & Vergoni, M. (2013). HVAC systems testing and check: a sim-plified model to predict thermal comfort conditions in moderate environments. Applied Energy, 104, 117–127.
Buratti, C., Palladino, D., & Ricciardi, P. (2016). Application of a new 13-value thermal comfort scale to moderate environments. Applied Energy, 80, 853–866.
CIBSE, & CIBSE Guide A (1999). The chartered institution of building services engineers. London: Yale Press.
De Dear, R. J., & Brager, G. S. (2000). A standard for natural ventilation. ASHRAE Journal, 42(10), 21–28.
De Dear, R., & Brager, G. S. (2001). Theadaptivemodelofthermalcomfortandenergy con-servationinthebuiltenvironment. IntJBiometeorol, 45(2), 100–108.
De Dear, R., Brager, G., & Cooper, D. (1997). Developing an adaptive model of thermal comfort and preference. Final Report—ASHRAE Project RP 884.
De Dear, R. (2004). Thermal comfort in practice. Indoor Air, 14(7), 32–39.
Deuble, M. P., & Johnde Dear, A. R. (2012). Mixed-mode buildings: A double standard in occupants’ comfort expectations. Building and Environment, 54, 53–60.
Djongyang, N., & Tchinda, R. (2010).‘An investigation into thermal comfort and re-sidential thermal environment in an intertropical sub-Saharan africa region: Field study report during the harmattan season in Cameroon’. Energy Conversion and Management, 51(7), 1391–1397.
Fahmy, M., & Sharples, S. (2009). On the development of an urban passive thermal comfort system in Cairo-Egypt. Building and Environment, 44, 1907–1916.
Fergus Nicol, J., & Michael Humphreys, M. A. (2012). Adaptive thermal comfort and sustainable thermal standards for buildings. Energy and Buildings, 45–59.
Feriadi, H., & Wong, N. H. (2004). Thermal comfort for naturally ventilated houses in Indonesia. Energy and Buildings, 36, 614–626.
Halawa, E., & van Hoof, J. (2012). The adaptive approach to thermal comfort: A critical overview. Energy and Buildings, 51, 101–110.
Hong, T., D'Oca Yan, S. D., & Chen, C.-F. (2017). Ten questions concerning occupant
behavior in buildings: The big picture. Building and Environment, 114, 518–530.
Jensen, J. O. (2008). Measuring consumption in households: Interpretations and strate-gies. Ecological Economics, 68, 353–361.
Jentsch, D. T. M. F., James, P. A. B., & Bahaj, A. B. S. (2018). Field study on thermal comfort in a UK primary school. Proceedings of 7th Windsor Conference: The changing context of comfort in an unpredictable world Cumberland Lodgehttp://nceub.org.uk.
Karyono, T. H. (2000). Report on thermal comfort and building energy studies in Jakarta–Indonesia. Building and Environment, 35, 77–90.
Kuchen, E., & Fisch, M. N. (2009). Spot monitoring: Thermal comfort evaluation in 25 office buildings in winter. Building Environ, 44, 839–847.
Lan, L., Wargocki, P., & Lian, Z. (2011). Quantitative measurement of productivity loss due to thermal discomfort. Energy and Buildings, 43, 1057–1062.
Lehmann, E. L., & Romano, J. P. (2005). Testing statistical hypotheses. Springer.
Lu, S., Xia, H., Wei, S., Fang, K., & Qi, Y. (2016). Analysis of the differences in thermal comfort between locals and tourists and genders in semi-open spaces under natural ventilation on a tropical island. Energy and Buildings, 129, 264–273.
Madagascar National Communication (2004). République de Madagascar. Communication nationale initiale de Madagascar. Convention Cadre des Nations Unies sur les Changements Climatique. Madagascar: Ministère de l‘Environnement, des Eaux et des Forets [Available at: unfccc.int/resource/docs/natc/mdgnc1. pdf, 1(124).].
McCartney, K. J., & Nicol, J. F. (2001). Developing an adaptive control algorithm for Europe: results of the SCATS project. Paper to this conference.
Mui, K. W. H., & Chan, W. T. D. (2003). Adaptive comfort temperature model of air-conditioned buildingin Hong Kong. Building and Environment, 38, 837–852.
Nematchoua, M. K., Tchinda, R., & Orosa, J. A. (2014a). Thermal comfort and energy consumption in modern versus traditional buildings in Cameroon: A questionnaire-based statistical study. Applied Energy, 114, 687–699.
Nematchoua, M. K., Tchinda, R., & Orosa, J. A. (2014b). Adaptation and comparative study of thermal comfort in classrooms and buildings naturally ventilated in west tropical zones. Energy and Buildings, 85, 321–328.
Nematchoua, M. K., Raminosoa, C. R. R., Mamiharijaona, R., René, T., Orosa, J. A., & Elvis, W. (2015). Study of the economical and optimum thermal insulation thickness for buildings in a wet and hot tropical climate: Case of Cameroon. Renewable and Sustainable Energy Reviews, 50, 1192–1202.
Nematchoua, M. K., Ricciardi, P., Reiter, S., Asadi, S., & Demers, C. M. H. (2017). Thermal comfort and comparison of some parameters coming from hospitals and shopping centers under natural ventilation; A Case of Madagascar island. Journal of Building Engineering, 13, 196–206.
Nematchoua, M. K., Tchinda, R., Djongyang, N., & Ricciardi, P. (2014). Afield study on thermal comfort in naturally-ventilated buildings located in the equatorial climatic region of Cameroon. Renewable and Sustainable Energy Reviews, 39, 381–393.
Nematchoua, M. K., Tchinda, R., & Ricciardi, P. (2014). Thermal Comfort and Air Movement preference in some classrooms in Cameroun. Revue Des Energies Renouvelables, 17, 263–278.
Nguyen, A.-T., & Reiter, S. (2014a). Passive designs and strategies for low-cost housing using simulation-based optimization and different thermal comfort criteria. Journal of Building Performance Simulation, 7(1), 68–81.
Nguyen, A. T., & Reiter, S. (2014b). Passive designs and strategies for low-cost housing using simulation-based optimization and different thermal comfort criteria. Journal of Building Performance Simulation, 7(1), 68–81.
Nguyen, A. T., Singh, M. K., & Reiter, S. (2012). An adaptive thermal comfort model for hot humid South-East Asia. Building and Environment, 56, 291–300.
Nicol, J. F., & McCartney, K. J. (1999). Assessing adaptive opportunities in buildings. Proceedings of the CIBSE National Conference (pp. 219–229).
Nicol, J. F., Raja, I. A., Allaudin, A., & Jamy, G. N. (1999). Climatic variations in comfort temperatures: The Pakistan projects. Energy and Buildings, 30(1999), 261–279.
Nicol, F. (2004). Adaptive thermal-comfort standards in the hot-humid tropics, 2016. Energy Buildings, 36, 628–637.
Noël, D., René, T., & Donatien, N. (2010). Thermal comfort: A review paper. Renewable Sustainable Energy Rev, 14, 2626–2640.
Noël, D., René, N., & Donatien, T. (2012). Estimation of some comfort parameters for Sleeping environments in dry-tropical sub-Saharan Africa region. EnergyConvers Manage, 58, 110–119.
Ogbonna, A. C., & Harris, D. J. (2008). Thermal comfort in sub-Saharan Africa: Field study Reportin Jos-Nigeria. Appl Energy, 85, 1–11.
Rakotondramiarana, H. T., Ranaivoarisoa, T. F., & Morau, D. (2015). Dynamic simulation of the green roofs impact on building energy performance, case study of Antananarivo, Madagascar. Buildings, 5, 497–520.http://dx.doi.org/10.3390/ buildings5020497.
Razanamanampisoa, H., Randriamanantany, Z. A., & Rakotondramiarana, H. T. (2018). Simulation of a typical house in the region of antananarivo, madagascar determination of passive solutions using local materials.https://www.researchgate.net/publication/ 236683068.
Ricciardi, P., & Buratti, C. (2012). Thermal comfort in open plan offices in northern Italy: an adaptive approach. Building and Environment, 56, 314–320.
Ricciardi, P., & Buratti, C. (2015). Thermal comfort in the Fraschini theatre (Pavia, Italy): Correlation between data from questionnaires measurements, and mathematical
model. Energy and Buildings, 99, 243–252.
Ricciardi, P., & Ziletti Buratti, A. (2016). Evaluation of thermal comfort in an historical Italian opera theatre by the calculation of the neutral comfort temperature. Building and Environment, 102, 116–127.
Roaf, S. C., Fuentes, M., & Taylor, S. (2001). The eco-house design guide. London: Architectural Press [ISBN 0 7506 4904 0].
Rohles, F. H. (1971). Thermal sensations of sedentary man in moderate temperatures. Human Factors, 13, 553–560.
Sekhar, S. C. (1995). Higher space temperatures and better thermal comfort– A tropical analysis. Energy and Buildings, 23, 63–70.
Sullivan, P., & Trujillo, A. (2015). The importance of thermal comfort in the classroom. West Point, NY: United States Military Academy.
Tablada, A., De Troyer, F., Blocken, B., Carmeliet, J., & Verschure, H. (2009). On natural ventilation and thermal comfort in compact urban environments– The Old Havana case. Building and Environment, 44, 1943–1958.
Tadross, M., Randriamarolaza, L., Rabefitia, Z., & Yip, Z. K. (2008). Climate change in Madagascar:Recent past and future. Meteo Malgasy, 1–18.
Tan, & Kosonen (2003). An adaptive thermal comfort approach in air-conditioned buildings in the tropical hot-and-humid climates. Proceedings Healthy Buildings, 67-72, 1.
UNI EN. ISO 7730 (2006). Ergonomics of the thermal environment–analytical determination and interpretation of thermal comfort using calculation of the PMV and PPD indices and local thermal comfort criteria.
Wong, N. H., & Khoo, S. S. (2003). Thermal comfort in classrooms in the tropics. Energy and Buildings, 35, 337–351.
Wong, N. H., Feriadi, H., Lim, P. Y., Tham, K. W., Sekhar, C., & Cheong, K. W. (2002). Thermal comfort evaluation of naturally ventilated public housing in Singapore. Building and Environment, 37, 1267–1277.
Yau, Y. H. (2008). A preliminary thermal comfort study in tropical buildings located in Malaysia. International Journal of Mechanics and Materials in Design, 3(2), 119–126.
van der Linden, W., Loomans, M., & Hensen, J. (2008). Adaptive thermal comfort ex-plained by PMV. 11th international conference on indoor air quality and climate (pp. p8)..
vander Lindena, K., Boerstra, A. C., Raue, A. K., & Kurvers, S. R. (2002). Thermal indoor climate building performance characterized by human comfort response. Energy and Buildings, 34, 737–744.