HAL Id: hal-01280119
https://hal-mines-paristech.archives-ouvertes.fr/hal-01280119
Submitted on 29 Feb 2016
HAL is a multi-disciplinary open access
archive for the deposit and dissemination of
sci-entific research documents, whether they are
pub-lished or not. The documents may come from
teaching and research institutions in France or
abroad, or from public or private research centers.
L’archive ouverte pluridisciplinaire HAL, est
destinée au dépôt et à la diffusion de documents
scientifiques de niveau recherche, publiés ou non,
émanant des établissements d’enseignement et de
recherche français ou étrangers, des laboratoires
publics ou privés.
new catalyst supports for PEM fuel cells
Guillaume Ozouf, Christian Beauger
To cite this version:
Guillaume Ozouf, Christian Beauger. Niobium- and antimony-doped tin dioxide aerogels as new
catalyst supports for PEM fuel cells. Journal of Materials Science, Springer Verlag, 2016, 51 (11),
pp.5305-5320. �10.1007/s10853-016-9833-7�. �hal-01280119�
Niobium- and antimony-doped tin dioxide aerogels
as new catalyst supports for PEM fuel cells
G. Ozouf, C. Beauger*
MINES ParisTech, PSL Research University, PERSEE - Centre procédés, énergies renouvelables et
systèmes énergétiques, CS 10207 rue Claude Daunesse 06904 Sophia Antipolis Cedex, France
*corresponding author
Keywords: Tin dioxide, aerogel, Nb and Sb doping, catalyst support, Fuel cells.
Abstract
In order to tackle the problem of low durability, tin dioxide was studied to replace carbon black as a catalyst support in Proton Exchange Membrane Fuel Cells (PEMFCs). SnO2 is a well-known n-type semi-conductor
whose electronic conductivity can be improved by doping with hypervalent cations such as Nb5+ or Sb5+. In addition, as a catalyst support, this material has to develop a high specific surface area with an adequate mesoporous morphology to allow both good dispersion and activity of the catalyst (Pt). To this end, our objective was to develop doped SnO2 aerogels in order to gather in a same material both a high electronic
conductivity and an adapted morphology. In this study SnO2 xerogels and aerogels were successfully synthetized
following an acid-catalyzed sol-gel route starting with metal alkoxides as precursors. Dried gels were calcined for 5 h at 600 °C in flowing air. The effect on both the structure and the morphology of the material resulting from doping with niobium or antimony was investigated by XRD, SEM and nitrogen sorption. The electronic conductivity of pure and doped SnO2 materials was obtained from impedance spectroscopy and resistance
measurements. Our materials showed a very interesting airy morphology adapted for the foreseen application: a reasonable specific surface area (80-90 m²/g) with a bimodal pore size distribution centered on around 25 nm and 45 nm. Moreover, all Sb-doped samples exhibited significant improvement in electronic conductivity. 5 at.% Sb-doped SnO2 even showed an electronic conductivity of 1 S/cm, very similar to that of Vulcan XC-72 (4
Introduction
Fuel cells are environmentally friendly electrochemical energy converters that produce electricity and heat mainly from hydrogen and air [1-3]. Among the many existing types of fuel cells, Proton Exchange Membrane Fuel Cells (PEMFCs) have the advantage of providing a large range of power, from a few W to hundreds of kW. Operating at low temperatures (80 °C), PEMFCs allow quick starts what makes them particularly interesting for transport applications. Low temperature operation limits the choice of catalysts for electrochemical reactions (H2
oxidation, HOR and O2 reduction, ORR) to noble metals, mostly platinum. To reduce the amount of platinum
while maintaining good performance, platinum nanoparticles are dispersed on a support. Because they have both a high electronic conductivity and a high specific surface area (respectively about 4 S/cm and 254 m²/g for Vulcan XC-72 [4]), current electrocatalysts are based on carbon blacks (Vulcan XC-72R or TKK TEC10E40E for instance). However, the corrosion of carbon black on the cathode side in fuel-cell operating conditions (E = 1.2V, T = 80 °C, high relative humidity and strongly acidic environment) is responsible for contact losses between the conductive carbon support and the catalyst, thus limiting the durability of PEMFC. This phenomenon is particularly marked for transport applications, during start / stop cycles [4, 5]. They may indeed cause a reverse current compared to the normal operation of the fuel cell, leading to an increase in the cathode potential of up to 1.44 V. In the presence of platinum nanoparticles, such high potential causes severe corrosion of the cathode following the reaction:
C + 2H2O → CO2 + 4H +
+ 4e− E0 = 0.207 V versus NHE
Degradation mechanisms include dissolution as well as coalescence of platinum particles, thus limiting their activity [6].
According to thermodynamic calculations derived from Pourbaix pH-potential diagrams, tin dioxide is expected to be very stable in PEMFC operating conditions. Its utilization as a catalyst support should improve PEMFC durability [7]. Tin dioxide is an n-type semi-conductor (Eg = 3.6 eV). Doping SnO2 with hypervalent donor
components like Nb5+ or Sb5+ leads to a significant increase of the electronic conductivity [8, 9]. Due to its remarkable bulk and surface properties, this material is already used as a transparent conductive oxide (TCO) [10], an electrode material in Li-ion batteries [11, 12], a catalyst for oxidation reaction [13-15] and a sensing material in gas sensors [16-18].
Several authors have shown that using pure SnO2 as a catalyst support effectively improves the durability of
degradation by neutralizing the formation of H2O2 formed during ORR [22]. It also allows better tolerance to
CO than Pt / C electrocatalysts [14, 23, 24]. This can be explained by the oxidation of CO adsorbed at the Pt surface by the hydroxyl groups covering the surface of SnO2 [25]. However, electrochemical characteristics, like
the electrochemical surface area (ECSA) or the oxygen reduction reaction (ORR) mass and specific activities of Pt/SnO2 electrocatalysts, are relatively low compared to those of Pt/C, mostly due to their poor electronic
conductivity and low specific surface area. Recent studies have shown the potential of doping SnO2 by Nb5+
[26-29] or Sb5+ [26, 27, 30-36]. In addition to improving electronic conductivity, dopants are known to inhibit particle growth [37] and modify the material’s morphology. Although improvements have been observed compared to pure SnO2, experimental results generally show lower performance than carbon black, particularly
regarding mass catalytic activity. In some cases, depending on the SnO2 morphology, mass catalytic activities
were improved, even surpassing those of Pt/C electrocatalysts [27, 35]. This has been ascribed to the sometimes contested strong metal-support interaction (SMSI) [38, 39]. It has been proposed that this strong interactions between SnO2 and Pt may change the Pt electronic structure and lower the activation barrier for oxygen
dissociation [40]. However a recent study has shown that steric effects are more likely the cause of this lower activation barrier [41].
The morphology of the support is primordial to limit concentration polarization and ease fluids management in volume electrode. Aerogels are to this end particularly interesting materials. Carbon aerogels have already proven their ability to efficiently support catalysts for PEMFC application [42, 43]. Their morphology can be adjusted by playing on the sol-gel parameters for higher specific surface areas with adequate mesoporosity. In this study, SnO2 aerogels were thus synthesized to be used as a catalyst support for PEMFC in order to
overcome the reported limitations regarding morphology and durability. The effect of doping SnO2 with niobium
or antimony on the electronic conductivity as well as on the morphology has also been investigated.
Experimental
SnO2 synthesis route
Metal oxides were synthesized following a sol-gel route, starting with metal alkoxide precursors: Sn(OiPr)4,
Nb(OiPr)5 and Sb(OiPr)3 all purchased from Alfa Aesar. Two solutions (A & B) were prepared. Solution A,
consisting of tin isopropoxide in isopropanol (Acros Organics, 99.5%) with a corresponding amount of the doping element, was placed under magnetic stirring. Solution B, consisting of nitric acid (Alfa Aesar, 2N)
(HNO3/Sn = 0.072 mol/mol) in water (H2O/Sn = 3.06 mol/mol) and isopropanol (iPrOH/Sn = 119 mol/mol), was
also mixed under magnetic stirring. Solution B was then slowly dripped into solution A and a gel formed after a few minutes. The gel was then covered with isopropanol to prevent any drying and aged for 48 hours at room temperature before being washed with isopropanol three times a day for two days. After washing, the resulting gels were dried either by conventional evaporation to obtain xerogels, or under CO2 in supercritical conditions
(80 bars, 40 °C) to obtain aerogels. The resulting solids were heat treated under air for 5 h.
After calcination, the sample color turned blue or black respectively for SnO2: Sb aerogels or xerogels. The
SnO2: Nb xerogels turned light green whereas the SnO2: Nb aerogels remained white. Compared to aerogels,
xerogels are likely to be darker in color due to a higher density resulting from the drying route.
Samples were labeled according to a dedicated nomenclature. For example, the SnO2: Nb (10 at.%) aerogel
sample is labeled A6SN100, where A stands for aerogel (X for xerogels), 6 for calcination at 600 °C in air, S for SnO2, N for Nb dopant (S for Sb) and 100 for 10 at.% doping.
Characterization
XRD measurements were performed using an X’Pert pro, Philips diffractometer (Cu Kα of λ =1.5405 Å). The diffractometer was operated at 45 kV and 30 mA. Data were collected at steps of 0.05 ° from 20° to 90° in 2-θ mode with a Pixcel counter.
Morphologies were analyzed by SEM using a Supra 40 with Gemini column operated at 3.00 kV. The oxide powders were deposited on adhesive conducting carbon tapes and coated with a 7 nm thick platinum layer, using a Quorum (Q150 T).
In addition, nitrogen sorption analysis was performed with a Micromeritics ASAP 2020. Samples were first degassed for 120 min at 100 °C and 10 μmHg. The Brunauer-Emmett-Teller (BET) model was applied to determine the specific surface area. The pore size distributions were calculated applying the Barret-Joyner-Halenda (BJH) method to the desorption branch of the isotherms. The assessments of microporosity were made from t-plot construction using the Harkins-Jura correlation.
Concerning the pore size distribution determination using this technique, we assumed that the samples were mechanically strong enough after calcination to withstand the pressure applied during the experiment.
The bulk chemical composition was analyzed by Energy Dispersive X-ray Spectroscopy (EDX) performed during SEM observation with a Philips XL30 operated at 15 kV.
The surface chemical composition was analyzed by X-ray Photoelectron Spectroscopy (XPS) using a Thermo Scientific K-Alpha system. The spectrometer was equipped with an AlKα monochromated source and a low energy flood-gun for charge compensation.
The ellipsoid spot size is about 350 µm x 700 µm.
The electronic conductivity was investigated by impedance spectroscopy and direct resistance measurements. For impedance spectroscopy, the frequency ranged from 100 Hz to 1 MHz with a potential of 200 mV and an amplitude of 100 mV. Since pellet formation was difficult for SnO2 samples, impedance spectroscopy
measurements were only performed on xerogel sample parts. Due to their powder form, it was actually not possible to perform impedance spectroscopy measurements on aerogels. Next, a homemade conductivity cell was developed, made up of two copper electrodes (S = 0,785 cm²) surrounded with a Teflon ring. Samples were introduced between these two electrodes (see Fig. 1). A potentiostat was used to apply a current of 105 mA, -105 mA or 400 mA and the voltage was measured for each current. The homemade conductivity cell was placed in a press and measurements were made at room temperature, without and with pressure at 500 kg and 1000 kg (respectively 6.5 × 10² kg/cm2 and 13 × 102 kg/cm2).
The conductivity (σ) was calculated with the formula σ = e/(R×Selectrode), where e is the thickness of the sample,
R the measured resistance and Selectrode the surface of the electrode.
Results and discussion
Structural and morphological characterization
In this section, we present the structural and morphological characterization results. These results highlight specific properties such as crystallinity and specific surface areas or pore size distributions, which are crucial in selecting the most appropriate sample for the foreseen application.
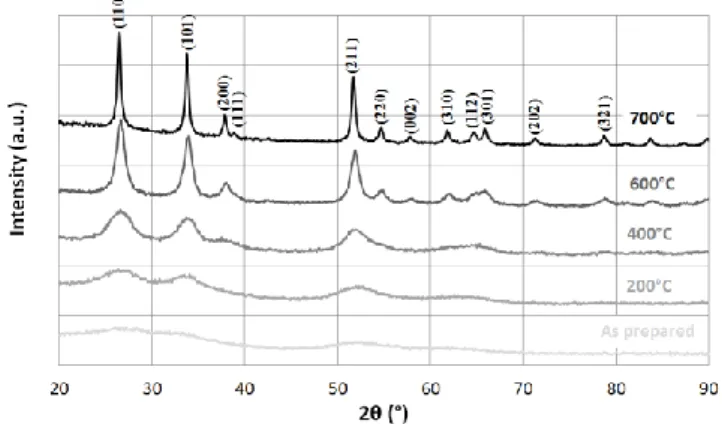
Since the electronic conductivity in semi-conductors is strongly related to the periodic crystal structure, materials were calcined at different temperatures in air. The resulting XRD diagrams are shown in Fig. 2.
All calcined samples show characteristic peaks of rutile SnO2. After calcination at 400°C, the XRD peaks are
relatively wide with very weak intensity, showing low crystallinity, with the material remaining partially amorphous. The crystallinity improves following calcination at 700°C. SnO2 xerogels then exhibit good
crystallinity, the peaks are intense and the Full Width at Half Maximum is small. Both the electronic conductivity and the specific surface area are important for catalyst support. Given that the higher the calcination temperature the better the crystallinity but the lower the specific surface area, we needed to find a compromise. In order to avoid too severe a decrease in the specific surface area, materials were calcined at 600°C.
Fig. 2 X ray diffraction diagrams of pure SnO2 xerogels before and after calcination at 200°C, 400°C, 600°C and
700°C for 5 h in air
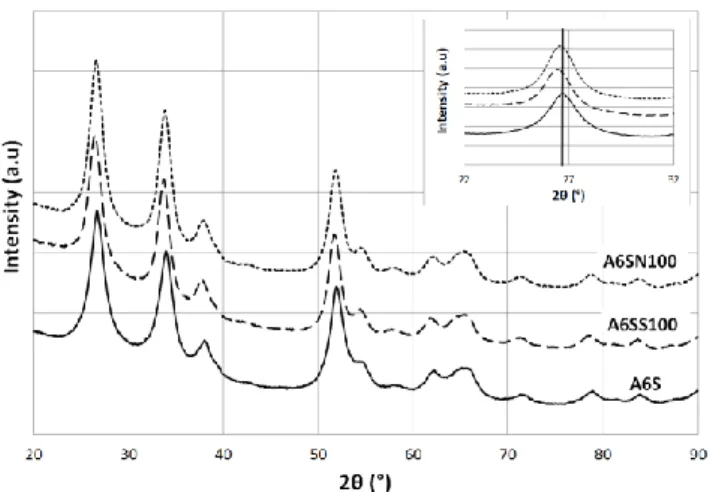
Nb and Sb Doped SnO2 samples were prepared following a similar synthesis route, simply adding the dopant
Whatever the amount of dopant between 5 and 15 at.%, XRD diffractograms of doped SnO2 aerogels also only
showed the characteristic peaks of the SnO2 rutile phase (see Fig. 3 for pure and 10 at% doped samples). No new
crystal phase was detected and we observed a peak shift over a smaller angle. This shift is more pronounced for Sb-doped samples than for Nb-doped ones (insert in Fig. 3), resulting from a greater modification of the SnO2
lattice parameters. Both the absence of a new phase and the observation of XRD peak shifts are good indications of proper doping.
Fig. 3 X ray diffractogram of aerogels: pure SnO2 (A6S), SnO2: Sb (10 at.%) (A6SS100) and SnO2: Nb (10 at.%)
(A6SN100). All samples were calcined for 5 h at 600 °C in air
SEM analyses of the samples calcined at 600 °C were then performed to visualize the morphology of the aerogels and xerogels (Fig. 4 and 5) and possibly check the impact of doping.
The morphology of pure SnO2 aerogel (A6S) results from the agglomeration or aggregation of rather small
particles (about 13 nm). The organization of such agglomerates results in the formation of large pores.
Doping seems to inhibit particle growth during the sol-gel process. Nb- or Sb-doped aerogels are indeed made up of smaller particles than pure SnO2 aerogels. Nucleation and growth control of SnO2 particles with dopant has
already been observed and reported [9, 28, 37].
The overall picture of Nb-doped SnO2 aerogel (A6SN100) is quite similar to that of pure SnO2 (A6S) although
Fig. 4 SEM pictures of aerogels: pure SnO2 (A6S), SnO2: Nb (10 at.%) (A6SN100), SnO2: Sb (5 at.%)
On the contrary, the morphology of Sb-doped SnO2 aerogels (A6SS050 and A6SS100) is significantly different.
They show a very interesting airy morphology lying on a three-dimensional network made up of interconnected particles. It is noteworthy that this morphology is quite similar to that of carbon aerogels previously synthesized in our group [43]. Sb doped SnO2 aerogels are from this point of view more interesting than Nb doped ones.
As expected from the drying route, xerogel samples showed a very different morphology. X6SS050 and X6SS100, presented in Fig. 5, are much denser and show less apparent porosity than their aerogel counterparts.
Fig. 5 SEM pictures of xerogels: SnO2: Sb (5 at.%) (X6SS050) and SnO2: Sb (10 at.%) (X6SS100). All samples
calcined for 5 h at 600 °C in air
To obtain additional morphological data, we performed nitrogen sorption analysis. The results are reported in Table 1 and Fig. 6 for aerogels and in Table 2 and Fig. 7 for xerogels.
Specific surface areas were calculated based on the BET model. Pore size distributions and mesoporous volumes were calculated based on the BJH model, assuming that all calcined samples are mechanically strong enough to withstand applied forces during analysis.
It is interesting to note that the doping rate impacts both the specific surface area and the mesoporous volume. A maximum was observed for 10 at.% doping rate. Values are actually relatively high for pure and 10 at.% doped materials, reaching almost 90 m²/g for the specific surface area, and 0.3 cm3/g for the mesoporous volume, whatever the dopant used (Sb or Nb).
The microporous volume of aerogel samples is negligible compared to their mesoporous volume. This is of utmost importance for the foreseen application, since most of the porosity will thus be accessible for Pt deposition and utilization. Here again, Sb-doped aerogels are more promising than pure or Nb-doped ones, showing an even smaller microporous volume.
The pore size distribution, calculated using the BJH method from isotherms, shows, for pure SnO2 aerogels, a
multimodal distribution with quite a narrow peak at around 15 nm and broader ones centered on 20 and 40 nm (Fig. 6).
Looking at Fig. 6, N2 sorption should be complemented by mercury porosimetry analysis to fully characterize
the pore size distribution, especially in the macroporous domain. Due to the nature of the samples, such an analysis could not be performed. Still, N2 sorption analysis allowed to highlight morphology differences between
aerogels samples.
The pore size distribution observed for doped samples is notably modified. First, the main peaks at 15, 20 and 40 nm observed for pure SnO2 have shifted to larger diameters, namely 20, 30 and 45 nm. Second, the contributions
at 30 and 45 nm are significantly lower for Nb-and Sb-doped samples than for pure SnO2. The peak at 45 nm is
even smaller for Sb doped samples. The decrease in porosity around 45 nm may be related to the SEM observations and the change in size of the particle agglomerates.
To sum up, a multimodal distribution with broad peaks centered around 25 nm and 45 nm was observed for Sb and Nb doped SnO2.
In line with SEM observations, xerogel samples showed smaller specific surface areas than aerogel samples and much smaller porous volumes (0.1 cm3/g vs 0.3 cm3/g). Accordingly, the microporous volume is also negligible, at two orders of magnitude smaller than that of aerogels.
In the case of xerogels, the specific surface area clearly increases with the Sb content. It is noteworthy that the 10 and 15 at.% doped xerogel samples showed surprisingly high specific surface areas of around 60 m²/g, close to the aerogel one.
Xerogel pore size distribution is also significantly different. Only one peak is observed for pure SnO2, centered
at around 13 nm. This peak shifts toward smaller diameters with the increase in Sb content. It is centered at around 4 nm for SnO2: Sb 15 at.%. Such behavior is consistent with our SEM observations and literature that
reports a decrease in particle size after doping.
So, despite negligible microporous volume and quite high specific surface area, due to pore size distributions centered on small mesopores (all < 15 nm), xerogels appear less appropriate for the application.
Table 1 Nitrogen sorption measurement results - SnO2 aerogel samples (calcined for 5 h at 600 °C in air)
Sample Dopant-Rate (at.%) S BET (m²/g) PSD (BJH) (nm) Pore Volume (BJH) (cm3/g) µpore volume (t-plot) (cm3/g) A6S x-x 81 15-20-40 0.31 1.5 × 10⁻² A6SN050 Nb-5 76 20-30-45 0.21 1.2 × 10⁻² A6SN100 Nb-10 87 20-30-45 0.29 1.3 × 10⁻² A6SS050 Sb-5 56 20-30-45 0.21 0.4 × 10⁻² A6SS100 Sb-10 85 20-45 0.27 0.8 × 10⁻² A6SS150 Sb-15 42 15-25-40 0.13 0.5 × 10⁻²
Fig. 6 Pore size distribution for pure and doped SnO2 aerogels (A6S: pure SnO2, A6SN100: SnO2: Nb 10 at.%,
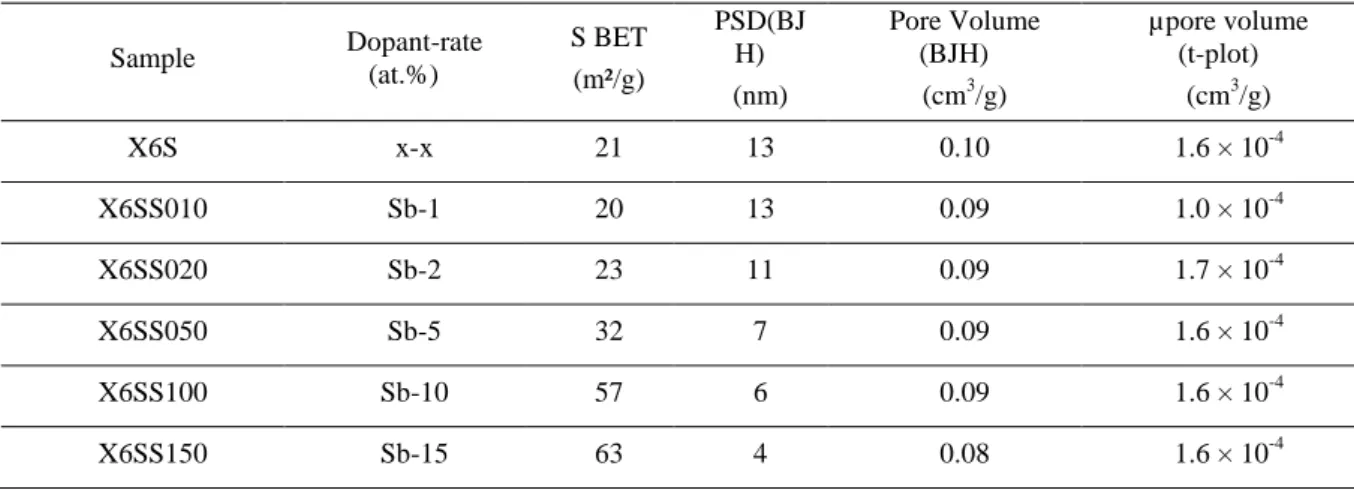
Table 2 Nitrogen sorption measurement results - SnO2 xerogel samples (calcined for 5 h at 600 °C in air) Sample Dopant-rate (at.%) S BET (m²/g) PSD(BJ H) (nm) Pore Volume (BJH) (cm3/g) µpore volume (t-plot) (cm3/g) X6S x-x 21 13 0.10 1.6 × 10-4 X6SS010 Sb-1 20 13 0.09 1.0 × 10-4 X6SS020 Sb-2 23 11 0.09 1.7 × 10-4 X6SS050 Sb-5 32 7 0.09 1.6 × 10-4 X6SS100 Sb-10 57 6 0.09 1.6 × 10-4 X6SS150 Sb-15 63 4 0.08 1.6 × 10⁻⁴
Fig. 7 Pore size distribution for pure and doped SnO2 xerogels (X6S: pure SnO2, X6SS010: SnO2: Sb 1 at.%,
X6SS050: SnO2: Sb 5 at.%, X6SS150: SnO2: Sb 15 at.%)
Chemical composition
Chemical composition obviously impacts electronic conductivity. Although the amount of dopant precursor can be perfectly controlled during the sol-gel process, the exact concentration of dopant and its repartition in the final material has to be analyzed. The homogeneity of the sol may indeed not be optimal and some precursors could also partially precipitate during the sol-gel transition, thus modifying the real dopant amount within samples. Moreover, during calcination the thermal energy can induce some atomic diffusion of the dopant within the SnO2
Thus, both bulk and surface chemical compositions were measured by EDX and XPS respectively. These two methods are semi-quantitative and are used to compare different samples rather than to provide their real chemical composition.
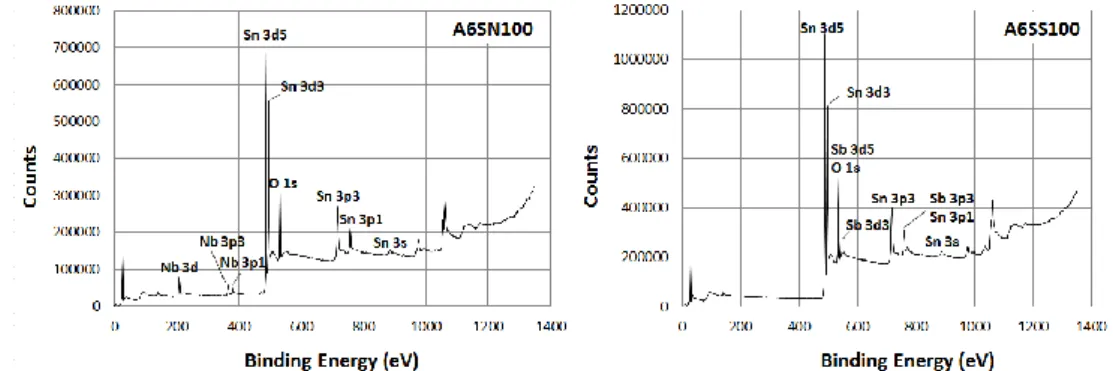
Fig. 8 EDX typical spectra obtained for SnO2: Nb (A6SN100) and SnO2: Sb (A6SS100) aerogels
Fig. 9 XPS survey spectra obtained for SnO2: Nb (A6SN100), SnO2: Sb (A6SS100) aerogels
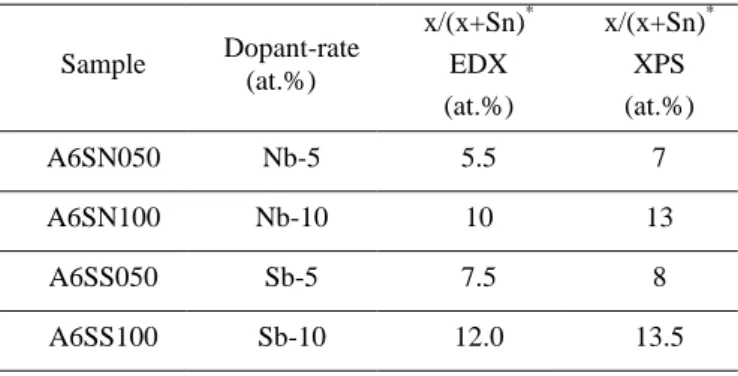
According to the EDX measurements (Table 3), the niobium bulk concentrations correspond to the expected values for 5 and 10 at.% doped SnO2 samples.The surface niobium concentration, measured by XPS, is however
slightly higher than the bulk concentration (respectively 7 and 13 at.% vs 5 and 10 at.% expected for A6SN050 and A6SN100). The chemical composition does not seem to be perfectly homogenous in all SnO2: Nb samples.
Such surface enrichments have already been reported by Szczuko et al. [9].
Regarding Sb-doped samples, the EDX peaks of Sn and Sb are very close due to the similar electronic structure of these two elements (Fig. 8). The doping rate calculation is thus more difficult. According to the EDX analysis, the Sb bulk concentration is higher than expected. This may however be a simple overestimation due to the Sn and Sb peaks overlapping. The trend is consistent for 5 and 10 at.% doped samples whose dopant concentration was calculated respectively to 7.5 and 12 at.%.
XPS survey spectra of SnO2: Nb and SnO2: Sb aerogels are shown on Fig. 9. Similar difficulties than for EDX
analysis arose to quantify Sb rate at the surface, since the most intense peak of Sb (Sb 3d5) stands at the same binding energy as the O 1s peak. Thus, we performed measurements considering a less intense Sb peak (Sb 3d3) (Fig. 10). As for EDX, the characterization accuracy of Sb-doped samples is rather poor but comparison is still possible. As shown in Table 3, the Sb rate is also higher than expected on the surface, whatever the expected amount of Sb. The surface concentrations are still slightly larger than the bulk ones. They may also have been overestimated. As already observed [44, 45], Sb seems also prone to segregation in our SnO2 aerogels (about
10% more Sb measured on surface vs volume), however in a lesser extent than Nb (30% more Nb measured on surface vs volume).
If such segregations reveal to be problematic in fuel cell operating conditions, we will try to mitigate them through accurate selection or modification of metal precursors. Segregation may indeed result from different hydrolysis or condensation kinetics with the precursors used. In our case, tin isopropoxide may be more reactive than niobium and antimony isopropoxide. Segregation can probably be mitigated selecting or even synthesizing precursors with similar hydrolysis/condensation kinetics.
Table 3 Chemical composition of aerogels from EDX and XPS measurements Sample Dopant-rate (at.%) x/(x+Sn)* EDX (at.%) x/(x+Sn)* XPS (at.%) A6SN050 Nb-5 5.5 7 A6SN100 Nb-10 10 13 A6SS050 Sb-5 7.5 8 A6SS100 Sb-10 12.0 13.5 * x = Nb or Sb
Electronic conductivity measurement
High electronic conductivity is essential for a material to be a good catalyst support in PEMFC. As metal oxides are by definition dielectric, high conductivity can only be obtained by modifying their electronic configuration. Doping is one option, as followed in this work. It is of paramount importance to check how the dopant type and concentration influence the electronic conductivity of doped samples. In this section, the electronic conductivity was measured for different Nb and Sb concentrations and compared to that of pure SnO2 on one hand and carbon
on the other hand. All materials were analyzed in the same conditions. In order to limit the impact of interface resistance between particles, measurements were first performed on xerogel sample pieces. This allowed us to study the influence of both the dopant type and its concentration. Measurement errors are quite high due to surface roughness of the samples, which was not possible to improve.
Nb5+ doping was first selected to increase the SnO2 conductivity (Table 4). Typical impedance curves obtained
for Nb-doped SnO2 exhibit a characteristic half circle arc that is representative of a semi-conductor behavior
(Fig. 11). The high frequency resistance is representative of bulk resistance, and the diameter of the half circle corresponds to that of interface resistances. We used both to analyze the conductivity of our samples.
The bulk conductivity of SnO2 is considerably low (5×10 -4
S/cm). The interface resistance between particles is relatively high, resulting in lower global conductivity, even for doped samples.
Compared to pure SnO2, Nb-doped samples exhibit a significant improvement in bulk electronic conductivity.
5×10⁻³ S/cm was reached for 10 at.% of Nb, i.e. one order of magnitude higher than that of pure SnO2. The
significant interface resistances. The doping inhibits grain growth during the sol gel process, as mentioned above and in agreement with SEM observations and pore-size distribution calculations. Hence, the number of interfaces should be greater for doped materials, thus partially accounting for the limited improvement in the global conductivity.
The bulk conductivities of Nb-doped samples are still very low and far from that of Vulcan XC-72.
Fig. 11 Nyquist plot obtained for SnO2: Nb 10 at.% xerogel
Table 4 SnO2: Nb conductivities obtained from Impedance Spectroscopy measurements on xerogel samples
Samples Dopant-rate (at.%) Bulk conductivity 10-5 (S/cm) Global conductivity 10-5 (S/cm) X6S - 53 ± 2 1.9 ± 1.3 X6SN020 Nb - 2 63± 11 1.0± 0.4 X6SN100 Nb - 10 490± 360 4.5± 3.6
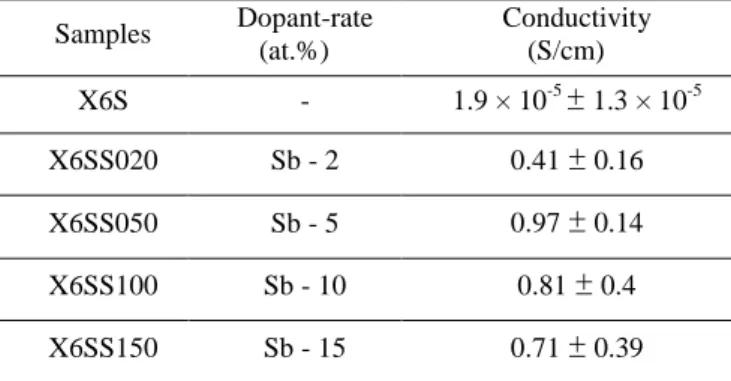
In agreement with other studies [9, 31, 33, 36, 46, 47], an impressive improvement in conductivity was observed for Sb-doped SnO2 (Table 5). X6SS100 (10 at.% Sb-doped SnO2 xerogel) shows indeed the typical behavior of
a conducting material (Fig. 12). No impact of grain boundaries can be observed on the Nyquist plot. In agreement with Bruneaux et al. [48], this may result from a higher charge carriers density than in the case of Nb doping. Whatever the Sb rate between 2 at.% and 15 at.%, conductivities were improved by at least 4 orders of magnitude compared to pure SnO2. The electronic conductivity reached a maximum of about 1 S/cm for 5 at.%
Fig. 12 Nyquist plot obtained for SnO2: Sb 10 at.% xerogel
Table 5 SnO2: Sb conductivity obtained from Impedance Spectroscopy measurements on xerogel samples
Samples Dopant-rate (at.%) Conductivity (S/cm) X6S - 1.9 × 10⁻⁵ ± 1.3 × 10-5 X6SS020 Sb - 2 0.41 ± 0.16 X6SS050 Sb - 5 0.97 ± 0.14 X6SS100 Sb - 10 0.81 ± 0.4 X6SS150 Sb - 15 0.71 ± 0.39
Based on this first series of results, Sb was selected as the favored dopant to determine the conductivity of doped SnO2 aerogels.
Aerogel materials are not monolithic enough after calcination to allow impedance spectroscopy measurements and it was difficult to prepare pellets. We thus produced a homemade cell to measure the resistance of aerogel materials, pressed between two electrodes inserted into a Teflon cylinder. For comparison purposes, we also measured the resistance of xerogels in the same conditions.
The evolution of conductivity with the pressure applied on the sample through the electrodes is shown in Fig. 13 for xerogels and Fig. 14 for aerogels.
As expected, the conductivity increases with the pressure applied. No significant difference was observed following a change in the current (+105 mA, -105 mA or 400 mA). In most cases, a plateau is reached from 6.5 × 10² kg/cm2 of applied pressure.
Fig. 15 represents the evolutions of conductivity for aerogels and xerogels as a function of the antimony doping rate and for the two methods used in this study (1: EIS, 2: direct resistance measurement).
First, conductivity values obtained with the homemade cell (13 × 102 kg/cm2 pressure, data referenced (2) on Fig. 15) are 4 times higher than those obtained with impedance spectroscopy (data referenced (1) in Fig. 15). This is probably due to better contact between particles resulting from the relatively high pressure applied. Then, the conductivity of xerogels is roughly between one and two orders of magnitude higher than that of aerogels.
Finally, whatever the measurement technique, the conductivity reaches a maximum for 5 at.% Sb doping rate in the case of xerogels and between 5 and 10 at.% in the case of aerogels.
Fig. 13 Evolution of electronic conductivity with pressure applied on SnO2: Sb xerogels - (2 at.%-X6SS020, 5
Fig. 14 Evolution of electronic conductivity with pressure applied on SnO2: Sb samples - (5 at.%-A6SS050 and 10 at.%-A6SS100)
Fig. 15 Xerogel and aerogel conductivity for different Sb-doping rates ( (2) : P = 13 × 102 kg/cm2)
Discussion
The purpose of this study was to synthetize a new corrosion resistant catalyst support for PEMFC. Both the morphology and the electronic conductivity are of major importance considering the foreseen application. In a first part, the unique material morphology will be highlighted in comparison with those reported in the literature. In a second part the electronic conductivity and its evolution with materials composition will be discussed.
Morphology
Considering the morphology, we have already stated that both the presence of meso and macropores are beneficial to fluid management within electrodes [43]. Moreover, since the optimum Pt particle size was reported to be between 3 and 4 nm in diameter, microporosity should be avoided and may become clogged after the deposition of platinum nanoparticles. Mesopores on the contrary allow good platinum nanoparticle dispersion while avoiding pore obstruction, still leaving room for high gas flow rates. Macropores are also beneficial to efficiently manage water coming from humidified gases and that produced during ORR.
Regarding such considerations, all SnO2 aerogels show a very interesting morphology. Combining specific
surface area close to 90 m²/g, adequate pore size distribution revealing medium and large mesopores (25 and 45 nm) and negligible microporous volume, they are particularly well adapted to the foreseen application.
Little research has been reported on such an interesting morphology, mixing a high specific surface area with wide pore size distribution. Our materials show higher values for SnO2 than most of those reported in literature
[26, 27, 33]. Usually, high specific surface area is developed at the expense of wide pore size distribution and vice versa. Indeed, high specific surface area nanostructured Sb-doped SnO2 materials have already been
synthesized. Lee et al. [49] achieved 100 m²/g from chloride precipitation in basic conditions. Sol-gel route using template, dodecylamine [31, 50] or tetradecylamine [34] also provide high specific surface areas with respectively 216 m²/g and 263 m²/g. However, these materials show a narrow pore size distribution centered on few nm only.
Although the specific surface areas developed by our materials are still lower than that of Vulcan XC-72 (254 m²/g), a general carbon black reference, the difference in bulk density is in favor of SnO2. We may actually
expect a similar developed surface area for the same volume. Since our aerogels crack after calcination, it was unfortunately not possible to measure their density. This advantage will be checked after electrochemical characterizations.
Thus, from a morphology point of view, the materials developed in this study are promising candidates for PEMFC catalyst support.
Electronic conductivity
High enough electronic conductivities where achieved only after doping with Sb. Doping with Nb allowed improving electronic conductivity by a factor of only 2 compared to undoped SnO2, what remains too low for the
foreseen application. Doping may actualy have been less efficient with Nb than with Sb. On one hand, the degree of segregation seems to be larger for Nb (see table 3) and on the other hand the repartition of the dopant in the SnO2 matrix may be less homogeneous, resulting in possible local Nb rich regions. Moreover, we cannot exclude
the possibility of amorphous Nb oxide regions which would concentrate Nb at the expense of SnO2. Finally the
association of defects due to the introduction of dopant in SnO2 may be less prone to increase the electronic
conductivity in the case of Nb than in the case of Sb.
Most of the conductivities reported in literature [9, 33, 46, 47] were measured using different levels of pressure applied on samples. Since conductivity obviously depends on powder density (the higher the density, the higher the conductivity), it is quite difficult to compare reported conductivity values from one study to another. However, the values obtained in our study for Sb-doped SnO2 xerogels are among the highest reported ones.
The observed evolution of electronic conductivity with the antimony dopant rate and the presence of a maximum have already been reported [9, 28, 31, 33, 46, 47]. This may be related to the oxidation state of the dopant.
SnO2 is known to be an oxygen-deficient non-stoichiometric oxide (SnO2-δ) [51]. Its intrinsic electronic
conductivity results from the presence of oxygen vacancies (VO••) which are compensated with electrons. Hence,
the non-stochiometry of SnO2 gives rise to an n-type conductivity according to the equilibrium (1):
2 OOx O2(g) + 4 e’ + 2 VO°° (1)
When SnO2 is doped with Sb, a possible competition between the two antimony oxidation states has been
suggested [52-55]. It has been shown that when Sb3+ is incorporated into SnO2, it is oxidized during calcination
in air [56]. This oxidation to Sb5+ is favored in the presence of SnO2, which acts as a catalyst and a stabilizer of
the Sb5+ state. This results in an increased Sb5+/Sb3+ ratio. The lower the Sb content, the higher the Sb5+/Sb3+ ratio.
For low doping rates, the antimony is agreed to be stabilized in a +5 state after calcination. According to geometrical considerations, the substitution, in the SnO2 lattice, of Sn4+ ions with Sb5+ ions is allowed thanks to
compatible ionic radius. Such a substitution leads to the generation of positively charged point defects SbSn °
which can be compensated by creating tin vacancies what can be represented with the equation (2): → (2)
These tin vacancies may then react with native oxygen vacancies, decreasing their concentration (at constant temperature and O2 partial pressure). Such a decrease in oxygen vacancy concentration impacts the equilibrium
(1) (right shift) resulting in a higher concentration of electrons in the lattice. Hence, the introduction of Sb5+ results in increased conductivity, as observed up to 5 at.% with xerogel samples.
For higher doping rates, Sb5+ is no longer favored and Sb3+ is stabilized. It substitutes Sn4+ as possibly represented with the equilibrium (3):
→ (3)
The creation of oxygen vacancies according to equilibrium (3) now impacts equilibrium (1) in the opposite direction, making the electron concentration decrease. Consequently, the electronic conductivity decreases, as experimentally observed from 5at.% on xerogel samples.
This hypothesis could partially explain the observed conductivity trend. It is however incomplete because it does not account for different parameters, such as the charge carrier mobility, the change in morphology between samples with different doping rates, and the effect of Sn4+ / Sn2+ transition. It has also been reported that Sb3+ cannot fit in Sn4+ octahedral coordination as good as Sb5+, which induces charge defects [48].
All conductivity values obtained here are not really representative of real catalytic layer conductivities. They are useful to compare samples and select the proper dopant and its concentration. The conductivity of aerogels measured here is notably lower than that of xerogels and carbon. It is however noteworthy that the doped SnO2
materials developed in this study are intended to be used as platinum support for fuel cell application. Pt nanoparticles deposited at the surface of SnO2 may then lower the depletion layer resulting from adsorbed
oxygen species (O2-, O- or O2-) limiting the electronic conductivity [57]. Thus as already reported [35, 58] we
Conclusion
Antimony and niobium-doped tin dioxide xerogels and aerogels were synthesized by a sol-gel route starting with metal alkoxide precursors. After calcination at 600 °C in air, only the rutile crystal phase of SnO2 was detected
by XRD for all samples, whether pristine or doped.
Due to their unique morphology, our Nb- and Sb-doped SnO2 aerogels appear to be very promising catalyst
supports for PEMFC cathode.
Aerogel samples show an interconnected particle network, particularly pronounced for Sb-doped samples, with bimodal mesoporous pore size distributions.
Doping SnO2 induces airier morphologies and leads to quite high specific surface areas: 85 m2/g for both SnO2:
Nb (10 at.%) and SnO2: Sb (10 at.%).
As expected from the drying route, xerogels are denser and present only very small pore diameters (< 20 nm). Highly doped xerogel samples, however, show surprisingly high specific surface areas (60 m²/g for 10 at.% Sb). All Sb-doped samples exhibited an impressive improvement in electronic conductivity compared to pure SnO2.
An increase of at least a 4 orders of magnitude has been recorded after doping SnO2 xerogels with Sb, to reach
electronic conductivities of about 1 S/cm (SnO2: Sb (5 at.%)), one order of magnitude less for aerogels. This
value is even very close to that of carbon Vulcan XC-72 (4 S/cm).
Only poor conductivities were achieved for Nb-doped samples (4.5 × 10⁻⁵ S/cm for 10 at.% of Nb versus 2 × 10⁻⁵ S/cm for pure SnO2).
To conclude, with an adequate morphology (high specific surface area, bimodal pore size distribution centered on 25 and 45 nm, negligible microporous volume) and thanks to a high bulk electronic conductivity close to that of Vulcan XC-72, Sb-doped SnO2 aerogel samples are very promising candidates as catalyst supports for
PEMFC cathodes.
Future work will center on Pt deposition and catalytic performance assessment (activity and durability).
AUTHOR INFORMATION
Corresponding Author: christian.beauger@mines-paristech.fr
ACKNOWLEDGMENTS
The authors wish to thank Pierre Ilbizian for supercritical drying, Frédéric Georgi for XPS analysis, Suzanne Jacomet for SEM/EDX analysis as well as Frédéric Fabry and Matthieu Houllé for their help in manufacturing the homemade conductivity measurement cell. This work was funded by the European Union's Seventh Framework Program for the Fuel Cells and Hydrogen Joint Technology Initiative under grant agreement n325239 (FCH-JU project Nano-CAT) and the French National Research Agency PROGELEC programme, (ANR-12-PRGE-007 project SURICAT). It was supported by Capenergies and Tenerrdis.
The final publication is available at Springer via http://dx.doi.org/[10.1007/s10853-016-9833-7]
References
1. Rabis A, Rodriguez P, Schmidt TJ (2012) Electrocatalysis for Polymer Electrolyte Fuel Cells: Recent Achievements and Future Challenges. Acs Catal 2(5):864-890.
2. Costamagna P, Srinivasan S (2001) Quantum jumps in the PEMFC science and technology from the 1960s to the year 2000 Part I. Fundamental scientific aspects. J Power Sources 102 (1-2):242-252. 3. Haile SM (2003) Fuel cell materials and components. Acta Materialia 51 (19):5981-6000.
4. Antolini E (2009) Carbon supports for low-temperature fuel cell catalysts. Appl Catal B-Environ. 88 (1-2):1-24.
5. Maass S, Finsterwalder F, Frank G, Hartmann R, Merten C (2008) Carbon support oxidation in PEM fuel cell cathodes. J Power Sources 176 (2):444-451.
6. Yasuda K, Taniguchi A, Akita T, Ioroi T, Siroma Z (2006) Platinum dissolution and deposition in the polymer electrolyte membrane of a PEM fuel cell as studied by potential cycling. Phys Chem Chem Phys 8 (6):746-752.
7. Sasaki K, Hayashi S, Kanda K, Takabatake Y, Tsukatsune T, Higashi T, Takasaki F, Noda Z, Hayashi A (2012) Alternative Electrocatalyst Support Materials for Polymer Electrolyte Fuel Cells. The Electrochem Soc Meeting Abstracts 1684.
8. Gokulakrishnan V, Parthiban S, Jeganathan K, Ramamurthi K (2011) Investigations on the structural, optical and electrical properties of Nb-doped SnO2 thin films. J Mat Sci 46 (16):5553-5558.
9. Szczuko D, Werner J, Oswald S, Behr G, Wetzig K (2001) XPS Investigations of Surface Segregation of Doping Elements in SnO2. Appl Surf Sci 179 (1-4):301-306.
10. Bressand JGE, Royer B (2009) Electrochromic device with controlled infrared reflection, european patent 2 307 926 B1.
11. Megahed S, Ebner W (1995) Lithium-ion Battery for Electronic Applications. J Power Sources 54 (1):155-162.
12. Courtney IA, Dunlap RA, Dahn JR (1999) In-situ Sn-119 Mossbauer effect studies of the reaction of lithium with SnO and SnO : 0.25 B2O3 : 0.25 P2O5 glass. Electrochim Acta 45 (1-2):51-58. 13. Fuller MJ, Warwick ME (1972) The Catalytic Oxidation of Carbon Monoxide on Tin(lV) Oxide. J
Catal 29:441-450.
14. Matsui T, Fujiwara K, Okanishi T, Kikuchi R, Takeguchi T, Eguchi K (2006) Electrochemical oxidation of CO over tin oxide supported platinum catalysts. J Power Sources 155 (2):152-156. 15. Herniman HJ, Pyke DR, Reid R (1979) An Investigation of the Relationship between the Bulk and
Surface Composition of Tin and Antimony Mixed Oxide Catalysts and the Oxidative Dehydrogenation of I-Butene to Butadiene. J Catal 58:8-73.
16. Viricelle JP, Valleron A, Pijolat C, Breuil P, Ott S (2012) Gas Sensors Based on Tin Dioxide for Exhaust Gas Application, modeling of response for pure gases and for mixtures. 26th European Conference on Solid-State Transducers, Eurosensor 47:655-658.
17. Shukla S, Patil S, Kuiry SC, Rahman Z, Du T, Ludwig L, Parish C, Seal S (2003) Synthesis and characterization of sol-gel derived nanocrystalline tin oxide thin film as hydrogen sensor. Sensors and Actuators B-Chem 96 (1-2):343-353.
18. Barsan N, Koziej D, Weimar U (2007) Metal oxide-based gas sensor research: How to? Sensors and Actuators B-Chemical 121 (1):18-35.
19. Masao A, Noda S, Takasaki F, Ito K, Sasaki K (2009) Carbon-Free Pt Electrocatalysts Supported on SnO2 for Polymer Electrolyte Fuel Cells. Electrochem Solid State Lett 12 (9):B119-B122.
20. Takabatake Y, Noda Z, Lyth SM, Hayashi A, Sasaki K (2014) Cycle durability of metal oxide supports for PEFC electrocatalysts. Int J Hydrog Energy 39 (10):5074-5082.
21. Zhang P, Huang SY, Popov BN (2010) Mesoporous Tin Oxide as an Oxidation-Resistant Catalyst Support for Proton Exchange Membrane Fuel Cells. J Electrochem Soc 157 (8):B1163-B1172. 22. Andersen SM, Norgaard CF, Larsen MJ, Skou E (2015) Tin Dioxide as an Effective Antioxidant for
Proton Exchange Membrane Fuel Cells. J Power Sources 273:158-161.
23. Matsui T, Kanishi T, Fujiwara K, Tsutsui K, Kikuchi R, Takeguchi T, Eguchi K (2006) Effect of reduction-oxidation treatment on the catalytic activity over tin oxide supported platinum catalysts. Sci Technol Adv Mater 7 (6):524-530.
24. Okanishi T, Matsui T, Takeguchi T, Kikuchi R, Eguchi K (2006) Chemical interaction between Pt and SnO2 and influence on adsorptive properties of carbon monoxide. Appl Catal a-General 298:181-187. 25. Arenz M, Stamenkovic V, Blizanac BB, Mayrhofer KJJ, Markovic NM, Ross PN (2005)
Carbon-supported Pt-Sn electrocatalysts for the anodic oxidation of H(2), CO, and H(2)/CO mixtures. Part II: The structure-activity relationship. J Catal 232 (2):402-410.
26. Takasaki F, Matsuie S, Takabatake Y, Noda Z, Hayashi A, Shiratori Y, Ito K, Sasaki K (2011) Carbon-Free Pt Electrocatalysts Supported on SnO2 for Polymer Electrolyte Fuel Cells: Electrocatalytic Activity and Durability. J Electrochem Soc 158 (10):B1270-B1275.
27. Kakinuma K, Chino Y, Senoo Y, Uchida M, Kamino T, Uchida H, Deki S, Watanabe M (2013) Characterization of Pt catalysts on Nb-doped and Sb-doped SnO2-delta support materials with aggregated structure by rotating disk electrode and fuel cell measurements. Electrochim Acta 110:316-324.
28. Cavaliere S, Subianto S, Savych I, Tillard M, Jones DJ, Roziere J (2013) Dopant-Driven Nanostructured Loose-Tube SnO2 Architectures: Alternative Electrocatalyst Supports for Proton Exchange Membrane Fuel Cells. J Phys Chem C 117 (36):18298-18307.
29. Shahgaldi S, Hamelin J (2015) The effect of low platinum loading on the efficiency of PEMFC's electrocatalysts supported on TiO2-Nb, and SnO2-Nb: An experimental comparison between active and stable conditions. Energy Convers Manage 103:681-690.
30. Kakinuma K, Uchida M, Kamino T, Uchida H, Watanabe M (2011) Synthesis and electrochemical characterization of Pt catalyst supported on Sn0.96Sb0.04O2-delta with a network structure. Electrochim Acta 56 (7):2881-2887.
31. Gurrola MP, Guerra-Balcazar M, Alvarez-Contreras L, Nava R, Ledesma-Garcia J, Arriaga LG (2013) High surface electrochemical support based on Sb-doped SnO2. J Power Sources 243, 826-830. 32. You DJ, Kwon K, Pak C, Chang H (2009) Platinum-antimony tin oxide nanoparticle as cathode catalyst
for direct methanol fuel cell. Catal Today 146 (1-2):15-19.
33. Yin M, Xu JY, Li QF, Jensen JO, Huang YJ, Cleemann LN, Bjerrum NJ, Xing W (2014) Highly active and stable Pt electrocatalysts promoted by antimony-doped SnO2 supports for oxygen reduction reactions. Appl Catal B-Environ 144:112-120.
34. Oh HS, Nong HN, Strasser P (2015) Preparation of Mesoporous Sb-, F-, and In-Doped SnO2 Bulk Powder with High Surface Area for Use as Catalyst Supports in Electrolytic Cells. Adv Func Mater 25(7):1074-1081.
35. Senoo Y, Taniguchi K, Kakinuma K, Uchida M, Uchida H, Deki S, Watanabe M (2015) Cathodic performance and high potential durability of Ta-SnO2-delta-supported Pt catalysts for PEFC cathodes. Electrochem Commun 51:37-40.
36. Avila-Vazquez V, Galvan-Valencia M, Ledesma-Garcia J, Arriaga LG, Collins-Martinez VH, Guzman-Martinez C, Escalante-Garcia IL, Duron-Torres SM (2015) Electrochemical performance of a Sb-doped SnO2 support synthesized by coprecipitation for oxygen reactions. J of Appl Electrochemi 45(11):1175-1185.
37. Leite ER, Weber IT, Longo E, Varela JA (2000) A new method to control particle size and particle size distribution of SnO2 nanoparticles for gas sensor applications. Adv Mater 12 (13):965-+.
38. Tauster S. J, Fung SC (1978) Strong Metal-Support Interactions - Occurrence among Binary Oxides of Groups IIA-VB. J Catal 55 (1):29-35.
39. Kamiuchi N, Matsui T, Kikuchi R, Eguchi K (2007) Nanoscopic observation of strong chemical interaction between Pt and tin oxide. J Phys Chem C 111 (44):16470-16476.
40. Spencer MS (1985) Models of Strong Metal Support Interaction (SMSI) in Pt on TiO2 Catalysts. J Catal 93 (2):216-223.
41. Daio T, Staykov A, Guo LM, Liu JF, Tanaka M, Lyth SM, Sasaki K (2015) Lattice Strain Mapping of Platinum Nanoparticles on Carbon and SnO2 Supports. Sci Rep 5:13126.
42. Ouattara-Brigaudet M, Beauger C, Berthon-Fabry S, Achard P (2011) Carbon Aerogels as Catalyst Supports and First Insights on Their Durability in Proton Exchange Membrane Fuel Cells. Fuel Cells 11 (6):726-734.
43. Ouattara-Brigaudet M, Berthon-Fabry S, Beauger C, Chatenet M, Job N, Sennour M, Achard P (2012) Influence of the carbon texture of platinum/carbon aerogel electrocatalysts on their behavior in a proton exchange membrane fuel cell cathode. Int J Hydrog Energy 37 (12):9742-9757.
44. Fabbri E, Rabis A, Kotz R, Schmidt TJ (2014) Pt nanoparticles supported on Sb-doped SnO2 porous structures: developments and issues. Phys Chem Chem Phys 16 (27):13672-13681.
45. Rabis A, Kramer D, Fabbri E, Worsdale M, Kotz R, Schmidt TJ (2014) Catalyzed SnO2 Thin Films: Theoretical and Experimental Insights into Fabrication and Electrocatalytic Properties. J Phys Chem C 118 (21):11292-11302.
46. Muller V, Rasp M, Stefanic G, Ba JH, Gunther S, Rathousky J, Niederberger M, Fattakhova-Rohlfing D (2009) Highly Conducting Nanosized Monodispersed Antimony-Doped Tin Oxide Particles Synthesized via Nonaqueous Sol-Gel Procedure. Chem of Mater 21 (21):5229-5236.
47. Mulla IS, Soni HS, Rao VJ, Sinha APB (1986) Deposition of Improved Optically Selective Conductive Tin Oxide-Films by Spray Pyrolysis. J Mater Sci 21 (4):1280-1288.
48. Bruneaux J, Cachet H, Froment M, Messad A (1994) Structural, electrical and interfacial properties of sprayed SnO2 films. Electrochim Acta 39 (8-9):1251-1257.
49. Lee KS, Park IS, Cho YH, Jung DS, Jung N, Park HY, Sung YE (2008) Electrocatalytic activity and stability of Pt supported on Sb-doped SnO2 nanoparticles for direct alcohol fuel cells. J Catal 258 (1):143-152.
50. Gurrola MP, Gutierrez J, Rivas S, Guerra-Balcazar M, Ledesma-Garcia J, Arriaga LG (2014) Evaluation of the corrosion of Sb-doped SnO2 supports for electrolysis systems. Int J Hydrog Energy 39 (29):16763-16770.
51. Godinho KG, Walsh A, Watson GW (2009) Energetic and Electronic Structure Analysis of Intrinsic Defects in SnO2. J Phys Chem C 113 (1):439-448.
52. Terrier C, Chatelon JP, Berjoan R, Roger JA (1995) Sb-Doped SnO2 Transparent Conducting Oxide from the Sol-Gel Dip-Coating Technique. Thin Solid Films 263 (1):37-41.
53. Terrier C, Chatelon JP, Roger JA (1997) Electrical and optical properties of Sb:SnO2 thin films obtained by the sol-gel method. Thin Solid Films 295 (1-2):95-100.
54. Lekshmy SS, Daniel GP, Joy K (2013) Microstructure and physical properties of sol gel derived SnO2:Sb thin films for optoelectronic applications. Appl Surf Sci 274:95-100.
55. Las WC, Dolet N, Dordor P, Bonnet JP (1993) Influence of Additives on the Electrical-Properties of Dense SnO2-Based Ceramics. J Appl Phys 74 (10):6191-6196.
56. Caldararu M, Thomas MF, Bland J, Spranceana D (2001) Redox processes in Sb-containing mixed oxides used in oxidation catalysis I. Tin dioxide assisted antimony oxidation in solid state. Appl Catal a-General 209 (1-2):383-390.
57. Barsan N, Weimar U (2001) Conduction model of metal oxide gas sensors. J Electroceramics 7 (3):143-167.
58. Senoo Y, Kakinuma K, Uchida M, Uchida H, Deki S, Watanabe M (2014) Improvements in electrical and electrochemical properties of Nb-doped SnO2-delta supports for fuel cell cathodes due to aggregation and Pt loading. Rsc Adv 4 (61):32180-32188.