HAL Id: hal-02483358
https://hal-mines-albi.archives-ouvertes.fr/hal-02483358
Submitted on 19 Feb 2020HAL is a multi-disciplinary open access archive for the deposit and dissemination of sci-entific research documents, whether they are pub-lished or not. The documents may come from teaching and research institutions in France or abroad, or from public or private research centers.
L’archive ouverte pluridisciplinaire HAL, est destinée au dépôt et à la diffusion de documents scientifiques de niveau recherche, publiés ou non, émanant des établissements d’enseignement et de recherche français ou étrangers, des laboratoires publics ou privés.
Green waste/ wood pellets pyrolysis in a pilot-scale
rotary kiln: effect of temperature on product
distribution and characteristics
Tchini Severin Tanoh, Amina Ait Oumeziane, Jérôme Lemonon, Francisco
Javier Escudero Sanz, Sylvain Salvador
To cite this version:
Tchini Severin Tanoh, Amina Ait Oumeziane, Jérôme Lemonon, Francisco Javier Escudero Sanz, Sylvain Salvador. Green waste/ wood pellets pyrolysis in a pilot-scale rotary kiln: effect of temperature on product distribution and characteristics. Energy and Fuels, American Chemical Society, 2020, 34 (3), pp.3336-3345. �10.1021/acs.energyfuels.9b04365�. �hal-02483358�
Green waste/ wood pellets pyrolysis in a pilot-scale rotary kiln: effect of temperature on product distribution and characteristics
Tchini Séverin TANOH, Amina AIT OUMEZIANE, Jérôme LEMONON, Francisco Javier ESCUDERO SANZ*, Sylvain SALVADOR
Université de Toulouse, IMT Mines Albi, UMR CNRS 5302, Centre RAPSODEE, Campus Jarlard, F-81013 Albi, Cedex 09, France.
Keywords: Garden green waste, Pyrolysis, High-temperature, Products characterization Abstract
In this study, a pilot-scale rotary kiln was used to perform the pyrolysis of garden green waste.
The results are compared to wood pellets (a mixture of oak and beech sawdust). Both samples
have similar organic composition and energy content except for ash content which is around
three times higher in the case of green waste. Pyrolysis tests were performed at different
temperatures ranging from 700 to 900°C. The study of the products yields as a function of
temperature showed that above 700°C, volatile matter (gas and bio-oil) yields were higher than
80 wt.% and syngas (CO+H2) concentration was higher than 59 mol.%. On the other hand, the
char yield was below 20 wt. % with an HHV of 29 MJ/kg and an 80% carbon content. Tar
quantitative gas chromatography/mass spectrometry (GC/MS) analysis showed the
predominance of benzene and naphthalene. Hence, this work revealed and validated the
relevance of green waste thermochemical conversion for syngas production. In addition, this
investigation can support the optimization of operating parameters and energy efficiency of a
1. Introduction
Syngas (CO, H2, CO2…) production via thermochemical conversion of biomass using processes
such as pyrolysis and gasification has known a significant growth recently. The produced syngas can be converted into fuels like methane which can largely contribute to conventional
energies substitution and climate change mitigation. However, the major problem encountered
during pyrolysis and gasification processes is tar formation, which alters the quality of the
producer gas and limits its use. Hence, tar removal and the increase of gaseous products yield
from biomass are serious challenges. The two-stage combined pyrolysis-gasification appears to
be effective for thermochemical biomass conversion producing an important gas yield, low tar
contents and high biomass conversion rates1,2. In a combined pyrolysis-gasification process,
biomass is pyrolyzed in the first stage and the pyrolysis gases (volatile products) are gasified
or reformed in the second one3,4. Therefore, in such a coupled process, pyrolysis is a crucial
initial step. It is a process in which the biomass is thermally converted, in the absence of
additional external oxygen, into bio-oil, gas and char. The pyrolysis products yield and quality
vary as a function of conditions which are linked to the reactor, biomass types and
characteristics as well as the operating parameters namely, temperature, pressure, heating rate,
residence time, etc…5–7. Among the process parameters which affect the pyrolysis products,
the temperature is a key one because it influences both quantity8 and quality of the products 9,10.
It is possible to maximise the product yield of one or two products as a function of the
temperature. Several researchers have studied the influence of temperature on pyrolytic
products of biomass using various reactors11–13 because the level of heat and mass transfer
depends strongly on the reactor type. Aside from the commonly used ones such as tubular
reactors, screw reactors, fixed-bed and fluidized-bed reactors, rotary kilns were also used for
However, studies reporting on wood and green waste at high-temperature pyrolysis in a
pilot-scale rotary kiln in order to maximize volatile matter yield with detailed characterization of gas,
tar and char composition are really scarce.
Li et al16 evaluated the influence of temperature (550-850°C) on pyrolysis products of wood in
a laboratory-scale rotary kiln. This study gave the product yields of wood pyrolysis. However,
their investigations did not include gas analysis and tar composition. In another work, Li et al17
used the same rotary kiln to study the characteristics of gases produced by pyrolysis of various
municipal solid wastes including wood under different operating conditions. Kabir et al18
presented an experimental and numerical approach to study the pyrolysis of municipal green
waste. The experimental pyrolysis was performed at a final temperature of 500°C in a rotary
furnace. Mass balance of the process was established, but gas, tar and char were not
characterized.
The purpose of this work is to analyze pyrolysis process at high-temperature (from 700 to
900°C) in order to maximise the pyrolysis gases (volatiles) yield. Experiments were performed
with green waste and wood pellets in a pilot-scale rotary kiln with a feedstock mass flow rate
of 6 kg/h. Product yields from both biomass sources were determined. Gas composition, tar
qualitative then quantitative analysis, as well as char characterization, were performed. Their
variation is thoroughly studied as a function of the reactor temperature. Furthermore, the
2. Materials and methods
2.1 Biomass and characterization methods
Green waste and a mixture of oak and beech sawdust were selected. Green waste was supplied
by the French company AGRI 2000. It consists of garden waste which contains mostly small
branches. Its availability and abundance in France were demonstrated recently by Solagro and
E&E Consultant investigations19. It was ground and pelletized into uniform cylindrical pellets
with a diameter of 6 mm, a length between 6 and 10 mm and an apparent pellet density of 624
kg/m3.
Wood pellets (uniform mixture of oak and beech sawdust) which were produced by the French
company S.C.A DE DESHYDRATION DE LA HAUTE-SEINE, were considered as biomass
of reference. The wood cylindrical pellets have a diameter of 6 mm, a length between 11 and
15 mm and an apparent density of 688 kg/m3.
2.1.1 Ultimate and proximate analysis
According to the French standard NF V 03-921, the moisture content was determined by weight
difference after drying a biomass sample for 2h at 105°C. The French standard NF MO3-004
was used to evaluate volatile matter contents. A biomass sample was ground and placed in a
preheated furnace at 900 ± 5°C during 7 min. For ash content evaluation, the French standard
NF MO3-004 was used. A ground biomass sample was introduced into an oven heated from
room temperature to 550°C and then maintained at 550°C for 3h. Char characterization was the
same to biomass except for ash content which was determined at 815°C. The fixed carbon
content was deduced by difference.
An elementary analyzer CHNS-O (FLASH 2000) was used for ultimate analysis. Oxygen
content was determined by difference. To determine the composition of the inorganic (metals
220°C during 24h. H2O2, acid reagents HNO3 and HF were used according to the standard EN
16967. Acid solutions were diluted with demineralized water to 50 ml and analyzed using
HORIBA Jobin Yvon Ultuma 2 inductively coupled plasma optical emission spectrometer
(ICP-OES).
2.1.2 Higher heating value (HHV)
The HHV was obtained with the calorimetric bomb IKA C5000. A mass of 500 mg of dried
biomass or char was introduced into the calorimetric bomb to undergo a combustion reaction.
The Lower Heating Value (LHV) was determined using the relationship between the HHV and
LHV 20 according to equation 1:
𝐿𝐻𝑉 = 𝐻𝐻𝑉 ― ℎ𝑔(9𝐻/100 + 𝑀/100) (1)
Where H, hg and M are hydrogen percentage, water latent heat of vaporization (2260 kJ/kg) and
moisture percentage respectively.
2.1.3 Composition analysis
Biomass extractives, hemicelluloses and lignin content were determined following the protocol
of Li et al.21 as well as the standards TAPPI T204 om-88 and TAPPI T22 om-88. The cellulose
content was determined by difference. Biomass samples were previously ground to obtain a
particle size below 500 μm.
Extractives quantification
Extractives were obtained from about 3g of a dried biomass sample (m0) using acetone and a
Soxhlet extractor during 6h. Afterwards, the residue was mixed with distilled water placed in a
flask above a reflux system. Then, it was brought to boiling during 1h. Finally the residue was
dried in an oven at 105°C and weighted to obtain the mass (m1). The extractives wt.% were
𝐸𝑥=
𝑚0― 𝑚1
𝑚0 100
(2)
The same biomass residue obtained from this experiment is used to determine the hemicellulose
and lignin contents
Hemicellulose quantification
A volume of 150 mL of a 20g/L NaOH solution was added to approximately 1g (m2) of the
residue obtained from the extractives analysis. The mixture was boiled for 3.5 h with a reflux
system. The resulting solid was filtered, washed 4 times with 150 mL of distilled water to
remove Na+. Then the residue was put in an oven to dry at 105°C. Finally, it was weighted to
obtain the mass (m3). The hemicellulose (wt.%) was calculated according to equation 3:
𝐻𝑥=
𝑚3― 𝑚2
𝑚2 (100 ― 𝐸𝑥)
(3)
Lignin quantification
30 mL of 72% sulphuric acid solution was slowly added to approximately 1g (m4) of the residue
obtained from the extractives analysis. The mixture was maintained at 7°C for 2h. Then a
volume of 300 mL of distilled water was added and the whole boiled during 1 h with a reflux
system. Finally, the residue was filtered, washed 3 times with 150 mL of distilled water to
remove sulphate ions. To obtain the mass (m5), the residue was dried at 105°C and weighed.
The lignin content was determined according to equation 4:
𝐿𝑥= 𝑚5/𝑚4(100 ― 𝐸𝑥) (4)
Cellulose quantification
The cellulose was deduced by difference according to equation 5:
2.2 Pyrolysis process
Pyrolysis experiments were carried out in the RAPSODEE centre pilot-scale rotary kiln (Figure
1). It consists of a 4.2 m long cylinder of 0.210 m internal diameter and a 2.5 m effective heated
length. Its inner wall is covered by a metal grid. Its inclination can vary between 0° and 7° and
its rotational speed between 1 and 21 rpm. In order to work in conditions closed to industrial
ones and be able to optimize energy efficiency, we have chosen to maintain solid residence time
inferior to 1 h22. It was obtained under ambient temperature conditions by combining different
inclinations (1.5-3°) and rotational speeds (2-3 rpm). Presenting the results of all the tested
combinations is not relevant for this paper. The couple retained for all the pyrolysis experiments
is an inclination of 3° with a rotation speed of 3 rpm, which gives a solid residence time of 38
min in the case of wood pellets and 41 min for green waste pellets. The tube is divided into five
zones and the reactor is heated by its electrical resistances with a power of 38 kW. Three ‘K’
thermocouples were positioned inside the reactor. The maximum working temperature of the
reactor was 1000°C (with a heating rate of 6°C/min). The hopper where the biomass is initially
introduced has a capacity of 26 kg. The biomass can be transported from there to the cylinder
inlet through a vibrating conveyor. The overall feeding system is continuously weighed. The
control of the conveyor vibration amplitude allows the regulation of the biomass inlet mass
flow rate. At the other end of the cylinder, a metal pot is used to collect the produced char.
2.3 Pyrolysis protocol
In all experiments, biomass mass flow rate of approximately 6 kg/h was fed into the reactor. It
seemed reasonable to assume that steady-state will be reached after a period of time estimated
at three folds the solid residence time. Figure 2 confirms actually this estimation, so for all the
experiments, whatever the temperature 700, 800 or 900°C, biomass feeding into the reactor
started 2 h before the char collection and the gas and bio-oil sampling. The char collection, as
the char metal pot is replaced with an empty one. Simultaneously the gas analysis and bio-oil
sampling are started. Once the 45 min is over, the gas analysis and bio-oil sampling are stopped
along with biomass feeding. The hopper weight is noted and the char metal pot is replaced.
Char is kept under nitrogen flow then weighted. For both biomasses, every single experiment
was conducted twice to ensure the repeatability. The relative error was less than 5%
Figure 1: Schematic representation of the rotary kiln pyrolysis reactor connected to the gas and tar sampling and analysis system. 1: feeding hopper, 2: vibrating conveyor, 3: weighing
system, 4: rotating cylinder, 5: char recovering tank, 6: smoke box
2.4 Gas and tar sampling and analysis
The condensing system consisted of six impinger bottles connected in series. 300-400 mL of
isopropanol was added to each bottle, except for the fifth which was left empty and the last one
which was filled with silica gel. The gas and bio-oil sampling were performed at a flow rate of
2 L/min using a rotameter. The gas chromatograph (490 Micro GC, Agilent) was used to
analyse the non-condensable gases (H2, CO, CH4, CO2,…). Gas concentrations were calculated
on nitrogen-free basis. The nitrogen gas (4NL/min) was used as a tracer for mass balance. To
establish the mass balance, the sampled bio-oil flow rate was determined by weighting the
condensation system (with isopropanol) before and after the pyrolysis process. The flow rate of
the sampled permanent gases was determined by a gas counter meter. The mass flow-rate and
yield of permanent gases at the reactor outlet were calculated using data from the micro-GC
𝑚𝑔𝑝= 𝑚𝑁2 𝑌𝑁2 ― 𝑚𝑁2 (6) 𝜂𝑔𝑝= 𝑚𝑔𝑝 𝑚𝑏𝑖𝑜𝑚𝑎𝑠𝑠 𝑑𝑎𝑓 (7)
Where YN2 and 𝑚𝑁2 are the nitrogen mass fraction in the permanent gases and mass flow rate
respectively. 𝑚𝑏𝑖𝑜𝑚𝑎𝑠𝑠 𝑑𝑎𝑓 is the biomass mass flow rate on dry ash-free basis. ηgp and 𝑚𝑔𝑝 are
the permanent gases yield (wt. % daf ) and mass flow rate respectively.
The bio-oil mass flow rate and its yield were determined by equation 8:
𝑚𝑏𝑖𝑜 ― 𝑜𝑖𝑙= 𝑚𝑔𝑝
𝑚𝑏𝑖𝑜 ― 𝑜𝑖𝑙. 𝑠𝑎𝑚𝑝𝑙𝑒𝑑.
𝑚𝑔𝑝. 𝑠𝑎𝑚𝑝𝑙𝑒𝑑.
(8)
is bio-oil mass flow rate. 𝑚𝑏𝑖𝑜 ― 𝑜𝑖𝑙
The char was collected and weighted to determine its mass flow rate and yield according to
equation 9.
ηchar and 𝑚𝑐ℎ𝑎𝑟 are the char yield (wt. % daf ) and mass flow rate respectively.
For all experiments, the mass balance was closed to 85-94%. The non-closure can be attributed
to the premature cooling of bio-oil within the flow paths. It can also be due to the fact that light
hydrocarbons contained in the analyzed gas might go undetected. Furthermore, during the
impinger bottles weighing at room temperature, the volatilization of the light compounds
contained in the bio-oil might also occur. In this study, the lacking amount in the mass balance
was assumed to be essentially due to the premature cooling of bio-oil. Indeed, to prevent any
overpressure in the reactor, a rupture disc has been installed at the reactor outlet limiting the
electrical tracing of this zone (6 on Figure 1) to 200°C. Hence, the mass balance closure was
ensured by adding the lacking mass to the bio-oil. The produced pyrolysis liquid fraction (bio-𝜂𝑐ℎ𝑎𝑟=
𝑚𝑐ℎ𝑎𝑟
oil), is defined as the sum of organic liquid (tar), water pyrolytic and water in feedstock. In
order to compare the results of the two biomasses, the mass balance was calculated on dry
ash-free (daf) basis.
Figure 2: Gas composition variation with time 2.5 Bio-oil analysis
For reminder, what is called bio-oil is a tar and water mixture.
2.5.1 Water content determination
Water content in bio-oil was measured by Karl Fisher (METTLER TOLEDO V30) titration
using HYDRANAL methanol dry as solvent and HYDRANAL Composite 5 as titrant.
Pyrolytic water (ηwater)and tar (ηtar) yields were then determined according to equation 10 and
11: 𝜂𝑊𝑎𝑡𝑒𝑟= 𝑚𝑏𝑖𝑜 ― 𝑜𝑖𝑙 𝑊𝐾 100― 𝑚0 𝐻0 100 𝑚𝑏𝑖𝑜𝑚𝑎𝑠𝑠 𝑑𝑎𝑓 (10) 𝜂𝑇𝑎𝑟= 𝑚𝑏𝑖𝑜 ― 𝑜𝑖𝑙
(
1 ― 𝑊𝐾 100)
𝑚𝑏𝑖𝑜𝑚𝑎𝑠𝑠 𝑑𝑎𝑓 (11)Where mO and 𝐻0 are initial mass flowrate of biomass (kg/h) and humidity in the biomass
(wt.%) respectively. WK is the water content in condensates determined by Karl Fischer
analysis (wt.%).
2.5.2 Bio-oil analysis by GC/MS
The analysis of bio-oil was performed using a Shimadzu GCMS-TQ 8030 (Tokyo. Japan) Gas
Chromatograph Mass Spectrometer. Chromatographic separation was performed on a Rxi-5Sil
MS (30 m x 0.25 mm, 0.25 µm film thickness, Resteck) column using helium as a carrier gas
at a 3.0 mL/min constant flow. The column oven temperature evolution was programmed as
follows: first, it was set at an initial value of 40°C which was held for 5 min. After that 280°C
was reached (with a 5°C/min rate) and maintained for 2 min. A volume of 1µL was injected at
250°C in split mode using 1:10 split ratio. The mass spectrometer was operated in the electron
impact (EI) ionization mode (electron energy was 70 eV). The interface and ion source
temperatures were respectively set at 260°C and 200°C. For qualitative analysis, the detection
was performed in full scan mode in a 35-600 m/z range. It is important to note that the tar
composition determination is extremely complex given the high number of species to identify.
In this study, compounds with a surface area greater than 2% and some compounds with a
surface area of less than 2% but very specific to one of the two biomasses, were taken into
consideration. For quantitative analysis, the selected ion monitoring (SIM) detection mode was
performed with 3 qualifier ions for each component. The amount of each component was
determined by an external standard method with 10 standard samples (Benzene, toluene,
m-cresol, m,p-xylene, styrene, naphthalene, fluorene, biphenyl and phenol). The compounds were
quantified using calibration curves, which were produced by an analysis of pure substances by
3. Results and discussion
3.1 Samples characteristics
The two biomass samples chemical composition, their proximate and ultimate analysis along
with their energy content are listed in Table 1. The moisture contents of the two biomasses
were 7.32 wt% for green waste and 7.75 wt.% for wood. The biomasses show similar
characteristics. However, the ash content of green waste pellets (2.69 wt.%) was higher than
that in wood pellets (0.88 wt%). The effects of mineral matter on volatile and char yields
obtained during biomass pyrolysis have been extensively studied in literature 23,24. Raveendran
et al 23 concluded that the mineral matter of biomass, in combination with the organic
composition, plays a major role in determining pyrolysis product distribution and product
properties. Whereas the organic composition of the two biomasses is similar, their mineral
composition presents actually some differences. Indeed, Green waste has more alkali (K),
Table 1: Analyses of pellets sample
Green waste pellets Wood pellets
Proximate analysis (wt.% dry basis)
Volatile matter 79.31 82.48
Ash 2.69 0.88
Fixed carbon 18.00 16.64
Ultimate analysis (wt.% dry ash-free)
C 50.20 49.76 H 5.76 5.96 N 0.36 0.14 O1 43.68 44.14 H/C2 1.38 1.44 O/C2 0.65 0.67
Chemical Analysis (wt.% dry basis)
Extractives 8.81 9.99
Lignin 27.78 26.08
Hemicelluloses 24.04 26.29
Cellulose 39.36 37.64
Inorganic elements (mg/kg of biomass dry basis )
Iron (Fe) 391.77 89.07 Calcium (Ca) 2070 838.53 Potassium(K) 163.72 94.40 Magnesium(Mg) 220.24 45.88 Silicon (Si) 1218.41 127.86 Energy content HHV (MJ/kg) 19.25 19.51 HHV(MJ/kg daf) 19.78 19.68 1 by difference 2 molar ratio
3.2 Effect of temperature on products yield
Figure 3 displays the two biomasses product yields as a function of temperature (700-900°C).
As expected, the temperature increase results in gas yield increase along with tar, water and
char reduction. Those results are in agreement with the well known fact of gas production
enhancement by high temperatures. Indeed, it is reported in the literature that the secondary
reactions such as thermal cracking, repolymerization and recondensation are favored by the
temperature increase11,25. Whereas the gas yield from green waste increases from 45 to 61 wt.
% daf, the one produced by wood increases from 45 to 59 wt.% daf. The increase of green waste
gas yield between 800-900°C is clearly more significant than that of wood. Since the two
biomasses have similar organic composition, the discrepancy observed in gas yield can be
attributed to ash amount and composition. As mentioned previously, green waste contains more
ash. Juchelkovà et al26 reported that ash content can be associated with the increase in pyrolysis
gas production. The alkali (K) and alkaline earth metals such as Ca and Mg may catalyse the
thermal degradation of biomass.
The evolution with temperature of water and tar yields produced from each biomass is
represented in Figure 3. Less tar (12 wt.% daf at 700°C) and more water are produced with
wood. In addition, the tar yield, 8 wt.% daf, remains constant between 800°C and 900°C. Tar
amount produced from green waste decreases slowly from 15.8 to 12.9 wt.% daf between 700°C
and 800°C to reach 9.2 wt.% at 900°C. Globally, between 700 and 900°C, tar yields from green
waste and wood decreases by 42% and 33% respectively. Compared to wood, the significant
reduction of tar yield in the case of green waste may also be caused by mineral content27. The
decrease of tar and water with the increase of temperature might be due to steam reforming
reactions which favour gas production. According to Di Blasi 6, water is a product of the
evaluate the extent of cracking reactions. However, water consumption depends on the steam
reforming reaction rate which can be influenced by the presence of inorganic matter28.
The char produced from green waste decreases from 22.4 to 16.9 wt.% daf and the one produced
from wood from 20.4 to 17.4 wt.% daf with wood. These reductions can be explained by
competition between the secondary reactions of char and volatile formation which leads to more
production of light non-condensing gas causing the increase of gas yield6,29.
0 10 20 30 40 50 60 70
Gas Tar Water Char
M as s yi el d (% d af ) 700°C 800°C 900°C (a) 0 10 20 30 40 50 60 70
Gas Tar Water Char
M as s yi el d (% d af ) 700°C 800°C 900°C (b)
3.3 Influence of temperature on gas composition
Figure 4 shows the gas composition (N2 free) under the three considered temperatures. For
both biomasses, carbon monoxide (CO) is the main gas at 700 and 800°C. CO amount from
wood pyrolysis remains almost constant from 800°C to 900°C. The same behavior was
observed by Gao et al 13 between 600 and 900°C. On the other hand, carbon monoxide increases
during green waste pyrolysis from 27.8 % (800°C) to 34.5% (900°C). This can be explained by
the enhancement of the decarbonylation reaction. Hydrogen (H2) content increases with
temperature for both biomasses. For green waste, H2 content increases from 23.5% at 700°C to
36.7 % at 900°C. Similarly, it increases for wood, from 18.9 % at 700°C to 35.93% at 900°C.
This is due to the thermal cracking reactions which are favoured with temperature. According
to Zhang et al30, secondary reactions of tar and char via cracking, steam reforming and char
gasification are responsible for H2 and CO production. CH4 and CO2 concentrations decrease
with increasing temperature for both biomasses. Fagbemi et al11 observed similar tendencies
when they performed wood pyrolysis between 400 and 900°C. They found that in the
700-900°C range, the CO2 concentration decreased from 16.7 to 5.0 %. Similarly, the CH4
concentration decreased from 16 to 12%. In addition, it presented a maximum value around
750°C. De Conto and al. 14 reported that elephant grass pyrolysis presents a maximum releasing
rate of CH4 and CO2 at approximately 500°C. CO2 decreasing could be attributed to the fact
that the majority of it is produced by decarboxylation at low temperatures and dry reforming
reactions at high temperatures. These two reactions could lead to the reduction of CO2
concentration. CH4 content reduction may be due to reforming reactions. The effect of
temperature on C2-C3 concentrations is insignificant from 700 to 800°C but their concentrations
decrease significantly at 900°C. It was reported that high temperature favors the production of
H2 to the detriment of light hydrocarbons (in C2, C3) which are dehydrogenated by thermal
high temperatures, the pyrolysis gases undergo secondary reactions such as tar cracking and
homogeneous reactions. This leads to a much higher production of H2 and CO concentrations.
Many reactions have been identified and published in the literature. Depending on the process
conditions (pressure, temperature…) some reactions can prevail in comparison to others. For
increasing H2 production at atmospheric pressure and a temperature between 700 °C and 900
°C, Yang and al.31 pointed out that the following reactions (R1 to R4) might be favored or not
depending on the type of secondary reactions.
CO + H2O→H2+ CO2 (R1) C + H₂O→CO + H₂ (R2) CmHn+ nH₂O→nCO +
[
n +(
m 2)
]
H₂ (R3) CmHn+ 2nH₂O →nCO₂ +[
2n +(
m 2)
]
H₂ (R4)The increase of H2 production can be an indicator of the secondary reactions significant
occurrence31,32. In this contribution, when comparing the mass balance of both biomasses, no
significant difference is observed. However, the gas composition produced during the pyrolysis
of green waste pellets suggests that cracking and homogeneous reactions are more intense. This
can be explained by the amount of alkaline earth metals in the green waste (Table 1). Indeed,
according to the literature, potassium (K) has the greatest influence on the thermal conversion
properties of biomass especially with its catalytic effect on secondary cracking reactions33–35.
The green waste pellets had more calcium (Ca), Potassium (K) and Iron (Fe) which can
favourably influence the secondary reactions.
The H2/CO ratio increases with the increase of temperature for the two biomasses to reach 1 at
900°C, but it remains much lower than the required ratio for syngas applications, i.e
concentration reaches 70% at 900°C for both biomasses. The lower heating value of the
produced gas has been calculated using the following equation 31.
LHV = 4.2 (30CO + 25.7H2+ 85.4CH4+ 151.3CnHn) (12)
Where CO, H2, CH4 and CnHm are the concentrations (vol.%) of the CO, H2, CH4 and
hydrocarbons (C2H4 and C2H6) respectively. Amongst the C2-C3 hydrocarbons, C2H4 and C2H6
have the highest concentrations. The calculated values are also shown in Table 2. The total gas
products heating value decreased from 16 to 14 MJ/Nm3. This corresponds to an intermediate
level of heat values for gas fuels that can be directly used for gas engines, gas turbines, chemical
formation of methanol and methane.
Table 2: Produced dried gas characteristics
Green waste pellets Wood pellets
T (°C) 700 800 900 700 800 900
Gas mean residence
time (s) 38.42 35.20 30.37 37.54 32.42 31.17 Gas volume (Nm3/kg daf) 0.44 0.57 0.72 0.42 0.57 0.68 H2/CO (mol/mol) 0.84 0.93 1.06 0.50 0.70 1.01 H2+CO (mol%) 51.48 59.73 70.34 55.94 59.89 69.89 LHV (MJ/Nm3) 16.75 16.38 14.08 16.85 16.74 14.39 0 5 10 15 20 25 30 35 40 45 50 600 700 800 900 1000 G as c om po si tio n (v ol .% ) Reactor temperature (°C) H₂ CH₄ CO CO₂ C₂-C₃ (a)
0 5 10 15 20 25 30 35 40 45 50 600 700 800 900 1000 G as c om po si tio n (v ol .% ) Reactor temperature (°C) H₂ CH₄ CO CO₂ C₂-C₃ (b)
Figure 4: Composition of pyrolysis gas produced from green waste (a) and wood (b)
3.4 Char characteristics
Char ultimate and proximate analysis, can be used to extend the understanding of the actual
pyrolysis process.
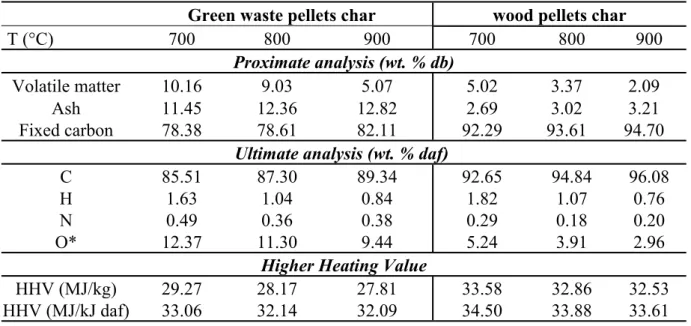
Table 3 reports the results of proximate and ultimate analysis as well as the energy content of
the produced char in the present study. The temperature clearly affects char composition. While
fixed carbon and ash content increase with temperature, the volatile content decreases. This is
consistent with the results reported by Li et al16. Green waste has the highest ash content, the
fixed carbon content of its char is lower than wood char. On the other hand, both of them are
rich in carbon, whose content increases with temperature and is higher in the case of wood.
Furthermore, the oxygen content of wood char is lower than green waste char.
It is reported that inorganic matter can form more stable oxides and minerals on the surface of
char, which can block their degradation 6,27. In addition, Song et al36 showed that during the
interaction of the pyrolysis tar and char, some O-containing species originating from tar are
transferred to the char and form additional O-containing structures in the char matrix. Both
approaches can explain (i) the incomplete degradation of green waste (high volatile content)
High carbon and low oxygen contents are responsible for the high heating values of the resulting
chars. The HHV of green waste char is slightly lower than that of wood char because of the
high oxygen content of green waste char. The HHV remains globally between 28 and 34 MJ/kJ.
The produced char in the present study is a good fuel due to its high heating value, which is
even higher than that of conventional coals (15-27 MJ/kg).
Table 3: Char characterization
Green waste pellets char wood pellets char
T (°C) 700 800 900 700 800 900
Proximate analysis (wt. % db)
Volatile matter 10.16 9.03 5.07 5.02 3.37 2.09 Ash 11.45 12.36 12.82 2.69 3.02 3.21 Fixed carbon 78.38 78.61 82.11 92.29 93.61 94.70
Ultimate analysis (wt. % daf)
C 85.51 87.30 89.34 92.65 94.84 96.08
H 1.63 1.04 0.84 1.82 1.07 0.76
N 0.49 0.36 0.38 0.29 0.18 0.20
O* 12.37 11.30 9.44 5.24 3.91 2.96
Higher Heating Value
HHV (MJ/kg) 29.27 28.17 27.81 33.58 32.86 32.53 HHV (MJ/kJ daf) 33.06 32.14 32.09 34.50 33.88 33.61
3.5 Tar analysis
The GC/MS analysis was used to determine the composition of the tar produced from the
biomass sources. The qualitative analysis was performed prior to quantitative one.
It is worth mentioning that pyrolysis tar composition is the key factor that will determine the
operating conditions for cracking and reforming of pyrolysis vapors. Therefore, The tar
compounds produced from the two biomasses at the three considered temperatures (700, 800,
900°C) are presented in Figure 5 and Table 4 for wood, and Figure 6 and Table 5 for green waste. Whereas the chromatographic peak and the retention time are shown in Figure 5 and
Figure 6, the detailed component analysis, including peak number, compound name and peak
area are gathered in Table 4 and Table 5.
For a clear and meaningful discussion of the presented results, The compounds have been
grouped into the following categories: (i) light aromatics with a single-ring, such as benzene,
toluene; (ii) heterocycles, composed of aromatic rings containing heteroatoms such as phenol;
(iii) light polyaromatic hydrocarbons (PAHs) with 2 or 3 aromatics rings, such naphthalene,
biphenyl, and; (iv) heavy PAHs with more than 3 rings such pyrene, fluorene.
Although the GC/MS analysis does not permit to identify all the compounds, some clear
tendencies can be established between tar from wood and tar from green waste. It can be seen
that tar from green waste contains N-containing compounds such as pyrrole, pyridine,
quinoline, 5-Methylbenzimidazole and indole. This can be related to the high nitrogen content
in the green waste biomass. The peak area of light and heavy PAHs increase from 21.6 to 37.6
% and 3.94 to 16.6 % respectively in the case of the tar produced from green waste. An opposite
tendency is observed in the case of the tar produced from wood.
According to the literature, temperature and residence time increase PAHs formation [44].
However, the two biomasses were pyrolyzed in similar conditions. Therefore ash content which
is the principal difference between green waste and wood composition might be the reason
behind such results. González et al.38 pointed out that feedstock characteristics highly influence
PAHs concentrations. Solar et al 28 observed that liquid obtained with biomass impregnated
with 44 Ni at 900°C contained more fluorene, anthracene and biphenylene.
The peak area of light aromatics with a single-ring, decreases within green waste tar from 60.2
to 45.2%, while it increases within wood tar from 52.1 to 71.95%. The peak area of heterocycles
According to the GC/MS qualitative analysis, one can conclude that light aromatics with a
single-ring and light polyaromatic hydrocarbons (PAHs) with 2 or 3 aromatics rings are the
most important compounds, among those that could be identified, within tars produced from
biomasses. In addition, more heavy PAHs with more than 3 rings are observed within green
waste tars (from 3.94 from 16.62%).
It is important to remember that the GC/MS quantitative analysis was carried out in order to
identify the major tar compounds yield.
Figure 7 presents the yield of each compound identified by a quantitive method. It is important
to mention that tar storage conditions and duration impact the concentrations. In this study, the
tars were stored in a refrigerator at 4°C. The complexity of the analysis (calibration and the
search for the appropriate diluting factor) extended their storage at least one month. The total
tar mass quantified by GC-MS is not equal to the sampled tar total mass. The green waste pellets
total tar mass quantified by GC-MS represents 23.68, 37.38, 48.27 wt.% of the sampled tars at
700, 800, 900°C respectively. For wood pellets, tar total mass quantified by GC/MS represents
26.62, 70.44 and 69.58 wt.% of the sampled tars at 700, 800, 900°C respectively. The tar total
mass recovery by GC/MS becomes better for temperatures above 700°C. To our knowledge tar
quantification in similar conditions to ours has not been reported in the literature to compare
our results with.
Benzene and naphthalene yields increase strongly with temperature increase to exceed 80 wt.%
of the quantified compounds. Our analysis revealed that while phenolics (phenol, m-cresol),
Toluene, styrene, m,o-xylene disappear at 900°C, fluorene and biphenyl appear at the same
temperature. These results are in agreement with the literature which states that while small
molecules (m,o-cresol, m,p-xylene, acetylene…) content decreased gradually with temperature,
heavy molecules become gradually predominante39,40. For instance, Morf et al41 identified
high due to a longer gas residence time in the present work (> 30 s in Table 2). Benzene and
naphthalene yields increase between 700 and 800 but decreased at 900°C. This tendency was
also observed by Dufour et al40 at 1000°C for benzene and from 900°C to 1000°C for
naphthalene. Tar formation and conversion during the pyrolysis or gasification which is a
complex process, has been extensively studied31,34. Most of the studies on the formation and
conversion of tar were carried out on very short residence times, usually less than 10 seconds.
In this study, the gases residence times are more than 30 s (Table 2) that could be responsible
of naphthalene and benzene cracking. This could lead to reactions where benzene can lose the
H+ radical to form phenyl (C
6H5). Two phenyls ring can lead to biphenyl and heavy molecules
formation through the HACA mechanism from biphenyl42. Similarly, according to literature,
naphthalene can be converted to gas and soot 43. Both mechanisms could explain the conversion
of naphthalene and benzene at 900°C at higher residence times compared to the commonly used
Retention time (min)
Figure 5: GC/MS Chromatogram of wood pyrolysis tar obtained at 700, 800, 900°C
Wood- 700°C
Wood- 800°C
Table 4: Main wood tar components at different temperatures
Peak number Compound Wood / area (%)
700 800 900 700 800 900 1 1 1 Benzene 30.95 58.06 71.95 2 2 Toluene 14.87 6.83 3 o-Xylene 1.86 4 3 Styrene or 1,3,5,7-Cyclooctatetraene 4.46 1.65 5 Phenol 5.69 6 3-Hydroxyphenylacetylene 2.75 7 4 2 Indene 5.00 4.05 0.26 8 Phenol, 2-methyl- 3 9 5 3 Naphthalene 14.57 25.26 24.17 10 Naphthalene, 2-methyl- 4.39 11 Biphenyl 0.84 12 Acenaphthene 1.13 13 6 4 Biphenylene 3.54 2.11 2.13 14 7 5 Fluorene 1.62 0.56 0.14 15 8 Phenanthrene 3.50 1.09 16 9 7 Fluoranthene 1.83 0.39 0.35 6 Anthracene 1
Retention time (min)
Figure 6: GC/MS Chromatogram of green waste pyrolysis tar obtained at 700, 800, 900°C
Green Waste- 700°C
Green Waste- 800°C
Table 5: Main Green Waste tar components at different temperatures
Peak number Compound Green Waste/area (%)
700 800 900 700 800 900 1 1 1 Benzene 21.7 34.49 41.14 2 2 2 Pyridine 0.31 0.64 0.19 3 3 Pyrrole 0.42 0.13 4 4 3 Toluene 16.97 11.61 1.27 5 Ethylbenzene 0.7 6 5 p-Xylene or o-Xylene 3.39 0.75 7 6 4 1,3,5,7-Cyclooctatetraene 6.02 3.10 1.5 8 7 5 Phenol 6.65 1.35 0.35 8 Benzofuran 1.21 9 Benzene, 1-ethenyl-4-methyl- 3.45 10 9 6 Benzene, 1-propynyl- 6.04 6.23 1.29 11 Phenol, 2-methyl- 2.29 12 Phenol, 3-methyl- 3.62 13 5-Methylbenzimidazole 0.88 14 Benzene, (1-methyl-2-cyclopropen- 1-yl)-1.22 15 Cycloprop[a]indene, 1,1a,6,6a- tetrahydro-0.76 16 10 7 Naphthalene 10.83 22.01 27.94 11 Quinoline 0.13 12 Indole 0.16 17 13 8 Naphthalene, 2-methyl- 4.05 1.99 0.61 18 14 9 Naphthalene, 1-methyl- 2.47 0.95 0.37 19 15 10 Biphenyl 0.69 1 0.92 16 12 Acenaphthene 0.45 0.28 17 11 Acenaphthylene 4.95 7.06 18 13 Dibenzofuran 0.68 0.46 20 Naphthalene, 2-ethenyl- 0.93 21 Acenaphthylene 2.67 22 19 14 Fluorene 1.1 2.08 0.97 23 20 15 Phenanthrene 2.08 4.05 6.43 16 Anthracene 1.35 24 21 17 Fluoranthene 0.76 1.80 3.55 18 Pyrene 3.83 22 19 Triphenylene 0.25 0.46
0 5 10 15 20 25 30 35 40 Ta r yi el d (g /k g of b io m as s da f) 700 800 900 (a) 0 5 10 15 20 25 30 35 40 Ta r yi el d (g /k g of b io m as s da f) 700 800 900 (b)
Figure 7: Green waste pellets (a) and wood pellets (b) tar species yields as a function of the reactor temperature.
4. Conclusion
In this study, pyrolysis of green waste and wood was conducted in a pilot-scale rotary kiln at
different temperatures: 700, 800 and 900°C. The green waste used had physicochemical
properties similar to that of wood (a mixture of oak and beech). However green waste pellets
contained more ash and ash composition varied from one biomass to the other. The process
mass balance was established, followed by a thorough analysis and characterization of the
products gas, tar and char. The pyrolysis temperature had an important effect on product yields.
80 wt. % of volatile matter (gas and bio-oil) have been produced under 800°C. The pyrolysis
temperature also impacted the gas composition. At 900°C, H2 and CO increase to reach 36.7
and 34.5 vol. % respectively with green waste and 35.9 and 35.3 vol. % respectively with wood.
The compositions of tars produced from both biomasses were affected by the pyrolysis
conditions. Their qualitative analysis revealed the domination of light aromatics with a
single-ring and light polyaromatic hydrocarbons (PAHs) with 2 or 3 aromatics single-rings. Benzene and
naphthalene were quantitatively the most important tar compounds. In addition to a high heating
value exceeding 29 MJ/kg, the obtained char had over 80 wt. % of carbon content. This char
can be a source of carbonaceous solid materials for other applications such as soil amendment,
reducing agent in metallurgy industry, etc. The effects of high mineral content in green waste
on the product yields and composition were discussed to explain some of the major
discrepancies (gas yield and tar composition) between green waste and wood pyrolysis
products. In future work, these results will be used to find optimal conditions for a subsequent
Corresponding Author
*javier.escuderosanz@mines-albi.fr, IMT Mines Albi, UMR CNRS 5302, Centre
RAPSODEE, Campus Jarlard, F-81013 Albi, cedex 09, France
Acknowledgements
The authors would like to acknowledge financial support provided by ADEME (1703C0064)
and Occitanie Region (ESR_R&F_DF-000043/2017-006713). The authors would like to thank
Mr Maxime ROJAS with whom we started this research and colleagues at RAPSODEE
References
(1) Waheed, Q. M. K.; Williams, P. T. Hydrogen Production from High Temperature Pyrolysis/Steam Reforming of Waste Biomass: Rice Husk, Sugar Cane Bagasse, and Wheat Straw. Energy & Fuels 2013, 27 (11), 6695–6704. https://doi.org/10.1021/ef401145w.
(2) Zeng, X.; Dong, Y.; Wang, F.; Xu, P.; Shao, R.; Dong, P.; Xu, G.; Dong, L. Fluidized Bed Two-Stage Gasification Process for Clean Fuel Gas Production from Herb Residue: Fundamentals and Demonstration. Energy & Fuels 2016, 30 (9), 7277–7283. https://doi.org/10.1021/acs.energyfuels.6b00765.
(3) Wang, N.; Chen, D.; Arena, U.; He, P. Hot Char-Catalytic Reforming of Volatiles from MSW Pyrolysis. Appl. Energy 2017, 191, 111–124. https://doi.org/10.1016/j.apenergy.2017.01.051.
(4) Wang, Y.; Namioka, T.; Yoshikawa, K. Effects of the Reforming Reagents and Fuel Species on Tar Reforming Reaction. Bioresour. Technol. 2009, 100 (24), 6610–6614. https://doi.org/10.1016/j.biortech.2009.07.026.
(5) Solar, J.; de Marco, I.; Caballero, B. M.; Lopez-Urionabarrenechea, A.; Rodriguez, N.; Agirre, I.; Adrados, A. Influence of Temperature and Residence Time in the Pyrolysis of Woody Biomass Waste in a Continuous Screw Reactor. Biomass and Bioenergy 2016,
95, 416–423. https://doi.org/10.1016/j.biombioe.2016.07.004.
(6) Di Blasi, C. Combustion and Gasification Rates of Lignocellulosic Chars. Progress in
Energy and Combustion Science. 2009. https://doi.org/10.1016/j.pecs.2008.08.001.
(7) Barr, M. R.; Volpe, R.; Kandiyoti, R. Influence of Reactor Design on Product Distributions from Biomass Pyrolysis. ACS Sustain. Chem. Eng. 2019, 7 (16), 13734– 13745. https://doi.org/10.1021/acssuschemeng.9b01368.
(8) Neves, D.; Thunman, H.; Matos, A.; Tarelho, L.; Gómez-Barea, A. Characterization and Prediction of Biomass Pyrolysis Products. Prog. Energy Combust. Sci. 2011, 37 (5), 611–630. https://doi.org/10.1016/j.pecs.2011.01.001.
(9) Fantozzi, F.; Colantoni, S.; Bartocci, P.; Desideri, U. Rotary Kiln Slow Pyrolysis for Syngas and Char Production From Biomass and Waste—Part I: Working Envelope of the Reactor. J. Eng. Gas Turbines Power 2007, 129 (4), 901. https://doi.org/10.1115/1.2720521.
(10) Li, A. M.; Li, X. D.; Li, S. Q.; Ren, Y.; Chi, Y.; Yan, J. H.; Cen, K. F. Pyrolysis of Solid Waste in a Rotary Kiln: Influence of Final Pyrolysis Temperature on the Pyrolysis Products. J. Anal. Appl. Pyrolysis 1999, 50 (2), 149–162. https://doi.org/10.1016/S0165-2370(99)00025-X.
(11) Fagbemi, L.; Khezami, L.; Capart, R. Pyrolysis Products from Different Biomasses: Application to the Thermal Cracking of Tar. Appl. Energy 2001, 69 (4), 293–306. https://doi.org/10.1016/S0306-2619(01)00013-7.
(12) Dufour, A.; Girods, P.; Masson, E.; Rogaume, Y.; Zoulalian, A. Synthesis Gas Production by Biomass Pyrolysis: Effect of Reactor Temperature on Product Distribution. Int. J. Hydrogen Energy 2009, 34 (4), 1726–1734. https://doi.org/10.1016/j.ijhydene.2008.11.075.
at Different Pyrolysis Temperatures and Solid Residence Times. J. Anal. Appl. Pyrolysis
2015, 114, 155–162. https://doi.org/10.1016/j.jaap.2015.05.011.
(14) De Conto, D.; Silvestre, W. P.; Baldasso, C.; Godinho, M. Performance of Rotary Kiln Reactor for the Elephant Grass Pyrolysis. Bioresour. Technol. 2016, 218, 153–160. https://doi.org/10.1016/j.biortech.2016.06.082.
(15) Kern, S.; Halwachs, M.; Kampichler, G.; Pfeifer, C.; Pröll, T.; Hofbauer, H. Rotary Kiln Pyrolysis of Straw and Fermentation Residues in a 3 MW Pilot Plant - Influence of Pyrolysis Temperature on Pyrolysis Product Performance. J. Anal. Appl. Pyrolysis 2012,
97, 1–10. https://doi.org/10.1016/j.jaap.2012.05.006.
(16) Li, A. M.; Li, X. D.; Li, S. Q.; Ren, Y.; Chi, Y.; Yan, J. H.; Cen, K. F. Pyrolysis of Solid Waste in a Rotary Kiln: Influence of Final Pyrolysis Temperature on the Pyrolysis Products. J. Anal. Appl. Pyrolysis 1999, 50 (2), 149–162. https://doi.org/10.1016/S0165-2370(99)00025-X.
(17) Li, A. M.; Li, X. D.; Li, S. Q.; Ren, Y.; Shang, N.; Chi, Y.; Yan, J. H.; Cen, K. F. Experimental Studies on Municipal Solid Waste Pyrolysis in a Laboratory-Scale Rotary Kiln. Energy 1999, 24 (3), 209–218. https://doi.org/10.1016/S0360-5442(98)00095-4. (18) Kabir, M. J.; Chowdhury, A. A.; Rasul, M. G. Pyrolysis of Municipal Green Waste: A
Modelling, Simulation and Experimental Analysis. Energies 2015, 8 (8), 7522–7541. https://doi.org/10.3390/en8087522.
(19) E&E Consultant et SOLAGRO. Valorisation Des Dechets Verts En France.
FranceAgriMer. May 2015, pp 1–16. https://doi.org/N° ISSN 2259-0161.
(20) Prabir, B. Biomass Gasification and Pyrolysis Pratical Design; 2010; pp 27–63. https://doi.org/10.1016/B978-0-12-374988-8.00002-7.
(21) Li, S.; Xu, S.; Liu, S.; Yang, C.; Lu, Q. Fast Pyrolysis of Biomass in Free-Fall Reactor for Hydrogen-Rich Gas. Fuel Process. Technol. 2004, 85, 1201–1211. https://doi.org/10.1016/j.fuproc.2003.11.043.
(22) Phounglamcheik, A.; Babler, M. U.; Donaj, P.; Amovic, M.; Ljunggren, R.; Engvall, K. Pyrolysis of Wood in a Rotary Kiln Pyrolyzer: Modeling and Pilot Plant Trials. Energy
Procedia 2017, 105, 908–913. https://doi.org/10.1016/J.EGYPRO.2017.03.413.
(23) Raveendran, K.; Ganesh, A.; Khilar, K. C. Influence of Mineral Matter on Biomass Pyrolysis Characteristics. Fuel 1995. https://doi.org/10.1016/0016-2361(95)80013-8. (24) Collard, F. X.; Blin, J.; Bensakhria, A.; Valette, J. Influence of Impregnated Metal on
the Pyrolysis Conversion of Biomass Constituents. J. Anal. Appl. Pyrolysis 2012. https://doi.org/10.1016/j.jaap.2012.02.009.
(25) Fassinou, W. F.; Van de Steene, L.; Toure, S.; Volle, G.; Girard, P. Pyrolysis of Pinus Pinaster in a Two-Stage Gasifier: Influence of Processing Parameters and Thermal Cracking of Tar. Fuel Process. Technol. 2009, 90 (1), 75–90. https://doi.org/10.1016/j.fuproc.2008.07.016.
(26) Juchelková, D.; Corsaro, A.; Hlavsová, A.; Raclavská, H. Effect of Composting on the Production of Syngas during Pyrolysis of Perennial Grasses. Fuel 2015. https://doi.org/10.1016/j.fuel.2015.03.061.
Feedstock Composition and Taxonomy on the Products Distribution from Pyrolysis of Nine Herbaceous Plants. Fuel Process. Technol. 2016.
https://doi.org/10.1016/j.fuproc.2015.11.022.
(28) Solar, J.; Caballero, B.; De Marco, I.; López-Urionabarrenechea, A.; Gastelu, N. Optimization of Charcoal Production Process from Woody Biomass Waste: Effect of Ni-Containing Catalysts on Pyrolysis Vapors. Catalysts 2018, 8 (5), 191. https://doi.org/10.3390/catal8050191.
(29) Hu, S.; Jiang, L.; Wang, Y.; Su, S.; Sun, L.; Xu, B.; He, L.; Xiang, J. Effects of Inherent Alkali and Alkaline Earth Metallic Species on Biomass Pyrolysis at Different Temperatures. Bioresour. Technol. 2015, 192, 23–30. https://doi.org/10.1016/j.biortech.2015.05.042.
(30) Zhang, W.; Henschel, T.; Söderlind, U.; Tran, K. Q.; Han, X. Thermogravimetric and Online Gas Analysis on Various Biomass Fuels. Energy Procedia 2017, 105, 162–167. https://doi.org/10.1016/j.egypro.2017.03.296.
(31) Yang, H.; Yan, R.; Chen, H.; Ho, D.; Tee, D.; Zheng, C. Pyrolysis of Palm Oil Wastes for Enhanced Production of Hydrogen Rich Gases. Fuel Process. Technol. 2006, 87, 935–942. https://doi.org/10.1016/j.fuproc.2006.07.001.
(32) Xianwen, D.; Chuangzhi, W.; Haibin, L.; Yong, C. The Fast Pyrolysis of Biomass in CFB Reactor. Energy & Fuels 2000, 14 (3), 552–557. https://doi.org/10.1021/ef9901645.
(33) Fahmi, R.; Bridgwater, A. V.; Darvell, L. I.; Jones, J. M.; Yates, N.; Thain, S.; Donnison, I. S. The Effect of Alkali Metals on Combustion and Pyrolysis of Lolium and Festuca Grasses, Switchgrass and Willow. Fuel 2007, 86 (10–11), 1560–1569. https://doi.org/10.1016/j.fuel.2006.11.030.
(34) Safar, M.; Lin, B.; Chen, W.; Langauer, D.; Chang, J.; Raclavska, H.; Pétrissans, A.; Rousset, P.; Pétrissans, M. Catalytic Effects of Potassium on Biomass Pyrolysis , Combustion and Torrefaction. Appl. Energy 2019, 235 (November 2018), 346–355. (35) Harrison, D. P. Calcium Enhanced Hydrogen Production with CO2 Capture. Energy
Procedia 2009, No. 1. https://doi.org/10.1016/j.egypro.2009.01.089.
(36) Song, Y.; Zhao, Y.; Hu, X.; Zhang, L.; Sun, S.; Li, C. Z. Destruction of Tar during Volatile-Char Interactions at Low Temperature. Fuel Process. Technol. 2018. https://doi.org/10.1016/j.fuproc.2017.11.023.
(37) Wang, X.; Bai, S.; Jin, Q.; Li, S.; Li, Y.; Li, Y.; Tan, H. Soot Formation during Biomass Pyrolysis : Effects of Temperature , Water- Leaching , and Gas-Phase Residence Time.
J. Anal. Appl. Pyrolysis 2018, No. April, 0–1. https://doi.org/10.1016/j.jaap.2018.07.015.
(38) González, M. E.; Romero-Hermoso, L.; González, A.; Hidalgo, P.; Meier, S.; Navia, R.; Cea, M. Effects of Pyrolysis Conditions on Physicochemical Properties of Oat Hull Derived Biochar. BioResources 2017. https://doi.org/10.15376/biores.12.1.2040-2057. (39) Li, C.; Suzuki, K. Tar Property, Analysis, Reforming Mechanism and Model for Biomass
Gasification-An Overview. Renew. Sustain. Energy Rev. 2009, 13 (3), 594–604. https://doi.org/10.1016/j.rser.2008.01.009.
Tar Composition in Relation to Methane and Ethylene from Biomass Pyrolysis-Gasification. Energy & Fuels 2011, 25 (9), 4182–4189. https://doi.org/10.1021/ef200846g.
(41) Morf, P. olivier. Secondary Reactions of Tar during Thermochemical Biomass Conversion. Swiss Fed. Inst. Technol. Zurich 2001, No. 14341, 1–183. https://doi.org/10.3929/ethz-a-004229756.
(42) Zhang, Z.; Pang, S. Experimental Investigation of Tar Formation and Producer Gas Composition in Biomass Steam Gasification in a 100 kW Dual Fluidised Bed Gasifier.
Renew. Energy 2019. https://doi.org/10.1016/j.renene.2018.07.144.
(43) Jess, A. Mechanisms and Kinetics of Thermal Reactions of Aromatic Hydrocarbons From Pyrolysis of Solid Fuels. Fuel 1996, 75 (12), 1441–1448.