On Performance Measurement in Psychology and Other Fields
Texte intégral
Figure


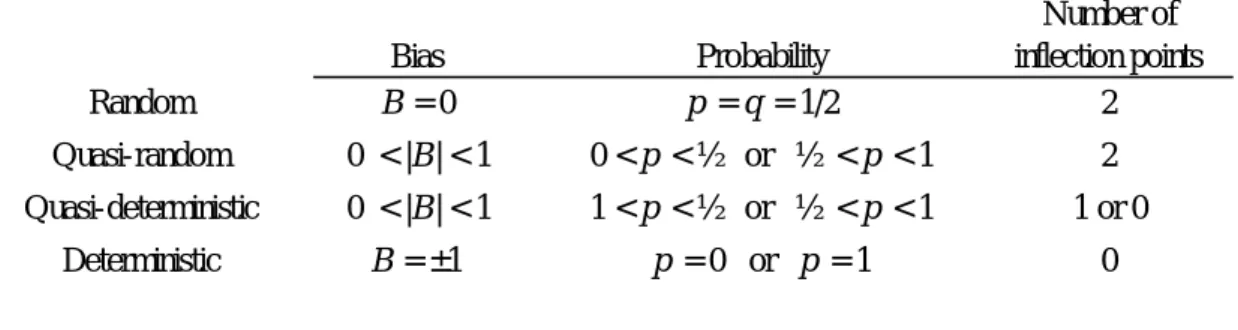
![Figure 6. Effect of the probability bias on the arithmetic mean = np, the standard deviation = [np(1-p)] 1/2 and the skew = (1 ̶ 2p)/ of the Bernoulli process with n = 100](https://thumb-eu.123doks.com/thumbv2/123doknet/8227389.276637/24.892.206.739.485.651/figure-effect-probability-arithmetic-standard-deviation-bernoulli-process.webp)

Documents relatifs
As the lit- erature review highlights it, there is a lack of survey dealing with measurement and management of SC performance, collecting data through interview process and
Note the larger data spots shown in Figure 7 (a) for locations 1 and 2 compared to locations 3 and 4 proving that the mobile manipulator has registered pose with the RMMA. Table
Lemma 1 Consider any degenerate source separation prob- lem with mixtures, sources and additive noise where the source and the noise signals are mutually de- correlated.. Assume
This paper thus considers transferring and adapting the good practices in systems engineering measurement such as described in systems engineering guides as well as the set of
If there are four levels for foreign reserves management then there are long term investment decisions, strategic asset allocation, tactical asset allocation and at the lowest
To ensure that the PMS was derived from the company's strategic priorities in a consistent and inte- grated manner, four principles were applied: (1) Define strategic business
Therefore, exploring the impact of national culture on PMS will help us contribute to the existing literature on performance measurement by (i) exploring the
Given a source polystore schema, a set of input queries and a list of schema change operators, our approach (1) identifies those input queries that cannot be transformed into
