HAL Id: inserm-00677226
https://www.hal.inserm.fr/inserm-00677226
Submitted on 7 Mar 2012
HAL is a multi-disciplinary open access
archive for the deposit and dissemination of
sci-entific research documents, whether they are
pub-lished or not. The documents may come from
teaching and research institutions in France or
abroad, or from public or private research centers.
L’archive ouverte pluridisciplinaire HAL, est
destinée au dépôt et à la diffusion de documents
scientifiques de niveau recherche, publiés ou non,
émanant des établissements d’enseignement et de
recherche français ou étrangers, des laboratoires
publics ou privés.
Timing of onset of cognitive decline: results from
Whitehall II prospective cohort study.
Archana Singh-Manoux, Mika Kivimaki, M Maria Glymour, Alexis Elbaz,
Claudine Berr, Klaus Ebmeier, Jane Ferrie, Aline Dugravot
To cite this version:
Archana Singh-Manoux, Mika Kivimaki, M Maria Glymour, Alexis Elbaz, Claudine Berr, et al..
Timing of onset of cognitive decline: results from Whitehall II prospective cohort study.. BMJ, BMJ
Publishing Group, 2012, 344, pp.d7622. �10.1136/bmj.d7622�. �inserm-00677226�
Timing of onset of cognitive decline: results from
Whitehall II prospective cohort study
OPEN ACCESS
Archana Singh-Manoux research director
1 2 3, Mika Kivimaki professor of social epidemiology
2, M
Maria Glymour assistant professor
4, Alexis Elbaz research director
5 6, Claudine Berr research
director
7 8, Klaus P Ebmeier professor of old age psychiatry
9, Jane E Ferrie senior research fellow
10,
Aline Dugravot statistician
11Institut National de la Santé et de la Recherche Médicale (INSERM), U1018, Centre for Research in Epidemiology and Population Health, Hôpital Paul Brousse, 94807 Villejuif Cedex, France;2Department of Epidemiology and Public Health, University College London, London, UK;3Centre de Gérontologie, Hôpital Ste Périne, AP-HP, France;4Department of Society, Human Development, and Health, Harvard School of Public Health, Boston, MA, USA;5Institut National de la Santé et de la Recherche Médicale (INSERM), U708, F-75013, Paris, France;6UPMC Univ Paris 06, UMR_S 708, F-75005, Paris;7Institut National de la Santé et de la Recherche Médicale (INSERM) U1061 Université Montpellier 1, Montpellier, France;8CMRR Languedoc-Roussillon, CHU Montpellier;9Oxford University Department of Psychiatry, Warneford Hospital, Oxford, UK;10University of Bristol, Bristol, UK
Abstract
Objectives To estimate 10 year decline in cognitive function from
longitudinal data in a middle aged cohort and to examine whether age cohorts can be compared with cross sectional data to infer the effect of age on cognitive decline.
Design Prospective cohort study. At study inception in 1985-8, there
were 10 308 participants, representing a recruitment rate of 73%.
Setting Civil service departments in London, United Kingdom. Participants 5198 men and 2192 women, aged 45-70 at the beginning
of cognitive testing in 1997-9.
Main outcome measure Tests of memory, reasoning, vocabulary, and
phonemic and semantic fluency, assessed three times over 10 years.
Results All cognitive scores, except vocabulary, declined in all five age
categories (age 45-49, 50-54, 55-59, 60-64, and 65-70 at baseline), with evidence of faster decline in older people. In men, the 10 year decline, shown as change/range of test×100, in reasoning was −3.6% (95% confidence interval −4.1% to −3.0%) in those aged 45-49 at baseline and −9.6% (−10.6% to −8.6%) in those aged 65-70. In women, the corresponding decline was −3.6% (−4.6% to −2.7%) and −7.4% (−9.1% to −5.7%). Comparisons of longitudinal and cross sectional effects of age suggest that the latter overestimate decline in women because of cohort differences in education. For example, in women aged 45-49 the longitudinal analysis showed reasoning to have declined by −3.6%
(−4.5% to −2.8%) but the cross sectional effects suggested a decline of −11.4% (−14.0% to −8.9%).
Conclusions Cognitive decline is already evident in middle age (age
45-49).
Introduction
Continuing increases in life expectancy imply fundamental changes to the population structure and an exponential increase in the number of elderly people.1 2These changes are likely to
have a profound influence on individuals’ lives and society at large. Poor cognitive status is perhaps the single most disabling condition in old age. There is a finely graded inverse association between age and cognitive performance,3-5but the age at which
cognitive decline becomes evident at the population level remains the subject of debate.5-7A recent review of the literature
concluded that there was little evidence of cognitive decline before the age of 60.8This point of view, however, is not
universally accepted.5 6Clinicopathological studies show good
correlation between neuropathology and the severity of cognitive decline,9-11and neurofibrillary tangles and amyloid plaques, the
hallmarks of pathology, are known to be present in the brains of young adults.12 13Emerging consensus on the long gestation
period of dementia14 15also suggests that adults aged under 60
are likely to experience age related cognitive decline.
Correspondence to: A Singh-Manoux, INSERM, U1018, Centre for Research in Epidemiology and Population Health, Hôpital Paul Brousse, Bât 15/16, 16 Avenue Paul Vaillant Couturier, 94807 Villejuif Cedex, France [email protected]
Extra material supplied by the author (see http://www.bmj.com/content/344/bmj.d7622?tab=related#webextra)
Supplementary tables
The assessment of the effect of age on cognitive decline is not straightforward as longitudinal data that span many decades are rare. Cross sectional data might not accurately distinguish longitudinal change—that is, the effect of chronological age—from secular change, also called “cohort” effects. The age at which cognitive decline begins is important because behavioural or pharmacological interventions designed to alter cognitive ageing trajectories are more likely to work if they are applied when individuals first begin to experience decline. We examined whether cognitive decline begins before the age of 60 using a large sample of middle aged adults from the longitudinal Whitehall II cohort study. We also evaluated the bias in estimates of cognitive decline drawn from cross sectional data.
Methods
Study population
The Whitehall II cohort was established in 1985 among 10 308 (67% men) British civil servants.16All civil servants aged 35-55
in 20 London based departments were invited to participate by letter, and 73% agreed. Although all participants in the study are white collar workers, a wide range of occupations is represented with a salary difference of over 10-fold between the top and bottom of the hierarchy. Study inception (phase 1) was over the years 1985-8 and involved a clinical examination and a self administered questionnaire. Subsequent phases of data collection have alternated between inclusion of a questionnaire alone and a questionnaire accompanied by a clinical examination. The focus of the clinical examination is anthropometry, cardiovascular and metabolic risk factors, and disease. Cognitive testing was introduced to the full cohort during the clinical examination at phase 5 (1997-9) and repeated at phases 7 (2002-4) and 9 (2007-9), alongside the standard Whitehall II clinical screening measures.
Age
At baseline for this study (phase 5 of Whitehall II) participants were aged 45-70. To allow comparison of cognitive decline as a function of age we categorised this in five year age groups: 45-49, 50-54, 55-59, 60-64, and 65-70.
Cognitive function
The cognitive test battery, administered at three clinical examinations over 10 years (phases 5, 7, and 9), was chosen to provide a comprehensive assessment of cognitive function and be appropriate for this population composed of individuals younger than in most studies on cognitive ageing. The mini-mental state examination,17although included in the test
battery, was not used in the current analysis because of ceiling effects (that is, simple tests leading to little variability in scores). The tests included in the analysis, described below, had good test-retest reliability (range 0.60-0.89) in 556 participants who were invited back to the clinic within three months of having taken the test at baseline.
The Alice Heim 4-I (AH4-I) is composed of a series of 65 verbal and mathematical reasoning items of increasing difficulty.18It
tests inductive reasoning, measuring the ability to identify patterns and infer principles and rules. Participants had 10 minutes to do this section. Short term verbal memory was assessed with a 20 word free recall test. Participants were presented a list of 20 one or two syllable words at two second intervals and were then asked to recall in writing as many of the words in any order within two minutes.
We used two measures of verbal fluency: phonemic and semantic.19Participants were asked to recall in writing as many
words beginning with “S” (phonemic fluency) and as many animal names (semantic fluency) as they could. One minute was allowed for each test; the observed range on these tests was 0-35. Vocabulary was assessed with the Mill Hill vocabulary test,20used in its multiple choice format, consisting of a list of
33 stimulus words ordered by increasing difficulty and six response choices.
Education
Education was assessed with a three level variable: did not complete secondary school, obtained higher qualification at secondary school (at about age 18), and obtained university degree or higher. Results with continuous years of education were similar and are not presented.
Statistical analysis
We first examined the cross sectional associations between age (in five categories) and the cognitive tests at baseline using linear regression. A linear test for trend was used to assess whether cognitive scores were progressively lower in older age cohorts. The age cohort×sex interactions (all tests P<0.001) led us to stratify these analyses by sex.
Linear mixed models21were used to estimate cognitive decline
over follow-up. This method uses all available data over follow-up, takes into account the fact that repeated measures on the same individual are correlated with each other, and can handle missing data. In these analyses both the intercept and the slope were fitted as random effects, allowing individuals to have different cognitive scores at baseline and different rates of cognitive decline over the follow-up. As the age
cohort×time×sex interactions (reasoning P=0.59; memory P=0.12; phonemic fluency P=0.005; semantic fluency P=0.02; and vocabulary P=0.006) suggested sex differences in cognitive decline for some tests, we also stratified these analyses by sex. The models included terms for time (age in years, divided by 10 so the coefficients yield effects of decline over 10 years), age cohorts (age at baseline in five year bands) to adjust for secular effects, and an interaction term between age cohort and time, separately in men and women. This last interaction term allows the calculation of the estimate of 10 year decline in the five age cohorts, undertaken with the original scale for all tests. As the range of the five cognitive tests is different, a decline of one point on the original scalesof the tests is not comparable. To allow comparison across cognitive tests, we also express cognitive decline in terms of percentage change as a function of the range of each test (estimate of 10 year decline/range of test×100). To assess whether the decline was greater at older ages with the test for linear trend, we reran the analysis using the categories of age as a continuous variable.
We then examined the cross sectional versus longitudinal effects of age; we show results only for the youngest age cohort but they were similar for all age cohorts (results available from the first author on request). The longitudinal estimate was drawn from mixed models with three cognitive assessments over 10 years in individuals aged 45-49 at baseline. The cross sectional estimate of “ageing” was simply the difference in cognitive scores at baseline between those aged 45-49 and 55-59 at baseline. These analyses were then adjusted for education to examine its impact on the longitudinal and cross sectional estimates of “ageing.”
All cognitive decline results are expressed as percent change (change/range of test×100) to allow comparison between the RESEARCH
tests. Supplementary tables on bmj.com show results with the original scales for the tests. All the analyses were carried out with Proc Mixed procedure from the SAS software version 9.1 (SAS Institute, Cary, NC, USA).
Results
Of the 10 308 participants at study inception (1985-8), 306 had died and 752 had withdrawn from the study before the start of the cognitive data collection in 1997-9. Our analysis was based on 7390 (5198 men and 2192 women) of the 9250 individuals still in the study. Those included in the analyses were more educated (29.5% v 20.8% had a university degree, P<0.001) and were younger (response rates were 84% (1526/1818) in those aged 45-49, 82% (2160/2643) in those aged 50-54, 79% (1580/1992) in those aged 55-59, 79% (1564/1976) in those aged 60-64, and 68% (560/821) in those aged 65-70). Of the 7390 individuals included in the analysis, we had complete data for 4675 (63%) at all three phases, 1613 at two phases, and 1102 at only one phase.
During the 10 year follow-up, 305/7390 (4%) died. Mortality over this period was higher in those with poorer cognitive scores at baseline (P<0.01 on all tests). Exclusion of these individuals from the analysis did not modify the results much, leading us to retain them in the analyses. Table 1⇓presents characteristics of the participants included in the analysis and their baseline cognitive scores (phase 5, 1997-9). There was a cross sectional association between age at baseline, categorised into five age cohorts of five years each spanning 45-70 years, and all cognitive scores (all P<0.001), except vocabulary in men (P=0.13) (see table A on bmj.com).
The figure⇓presents estimates of cognitive decline, expressed as percent change (change/range of test×100) over the 10 year follow-up period using three waves of data (results using the original scale for the tests are shown in supplementary table B on bmj.com). There was some evidence of greater decline at older ages and of a linear trend in decline with increasing age for some of the tests, particularly in men (fig 1 and table B on bmj.com). For example, in men aged 45-49 at baseline, 10 year decline in reasoning was −3.6% (95% confidence interval −4.1% to −3.0%) while in those aged 65-70 it was −9.6% (−10.6% to −8.6%). In women, the corresponding decline was −3.6% (−4.6% to −2.7%) in those aged 45-49 and −7.4% (−9.1% to −5.7%) in those aged 65-70. The results for all tests, except vocabulary, showed significant declines in all age categories in both men and women as the confidence intervals did not include zero.
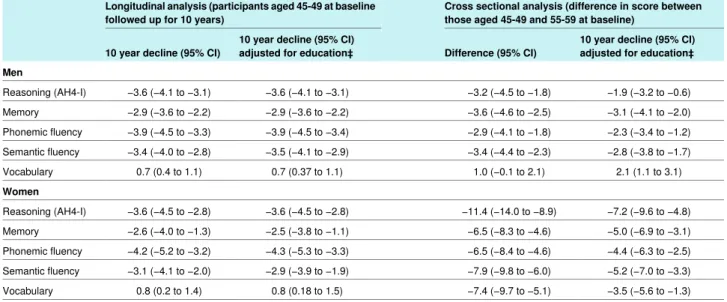
In the final set of analyses we compared the longitudinal and cross sectional effects of age on “cognitive decline.” The results, presented in table 2⇓as percent change (change/range of test×100) and in table C on bmj.com using the original scale, suggest that in women, but not men, the cross sectional analysis considerably overestimated the effect of ageing. For example, the longitudinal analysis in women shows reasoning to have declined by −3.6% (−4.5% to −2.8%) in those aged 45-49 but the cross sectional effects suggest a decline of −11.4% (−14.0% to −8.9%). Adjustment for education did not change the longitudinal estimates much but substantially reduced the cross sectional estimates of the effect of ageing on cognitive decline. There were considerable cohort differences in education in women. In men aged 45-49 years at baseline, 30% had less than a secondary school education, 28% had completed secondary school education, and 42% had a university degree. For women the corresponding figures were 34%, 28%, and 40%. For those
aged 55-59 at baseline the corresponding figures were 38%, 33%, and 29% for men and 58%, 25%, and 17% for women.
Discussion
This study of a large cohort of individuals aged 45-70 at baseline, using three cognitive assessments over 10 years, presents two key findings. Firstly, average performance in all cognitive domains, except vocabulary, declined over follow-up in all age groups, even in those aged 45-49. The results for vocabulary were expected as it is known to be little influenced by age.4Secondly, comparisons of the effect of age in
longitudinal and cross sectional analysis suggest that cross sectional data cannot provide reliable estimates of age related cognitive decline because they conflate the effect of age with differences in birth cohorts in key factors such as education. In our study, cross sectional data considerably overestimated cognitive decline among women but not in men, a probable consequence of cohort differences in education. Thus, differences in educational qualifications or other factors between age cohorts would bias estimates of cognitive decline drawn from cross sectional data.
There are potential caveats to the results reported here. Longitudinal data are known to underestimate the effect of age because of practice effects22and are subject to selective sample
retention.23In our study non-response was higher in the older
individuals, affecting both cross sectional as well and longitudinal estimates. As non-response was not substantial (the overall response rate was 80% (7390/9250) in those invited to cognitive testing), however, major bias is unlikely. The obvious advantage of using longitudinal analysis is that the estimates of cognitive decline are based on changes within an individual, and these are unlikely to be affected by error arising from natural variation between individuals. The exposure, in this case time over 10 years, is uniformly applicable to all age cohorts in the analysis. It must also be noted that Whitehall II is not representative of the general population. The participants are mostly white collar workers in relatively stable employment and two thirds are men, implying that our results could underestimate cognitive decline at the population level. The sex specific cohort differences in educational attainment seen in this sample, however, reflect global trends in educational opportunities across the 20th century.24 25
The age at which cognitive decline begins is subject to much debate.5-26A recent review of studies concluded that there is no
cognitive decline before the age of 60.8This conclusion was
drawn mostly from results of the Seattle longitudinal study, in which 500 individuals, with an age range at baseline from early 20s to late 60s, have been followed since 1956 with the addition of new participants at successive waves of data collection.27In
another study, 149 individuals aged 30-81 were followed for 16 years, and results showed little cognitive decline before the age of 55.28One challenge in small scale studies set up to
investigate “cognitive ageing” is that they might be based on a selected sample of individuals. Estimates of cognitive decline can also be biased because of the existence of practice and learning effects,22 28known to vary as a complex function of
age, level of ability, and complexity of task.22The rates of
decline in cognitive test scores we estimated might understate the actual rate of decline because practice effects can offset age related declines. Our finding of declines in even the youngest age group (age 45-49) is all the more compelling because it is presumably a lower bound estimate.
Given the complexity of assessing cognitive decline, some authors support the use of cross sectional data to estimate the
effects of ageing on cognitive function.5-30These estimates,
however, reflect both the effects of chronological ageing and cohort effects, each produced by distinct underlying
mechanisms. Age effects are caused by changes that people go through as they get older and reflect biological ageing. Cohort effects are produced when a birth cohort enters adult life with long lasting effects on cognitive function because of childhood experiences like quality of education, nutrition, socioeconomic circumstances, etc.31-33Our data show larger cohort effects in
women because of differences in educational attainment across the birth cohorts in our study population. Adjustment for education does not adequately deal with this problem for two reasons. Firstly, education, as measured, might not capture all effects related to cohort differences; secondly, it might overcorrect the estimate for cognitive decline by attributing shared variance between age and education to the latter (education).
Implications and conclusions
Adverse cognitive outcomes like dementia are now thought to be the result of long term processes over at least 20-30 years,14 15
leading some authors to argue for the importance of approaches during life.15 34Despite much research on early diagnosis,
pathophysiological and clinical studies have yet to identify biomarkers or cognitive profiles that accurately predict dementia.3-36Nevertheless, there is enough evidence to show
the importance of healthy lifestyles and cardiovascular risk factors in adulthood for dementia.35 36For some of these risk
factors, such as obesity, hypertension, and
hypercholesterolaemia, it is mid-life levels that seem to be more important than those measured at older ages.35There is emerging
consensus that “what is good for our hearts is also good for our heads,”36 37making aggressive control of behavioural and
cardiovascular risk factors as early as possible key targets for clinical practice and public health.
Our results have profound implications for the design of research used in studies of ageing. Much research in this domain, including that on dementia, assesses both putative risk factors and trajectories of cognitive decline in elderly people. While this allows a sufficient number of people with dementia to be identified with follow-ups of less than 10 years, the implicit assumption made in these studies is that there is little cognitive decline until old age or that the decline, including the rate of decline, in those aged less than 60 is not clinically important. One likely consequence of studies on older people is that some of the risk factors uncovered could simply be correlates of the disease process rather than causes of the outcome under investigation.
Life expectancy continues to increase,1and understanding
cognitive ageing will be one of the challenges of this century. We explicitly examined the impact of age on cognitive decline because better understanding of both adverse and healthy cognitive ageing trajectories might help the identification of early risk factors for adverse cognitive outcomes. There are other changes occurring: the draft fifth edition of the Diagnostic and Statistical Manual of Mental disorders (www.dsm5.org) suggests replacing dementia with “major” and “minor neurocognitive disorder,” a change that is likely to focus attention on better understanding of the effect of age on cognition.
Future research needs to identify the determinants of cognitive decline and assess the extent to which the cognitive trajectories of individuals are modifiable. We examined mean decline in each age group but individuals who experience declines greater
than the mean decline in their age group, particularly at younger ages, might merit further attention. Determining the age window at which potential interventions are likely to be most beneficial is also a crucial next step.
We thank all the participating civil service departments and their welfare, personnel, and establishment officers; the British Occupational Health and Safety Agency; the British Council of Civil Service Unions; all participating civil servants in the Whitehall II study; and all members of the Whitehall II study team. The Whitehall II Study team comprises research scientists, statisticians, study coordinators, nurses, data managers, administrative assistants, and data entry staff, who make the study possible.
Contributors: AS-M wrote the first and successive drafts of the paper. AD carried out all the statistical analysis. All authors contributed to the interpretation of results and revision of the paper and approved the final version of the paper. AS-M is guarantor.
Funding: ASM is supported by a European Young Investigator Award from the European Science Foundation and the National Institute on Aging, NIH (R01AG013196 [PI]; R01AG034454 [PI]). MK is supported by the BUPA Foundation, the National Institutes of Health
(R01HL036310 [PI]; R01AG034454 [PI]) and the Academy of Finland. The Whitehall II study is also supported by a grant from the British Medical Research Council (G0902037) and the British Heart Foundation. The funding bodies had no role in the study design, the collection, analysis and interpretation of data, the writing, and the decision to submit the paper.
Competing interests: All authors have completed the ICMJE uniform disclosure form at www.icmje.org/coi_disclosure.pdf (available on request from the corresponding author) and declare: no support from any organisation for the submitted work; no financial relationships with any organisations that might have an interest in the submitted work in the previous three years; no other relationships or activities that could appear to have influenced the submitted work.
Ethical approval: This study was approved by the University College London ethics committee, and all participants provided written consent. Data sharing: Whitehall II data, protocols, and other metadata are available to the scientific community. Please refer to the Whitehall II data sharing policy at www.ucl.ac.uk/whitehallII/data-sharing.
1 Oeppen J, Vaupel JW. Demography. Broken limits to life expectancy. Science 2002;296:1029-31.
2 Lutz W, Sanderson W, Scherbov S. The coming acceleration of global population ageing.
Nature 2008;451:716-9.
3 Brayne C. The elephant in the room—healthy brains in later life, epidemiology and public health. Nat Rev Neurosci 2007;8:233-9.
4 Holland CA, Rabbitt PMA. The course and causes of cognitive change with advancing age. Rev Clin Gerontol 1991;1:81-96.
5 Salthouse TA. When does age-related cognitive decline begin? Neurobiol Aging 2009;30:507-14.
6 Finch CE. The neurobiology of middle-age has arrived. Neurobiol Aging 2009;30:515-20. 7 Nilsson LG, Sternang O, Ronnlund M, Nyberg L. Challenging the notion of an early-onset
of cognitive decline. Neurobiol Aging 2009;30:521-4.
8 Hedden T, Gabrieli JD. Insights into the ageing mind: a view from cognitive neuroscience.
Nat Rev Neurosci 2004;5:87-96.
9 Nelson PT, Braak H, Markesbery WR. Neuropathology and cognitive impairment in Alzheimer disease: a complex but coherent relationship. J Neuropathol Exp Neurol 2009;68:1-14.
10 Wilson RS, Leurgans SE, Boyle PA, Schneider JA, Bennett DA. Neurodegenerative basis of age-related cognitive decline. Neurology 2010;75:1070-8.
11 Johnson DK, Storandt M, Morris JC, Galvin JE. Longitudinal study of the transition from healthy aging to Alzheimer disease. Arch Neurol 2009;66:1254-9.
12 Braak H, Braak E. Frequency of stages of Alzheimer-related lesions in different age categories. Neurobiol Aging 1997;18:351-7.
13 Duyckaerts C, Hauw JJ. Prevalence, incidence and duration of Braak’s stages in the general population: can we know? Neurobiol Aging 1997;18:362-9.
14 Alzheimer’s Disease International. World Alzheimer report. Alzheimer’s Disease International, 2009.
15 Launer LJ. The epidemiologic study of dementia: a life-long quest? Neurobiol Aging 2005;26:335-40.
16 Marmot M, Brunner E. Cohort profile: the Whitehall II study. Int J Epidemiol 2005;34:251-6. 17 Folstein MF, Folstein SE, McHugh PR. “Mini-mental state.” A practical method for grading
the cognitive state of patients for the clinician. J Psychiatr Res 1975;12:189-98. 18 Heim AW. AH 4 group test of general intelligence. NFER-Nelson, 1970.
19 Borkowski JG, Benton AL, Spreen O. Word fluency and brain damage. Neuropsychologica 1967;5:135-40.
What is already known on this topic
Cognitive function declines with age; impaired cognitive status is a hallmark of dementia
The age at which cognitive decline begins remains unknown, though a recent review of the literature suggests there is little evidence of decline before the age of 60
What this study adds
Longitudinal modelling of cognitive decline using three measures over 10 years provides robust evidence of cognitive decline at all ages between 45 and 70, even among those aged 45-49 at baseline
The 10 year decline in reasoning was −3.5% in men aged 45-49 at baseline and −9.6% among those aged 65-70; the corresponding figures for women were −3.6% and −7.4%
Age related decline in cognitive function cannot be assessed accurately with cross sectional data
20 Raven JC. Guide to using the Mill Hill vocabulary test with progressive matrices. HK Lewis, 1965.
21 Laird NM, Ware JH. Random-effects models for longitudinal data. Biometrics 1982;38:963-74.
22 Rabbitt P, Diggle P, Smith D, Holland F, Mc Innes L. Identifying and separating the effects of practice and of cognitive ageing during a large longitudinal study of elderly community residents. Neuropsychologia 2001;39:532-43.
23 Euser SM, Schram MT, Hofman A, Westendorp RG, Breteler MM. Measuring cognitive function with age: the influence of selection by health and survival. Epidemiology 2008;19:440-7.
24 United Nations Educational SaCOU. World education report 2000. UNESCO, 2000. 25 Goldin C. America’s graduation from high school: the evolution and spread of secondary
schooling in the twentieth century. J Econ Hist 1998;58:345-74.
26 Finch CE. Middle age: an evolving frontier in gerontology. Neurobiol Aging 1991;12:1-2. 27 Schaie KW. The course of adult intellectual development. Am Psychol 1994;49:304-13. 28 Zelinski EM, Burnight KP. Sixteen-year longitudinal and time lag changes in memory and
cognition in older adults. Psychol Aging 1997;12:503-13.
29 Salthouse TA. Influence of age on practice effects in longitudinal neurocognitive change.
Neuropsychology 2010;24:563-72.
30 Salthouse TA, Schroeder DH, Ferrer E. Estimating retest effects in longitudinal assessments of cognitive functioning in adults between 18 and 60 years of age. Dev
Psychol 2004;40:813-22.
31 Ryder NB. The cohort as a concept in the study of social change. Am Sociol Rev 1965;30:843-61.
32 Schaie KW, Labouvie-Vief G. Generational versus ontogenetic components of change in adult cognitive behavior: a fourteen-year cross-sequential study. Dev Psychol 1974;10:305-20.
33 Dickens WT, Flynn JR. Heritability estimates versus large environmental effects: the IQ paradox resolved. Psychol Rev 2001;108:346-69.
34 Whalley LJ, Dick FD, McNeill G. A life-course approach to the aetiology of late-onset dementias. Lancet Neurol 2006;5:87-96.
35 Ballard C, Gauthier S, Corbett A, Brayne C, Aarsland D, Jones E. Alzheimer’s disease.
Lancet 2011;377:1019-31.
36 Richards M, Brayne C. What do we mean by Alzheimer’s disease? BMJ 2010;341:c4670. 37 Viswanathan A, Rocca WA, Tzourio C. Vascular risk factors and dementia: how to move
forward? Neurology 2009;72:368-74.
Accepted: 26 October 2011
Cite this as: BMJ 2012;344:d7622
This is an open-access article distributed under the terms of the Creative Commons Attribution Non-commercial License, which permits use, distribution, and reproduction in any medium, provided the original work is properly cited, the use is non commercial and is otherwise in compliance with the license. See: http://creativecommons.org/licenses/by-nc/2.0/ and http://creativecommons.org/licenses/by-http://creativecommons.org/licenses/by-nc/2.0/legalcode.
Tables
Table 1| Characteristics of study population in Whitehall II. Figures are numbers (percentage) unless stated otherwise
P value* Women (n=2192) Men (n=5198) <0.001 56.2 (6.0) 55.5 (5.9) Mean (SD) age at baseline (years)
<0.001 1888 (86.1) 4859 (93.5) White <0.001 1327 (60.5) 4319 (83.1) Married/cohabiting Education†: <0.001 1163 (56.6) 1964 (39.4) Less than secondary school
467 (22.7) 1370 (27.5) Secondary school 424 (20.6) 1649 (33.1) University
Mean (SD) cognitive function at baseline‡:
<0.001 41.6 (12.2) 48.7 (10.0) Reasoning (range 0-65) 0.39 6.9 (2.7) 6.9 (2.3) Memory (range 0-20) <0.001 16.5 (4.7) 16.9 (4.2) Phonemic fluency (range 0-35)
<0.001 15.8 (4.6)
16.7 (4.0) Semantic fluency (range 0-35)
<0.001 23.1 (5.5)
25.7 (3.8) Vocabulary (range 0-33)
*For difference between men and women. †Data missing for 215 men and 138 women.
‡In 4170 men and 1679 women (5849 of 7390 participants included in longitudinal analysis) who had complete data on five cognitive tests at baseline. RESEARCH
Table 2| Comparison of cognitive decline (expressed as % change*) from longitudinal and cross sectional effects in subsample† of participants in Whitehall study
Cross sectional analysis (difference in score between those aged 45-49 and 55-59 at baseline)
Longitudinal analysis (participants aged 45-49 at baseline followed up for 10 years)
10 year decline (95% CI) adjusted for education‡ Difference (95% CI)
10 year decline (95% CI) adjusted for education‡ 10 year decline (95% CI)
Men −1.9 (−3.2 to −0.6) −3.2 (−4.5 to −1.8) −3.6 (−4.1 to −3.1) −3.6 (−4.1 to −3.1) Reasoning (AH4-I) −3.1 (−4.1 to −2.0) −3.6 (−4.6 to −2.5) −2.9 (−3.6 to −2.2) −2.9 (−3.6 to −2.2) Memory −2.3 (−3.4 to −1.2) −2.9 (−4.1 to −1.8) −3.9 (−4.5 to −3.4) −3.9 (−4.5 to −3.3) Phonemic fluency −2.8 (−3.8 to −1.7) −3.4 (−4.4 to −2.3) −3.5 (−4.1 to −2.9) −3.4 (−4.0 to −2.8) Semantic fluency 2.1 (1.1 to 3.1) 1.0 (−0.1 to 2.1) 0.7 (0.37 to 1.1) 0.7 (0.4 to 1.1) Vocabulary Women −7.2 (−9.6 to −4.8) −11.4 (−14.0 to −8.9) −3.6 (−4.5 to −2.8) −3.6 (−4.5 to −2.8) Reasoning (AH4-I) −5.0 (−6.9 to −3.1) −6.5 (−8.3 to −4.6) −2.5 (−3.8 to −1.1) −2.6 (−4.0 to −1.3) Memory −4.4 (−6.3 to −2.5) −6.5 (−8.4 to −4.6) −4.3 (−5.3 to −3.3) −4.2 (−5.2 to −3.2) Phonemic fluency −5.2 (−7.0 to −3.3) −7.9 (−9.8 to −6.0) −2.9 (−3.9 to −1.9) −3.1 (−4.1 to −2.0) Semantic fluency −3.5 (−5.6 to −1.3) −7.4 (−9.7 to −5.1) 0.8 (0.18 to 1.5) 0.8 (0.2 to 1.4) Vocabulary *Change/range of test×100.
†Longitudinal analysis: 1076 men and 396 women; cross sectional analysis: 918 men and 329 women aged 45-49 and 836 men and 364 women aged 55-59. ‡In those aged 45-49 at baseline 30% of men and 34% of women had less than secondary school education, 28% and 26% had secondary school education, and 42% and 40% had a university degree. For those aged 55-59 at baseline corresponding figures were 38% and 58%, 33% and 25%, and 29% and 17%.
Figure
Decline in cognitive test scores over 10 years (% change=change/range of text×100) as function of baseline age cohort in men and women, estimated from linear mixed models. P values denote test for linear trend across age categories, derived by entering them as continuous variable