HAL Id: hal-01008675
https://hal.archives-ouvertes.fr/hal-01008675
Submitted on 13 Apr 2018HAL is a multi-disciplinary open access archive for the deposit and dissemination of sci-entific research documents, whether they are pub-lished or not. The documents may come from teaching and research institutions in France or abroad, or from public or private research centers.
L’archive ouverte pluridisciplinaire HAL, est destinée au dépôt et à la diffusion de documents scientifiques de niveau recherche, publiés ou non, émanant des établissements d’enseignement et de recherche français ou étrangers, des laboratoires publics ou privés.
Probabilistic analysis of shallow foundations on rocks
obeying Hoek-Brown failure Criterion
Nut Mao, Tamara Al-Bittar, Abdul-Hamid Soubra
To cite this version:
Nut Mao, Tamara Al-Bittar, Abdul-Hamid Soubra. Probabilistic analysis of shallow foundations on rocks obeying Hoek-Brown failure Criterion. Geotechnical Risk Assessment and Management (Georisk 2011), ASCE, Jun 2011, Atlanta, GA, United States. �10.1061/41183(418)70�. �hal-01008675�
Probabilistic Analysis of Shallow Foundations on Rocks Obeying Hoek-Brown Failure Criterion
Nut Mao1, Tamara Al-Bittar2 andAbdul-Hamid Soubra3, M.ASCE
1
PhD student, University of Nantes, GeM, UMR CNRS 6183, Bd. de l'université, BP 152, 44603 Saint-Nazaire, France; PH (33) 240 905 106; FAX (33) 240 905 109; email: nut.mao@univ-nantes.fr
2
PhD student, University of Nantes, GeM, UMR CNRS 6183, Bd. de l'université, BP 152, 44603 Saint-Nazaire, France; PH (33) 240 905 106; FAX (33) 240 905 109; email: tamara.al-bittar@univ-nantes.fr
3
Professor, University of Nantes, GeM, UMR CNRS 6183, Bd. de l'université, BP 152, 44603 Saint-Nazaire, France; PH (33) 240 905 108; FAX (33) 240 905 109; email: abed.soubra@univ-nantes.fr
ABSTRACT
A probabilistic analysis using Polynomial Chaos Expansion method is presented to compute the probability density function (PDF) of the ultimate bearing capacity of a strip footing resting on a rock mass and subjected to a vertical/inclined load. The rock is assumed to follow Hoek-Brown failure criterion. The kinematic approach of the limit analysis theory is used. The results of the vertical load case have shown that: (i) the Geological Strength Index GSI and the uniaxial compressive strength of the intact rock σc have the most significant weight in the variability of the
ultimate bearing capacity, (ii) the non-normality of the input variables has a significant effect on the shape of the PDF of the ultimate bearing capacity and, (iii) a negative correlation between GSI and σc leads to less spread out PDF. Finally, it was
shown in the inclined load case that the variability of the ultimate bearing capacity decreases with the increase of the footing load inclination.
INTRODUCTION
Traditionally, the stability analysis of shallow foundations resting on rocks is based on deterministic approaches. The present paper aims at determining the ultimate bearing capacity of a centrally loaded shallow strip footing (i.e. a footing subjected to a vertical or an inclined load) using a probabilistic analysis. The footing rests on a rock mass that follows the modified Hoek-Brown failure criterion. The deterministic models are based on the kinematic approach of limit analysis theory using translational multiblock failure mechanisms. The Polynomial Chaos Expansion (PCE) method (Huang et al. 2009) is used for the probabilistic analysis. Four uncertain parameters related to the modified Hoek-Brown failure criterion are modeled as random variables. These are the Geological Strength Index (GSI), the uniaxial compressive strength of the intact rock (σc), the intact rock material constant
(mi) and the disturbance coefficient (D). The paper is organized as follows: The first
section aims at presenting the basic idea of the PCE methodology. It is followed by a presentation of the deterministic model used for the computation of the ultimate
bearing capacity. Finally, the probabilistic results are presented and discussed. The paper ends with a conclusion.
POLYNOMIAL CHAOS EXPANSION (PCE) METHODOLOGY
In the PCE methodology, the response of the mechanical model Γ with M input random variables is expressed by a PCE of order p pre-defined by the user as follows:
( )
∑
( )
∑
−( )
= ∞ = ≅ = 1 0 0 P PCE a a β β β β βΨβ ξ Ψ ξ ξ Γ (1)where ξ are independent standard normal random variables representing the input random variables, aβ are unknown coefficients to be determined, Ψβ are chosen as multidimensional Hermite polynomials and P=
(
M +p) (
!/ M!p!)
is the number of terms retained in the truncation scheme (which is equal to the number of unknown coefficients). To compute the coefficients a in Equation 1, two non intrusive βmethods have been proposed in literature: the projection and the regression approach. In this paper, the regression approach (Huang et al. 2009) is used. In this approach, each input random variable is assumed to take the roots of the one-dimensional Hermite polynomial (of one degree higher than the PCE order p). For M input
random variables and a PCE of order p, the available collocation points (sample
points) are the result of all possible combinations of these roots. Their number
(
)
[
M]
p
N = +1 dramatically increases as p and M increase and it is always higher than
the number P of the unknown coefficients (for M ≥2). This leads to a linear system of equations whose number of equations is greater than the number of unknowns. Several attempts have been made in literature to select the most efficient collocation points among the N available ones in order to reduce the number of calls to the
deterministic model. The approach proposed by Sudret (2008) is used herein. In order to check the goodness of fit of the PCE, the coefficient of determination R2 is
computed. The value R2 =1 indicates a perfect fit of the true model response Γ, whereas R2 =0 indicates a nonlinear relationship between the true model Γ and the PCE model ΓPCE. Once the output approximation via a PCE is obtained, this PCE will be called meta-model and will be employed for the probabilistic analyses. The PDF and the statistical moments of the system response can be estimated. This can be done by simulating a large number of realizations of the standard normal variables on the meta-model using Monte Carlo technique. Another important advantage of the meta-model is that a global sensitivity analysis (GSA) based on Sobol indices can be performed analytically using the coefficients of the PCE (Sudret 2008). These indices indicate the contribution of each random variable or combination of random variables to the variability of the system response. This is important because it helps engineers in detecting the input uncertain parameters which have a significant influence in the variability of the system response.
DETERMINISTIC BEARING CAPACITY OF A CENTRALLY LOADED STRIP FOOTING
The modified Hoek-Brown failure criterion is used in this paper. This failure criterion only deals with intact rocks or heavily jointed rock masses. A heavily jointed rock mass involves sufficiently dense and randomly distributed joints so that in the scale of the problem, it can be regarded as an isotropic assembly of interlocking particles. Consequently, rocks with few discontinuities cannot be considered in this framework. This failure criterion can be described by the following equation (Hoek et al. 2002):
(
)
[
]
n c c m / +s = −σ σ σ σ σ1 3 3 (2)where σ1 and σ3 are respectively the major and minor principal stresses at failure and σc is the uniaxial compressive stress of the rock at failure. The parameters m, s and n
are given by the following equations:
⎟ ⎠ ⎞ ⎜ ⎝ ⎛ − − = D GSI i.e m m 28 14 100 ; ⎟ ⎠ ⎞ ⎜ ⎝ ⎛ − − = D GSI e s 9 3 100 ; n=
( ) ( )
1/2 + 1/6[
e−GSI/15 −e−20/3]
(3) In these equations, the geological strength index (GSI) characterizes the quality of rock masses, and it depends on the rock mass structure as well as the surface condition of joints (Hoek et al. 2002). On the other hand, the parameter mi isthe value of parameter m for intact rock and can be obtained from experimental tests. It varies from 4 for very fine weak rock like claystone to 33 for coarse igneous light-colored rock like granite. Finally, D is the disturbance coefficient. It varies from 0.0 for undisturbed in situ rock masses to 1.0 for very disturbed rock masses.
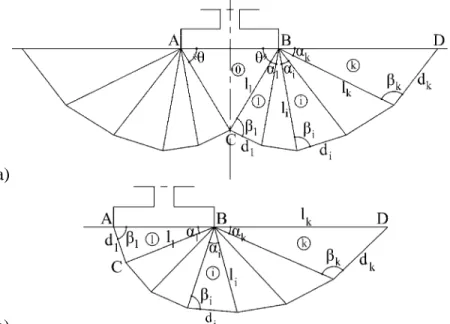
Two kinematically admissible failure mechanisms M1 and M2 based on the upper-bound theorem of limit analysis are used herein. They are described in Soubra (1999) in the case of a Mohr-Coulomb material whose failure criterion is linear. M1 is a translational symmetrical multiblock failure mechanism (Figure 1a) and is used for the computation of the ultimate bearing capacity of a vertically loaded strip footing. It is composed of 2k+1 triangular rigid blocks (a central symmetrical block under the footing and 2k symmetrical rigid blocks at both sides of the footing). This mechanism can be completely described by 2k angular parameters which are αi (i=1, …, k-1), βi (i=1, …, k) and θ. On the other hand, M2 is a translational
non-symmetrical multiblock failure mechanism (Figure 1b) and is suitable for the calculation of the ultimate bearing capacity of obliquely loaded strip foundations. This mechanism is composed of k triangular rigid blocks. It can be completely described by 2k-1 angular parameters which are αi (i=1, …, k-1) and βi (i=1, …, k).
For the case of rock masses obeying the modified Hoek-Brown non linear failure criterion, Yang and Yin (2005) have replaced this criterion by an equivalent linear Mohr-Coulomb failure criterion (Figure 2). Recently, a more rigorous and efficient approach which preserves the original non linear form of the modified Hoek-Brown failure criterion, was proposed by Saada et al. (2008). A similar approach is used herein for both M1 and M2 mechanisms. Notice that the energy dissipation takes
place at the discontinuity surfaces di between the material at rest and the material in
motion, and at the discontinuity surfaces li within the radial shear zone (Figure 1). In
this paper, the inter-block velocities vi,i+1 will be assumed as being inclined at angles φi,i+1 to lines li+1 (Figure 3) where φi,i+1 will be different along the different lines li+1.
Also, the block velocities vi+1 will be assumed as being inclined at angles φi+1 to lines di+1 (Figure 3) where φi+1 will be also different along the different lines di+1.
a)
b)
Figure 1. Failure mechanisms for the computation of the bearing capacity in the case of a) vertical load and b) inclined load.
Figure 2. Failure envelope the Hoek-Brown and the equivalent mechanism Morh-Coulomb failure criteria.
For both M1 and M2 mechanisms, it was found that an upper-bound of the ultimate bearing capacity can be defined as:
c c q u B N qB N B N q γ 02 γ 0 σ 0 σ 2 1 + + = (4) where c N and N ,
Nγ q σ are non-dimensional functions which can be expressed in
terms of the mechanism geometrical parameters and in terms of the tangential frictional angle φi+1 and φi,i+1 where i=0, …, k-1. For each failure mechanism, the
ultimate bearing capacity is obtained by minimization with respect to the angular parameters of the failure mechanism and with respect to φi+1 and φi,i+1.
PROBABILISTIC NUMERICAL RESULTS
The aim of this section is to present the probabilistic results of the ultimate bearing capacity. The footing of width B0=1m is placed on a weightless (γ=0) rock
mass, with no surcharge loading on the ground surface (q=0). The illustrative values of the statistical moments of the random variables as well as the correlation coefficient are presented in Table 1 [Hoek 1998 and Hoek et al. 2002].
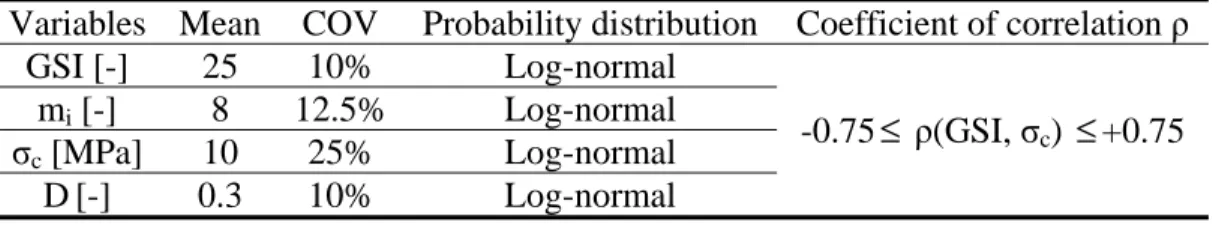
Table 1. Input random variables and their statistical characteristics.
Variables Mean COV Probability distribution Coefficient of correlation ρ GSI [-] 25 10% Log-normal
-0.75≤ ρ(GSI, σc) ≤ +0.75 mi [-] 8 12.5% Log-normal
σc [MPa] 10 25% Log-normal D[-] 0.3 10% Log-normal
CASE OF A VERTICAL LOAD Optimal PCE order and Sobol indices
The coefficient of determination R2 of the PCEs of orders 2, 3, 4 and 5 were computed. It was found that R2 of order 4 and order 5 are close to 1 (i.e. higher than 0.999999). Consequently a PCE of order p=4 provides a good fit between the meta-model and the true meta-model, and will be adopted in the rest of the probabilistic studies performed in this paper. For the prescribed values of the statistical moments of the input random variables presented in Table 1, the Sobol indices have been computed. The Sobol indices of parameter σc (0.5378) and GSI (0.3141) are much higher than
those of parameters mi (0.0866) and D (0.0308). A thorough experimental
investigation will thus be required by the engineer for only the influential parameters (i.e. GSI and σc) to obtain reliable results of the system response.
Effect of the coefficient of variation (COV) of the random variables
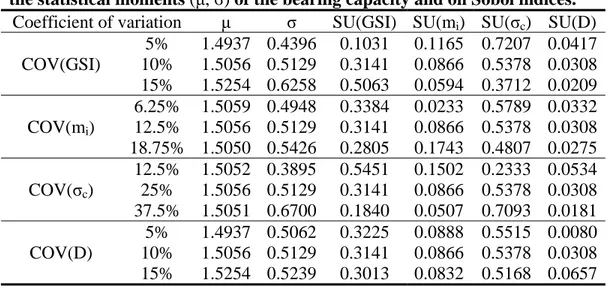
The effect of COV of the random variables is presented in Table 2. This table shows that the COV has practically no effect on the mean value of the ultimate bearing capacity and that the increase in the COV of parameters GSI or σc has a
shows the effect of COV on Sobol indices. One can note that the increase in COV of a certain variable increases its Sobol index and decreases the Sobol indices of the other variables.
Table 2. Effect of the coefficients of variation of the input random variables on the statistical moments (μ, σ) of the bearing capacity and on Sobol indices.
Coefficient of variation μ σ SU(GSI) SU(mi) SU(σc) SU(D)
COV(GSI) 5% 1.4937 0.4396 0.1031 0.1165 0.7207 0.0417 10% 1.5056 0.5129 0.3141 0.0866 0.5378 0.0308 15% 1.5254 0.6258 0.5063 0.0594 0.3712 0.0209 COV(mi) 6.25% 1.5059 0.4948 0.3384 0.0233 0.5789 0.0332 12.5% 1.5056 0.5129 0.3141 0.0866 0.5378 0.0308 18.75% 1.5050 0.5426 0.2805 0.1743 0.4807 0.0275 COV(σc) 12.5% 1.5052 0.3895 0.5451 0.1502 0.2333 0.0534 25% 1.5056 0.5129 0.3141 0.0866 0.5378 0.0308 37.5% 1.5051 0.6700 0.1840 0.0507 0.7093 0.0181 COV(D) 5% 1.4937 0.5062 0.3225 0.0888 0.5515 0.0080 10% 1.5056 0.5129 0.3141 0.0866 0.5378 0.0308 15% 1.5254 0.5239 0.3013 0.0832 0.5168 0.0657
Effect of the correlation coefficient and the distribution type of the random variables
The PDFs presented in Figure 3 show that the increase in the coefficient of correlation between GSI and σc significantly increases the variability of the ultimate
bearing capacity. The smallest response variability is thus obtained for negatively correlated variables.
Concerning the distribution type of the input random variables, two cases of normal and nonnormal (i.e. log-normal) random variables combined with two configurations of COVs were considered (Figure 4).
0 0.2 0.4 0.6 0.8 1 1.2 1.4 1.6 1.8 0 1 2 3 4 qu (MPa) PDF ρ(GSI, σc) = -0.75 ρ(GSI, σc) = -0.50 ρ(GSI, σc) = -0.25 ρ(GSI, σc) = 0 ρ(GSI, σc) = +0.25 ρ(GSI, σc) = +0.50 ρ(GSI, σc) = +0.75 COV(GSI) = 10%, COV(mi) = 12.5%, COV(σc) = 25%, COV(D) = 10% 0.0 0.2 0.4 0.6 0.8 1.0 1.2 1.4 0 1 2 3 4 qu(MPa) PDF
Standard COVs and nonnormal variables High COVs and nonnormal variables Standard COVs and normal variables High COVs and normal variables
Figure 3. Influence of ρ(GSI, σc) Figure 4. Influence of the distribution on the PDF of the bearing capacity. type of the input random variables on
the PDF of the bearing capacity for two different sets of COVs.
The “standard COVs” corresponds to the reference case presented in Table 1 while the “high COVs” corresponds to these values increased by 50%. For these two sets of COVs, the non-normality of the distribution type of the input random variables has significant influence on the shape of the PDF of the ultimate bearing capacity as can be seen from Figure 4; the influence being more important for the case of “high COVs” than the case of “standard COVs”. Notice however that the probability distribution of the random variables has practically no influence on the mean and the standard deviation of the system response and consequently, no effect on the coefficient of variation of this response (results not shown here).
CASE OF AN INCLINED LOAD
Figure 5 shows the PDFs of the ultimate bearing capacity for different values of the load inclination α. One can see that the variability of the ultimate bearing capacity is significant in the case of small load inclination α and it decreases when α increases. This may be explained by the fact that the response involved in the analysis is the ultimate bearing capacity. Thus, it would be logical to have the most significant variability when the punching is most predominant (i.e. for small load inclination).
0.0 1.0 2.0 3.0 4.0 5.0 6.0 0 1 2 3 qu (MN/m) PD F α = 5° α = 10° α = 15° α = 23° α = 30° α = 35° α = 40° COV(GSI) = 10% COV(σc) = 25% COV(mi) = 12.5% COV(D) = 10%
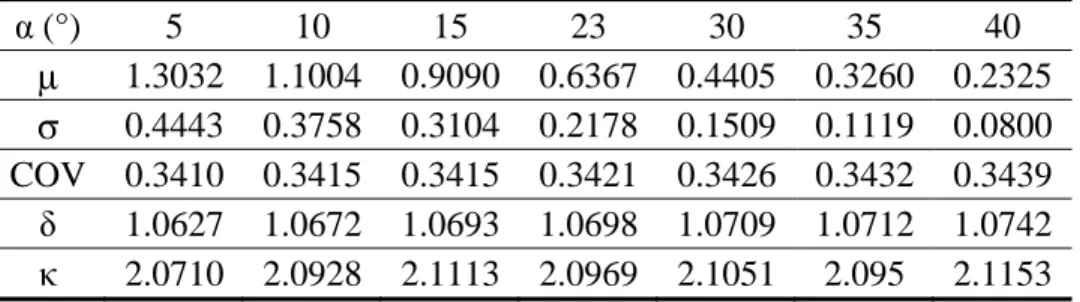
Figure 5. PDF of the bearing capacity for different cases of load inclination. Table 3. Statistical moments of the ultimate bearing capacity for different cases of load inclination α. α (°) 5 10 15 23 30 35 40 μ 1.3032 1.1004 0.9090 0.6367 0.4405 0.3260 0.2325 σ 0.4443 0.3758 0.3104 0.2178 0.1509 0.1119 0.0800 COV 0.3410 0.3415 0.3415 0.3421 0.3426 0.3432 0.3439 δ 1.0627 1.0672 1.0693 1.0698 1.0709 1.0712 1.0742 κ 2.0710 2.0928 2.1113 2.0969 2.1051 2.095 2.1153
Table 3 shows that the mean and standard deviation of the ultimate bearing capacity vary with the load inclination. However, the coefficient of variation, the skewness δ and the kurtosis κ do not vary with this inclination; this observation may be explained by the fact that the variability of the input random variables is similar
CONCLUSION
A probabilistic analysis of a centrally loaded strip foundation resting on a rock mass obeying Hoek-Brown failure criterion has been performed. The deterministic model was based on the kinematical approach of the limit analysis theory. The polynomial chaos expansion methodology was used for the probabilistic analysis. The uncertain parameters involved in the analysis were the Geological Strength Index (GSI), the uniaxial compressive strength of the intact rock (σc), the intact rock
material constant (mi) and the disturbance coefficient (D). For the vertically loaded
footing, it was shown that (i) a fourth order PCE is sufficient to accurately represent the system response; (ii) the parameters mi and D have smaller effect on the
variability of the ultimate bearing capacity compared to the other two parameters GSI and σc; (iii) the assumption of negatively correlated variables leads to less spread out
PDF of the ultimate bearing capacity; (iv) the non-normality of the input random variables has a significant impact on the shape of the PDF of the ultimate bearing capacity, there is an almost no effect on its mean and standard deviation; (v) the COV of the random variables has practically no effect on the mean value of the ultimate bearing capacity, the increase in the COV of the parameters GSI or σc has a
significant effect on the variability of the ultimate bearing capacity; (vi) the increase in the COV of a certain variable increases its Sobol index (i.e. it increases its weight in the variability of the system response) and decreases the Sobol indices of the other variables. For the inclined load case, it was found that the variability of the ultimate bearing capacity decreases with the increase of the footing load inclination; however the coefficient of variation of this bearing capacity is constant regardless of the load inclination.
REFERENCES
Hoek, E. (1998). “Reliability of Hoek-Brown estimates of rock mass properties and their impact on design.” Technical note. Int. J. Rock. Mech. Mining Sci., 35, 63-68.
Hoek, E., Carranze-Torres, C., Corkum, B. (2002). “Hoek-Brown failure criterion-2002 edition.” In: Proceeding of the North American rock mechanics society
meeting, Toronto, 267-73.
Huang, S. P., Liang, B., Phoon, K. K. (2009). “Geotechnical Probabilistic Analysis by Collocation-based Stochastic Response Surface Method: An EXCEL Add-in Implementation.” Georisk 2009, 3(2), 75-86.
Saada, Z., Maghous, S., Garnier, D. (2008). “Bearing capacity of shallow foundations on rocks obeying a modified Hoek–Brown failure criterion. Comput.” Comp.
and Geotech., 35, 144–54.
Soubra, A. H. (1999). “Upper-bound solutions for bearing capacity of foundations.”
J. Geotech. Geoenviron. Eng., ASCE , 125(1), 59-68.
Sudret, B. (2008). “Global sensitivity analysis using polynomial chaos expansion.”
Reliab. Eng. And System Safety, 93, 964-979.
Yang, X. L., and Yin, J. H. (2005). “Upper bound solution for ultimate bearing capacity with a modified Hoek-Brown failure criterion.” Int. J. Rock. Mech.