Enhancing Knowledge for Renewed Policies against Poverty
Working Paper n° 35
Poverty and spatial deconcentration in
Brazilian manufacturing and mining
industry
Jo
ão Saboia, Lucia Kubrusly
UFRJ
This project is funded by the European Union under the 7th Research Framework Programme (theme SSH) Grant agreement nr 290752. The views expressed in this press release do not necessarily reflect the views of the European Commission.
Poverty and Spatial Deconcentration in Brazilian Manufacturing and Mining
Industry
João Saboia and Lucia Kubrusly
1Executive Summary
Covering an area of 8.5 million km2 and with a population of more than 200 million, Brazil is now the world’s fifth largest country by total area and population. The country is divided into five regions, 27 states, 137 mesoregions, 556 microregions, and 5570 municipalities. Despite its size, Brazil’s population and economy are very densely concentrated in the main urban coastal areas, as a result of an unbalanced regional development over the years.
In the last decades, scholars have found clear evidence of deconcentration of economic activities in Brazil, a movement that might be in part related to national government’s policies aimed at developing the countryside. More importantly, though, it may be a result of initiatives conducted by local governments to attract new industrial investments to their regions.
Yet, despite advances in recent years, Brazil’s economy remains highly concentrated in the South and Southeast regions, more specifically in the states of São Paulo, Rio de Janeiro, Minas Gerais, Rio Grande do Sul, Paraná, and Santa Catarina, and their metropolitan areas.
The present study aims to examine the process of spatial deconcentration of industrial activities in Brazil’s recovering economy since 2003 and determine its potential contribution to the reduction of poverty that has occurred in recent years.
The analysis of spatial deconcentration has been made using traditional measures such as concentration ratios and the Hirschmann-Herfindahl index. Evidence has been found of significant decentralization of manufacturing activities, associated with a loss of relative importance of the main mesoregions (especially the metropolitan areas of São Paulo, Rio de Janeiro, Porto Alegre and Belo Horizonte). At the same time it was identified an increase in the share of severalmunicipalities in the countryside, including those located in the less developed, poor regions of the North, Northeast and Midwest.
Policies undertaken by lower-level governments aimed to attract investments, also known as “fiscal war”, may be the main cause behind the phenomena of economic deconcentration. States’ governments offer tax cuts to reduce installation and operational costs of new firms; additionally, they facilitate access to credit and public funds. Furthermore, municipalities also reduce their own taxes and offer several infrastructure and logistics advantages to attract new industrial firms to their cities.
Despite being subjected to criticism, tax competition has produced unequivocal results in terms of attracting new industrial firms to smaller cities, especially in face of the limited policies undertaken by the national government aimed at regional development. As a downside, one could mention the increased spending by local administration and the loss of fiscal revenue in poor, less developed regions where social conditions are unfavorable.
As for the national government’s regional development strategies, the most successful policy was the
1 João Saboia is full professor and Lucia Kubrusly is an associate professor at the Institute of Economics of
the Federal University of Rio de Janeiro (UFRJ). Henrique Schmidt, Giovanna Loiola, Pilar Picon and Rodrigo Bazzanella are students at UFRJ and have participated in the research team.
creation of the Free Trade Zone of Manaus in the late 1970s, which established an important industrial hub in the Amazon but at a high cost in terms of fiscal incentives. The Free Trade Zone of Manaus has been recently extended by 50 years.
In recent years Brazil has achieved a significant reduction in poverty rates. The comparison of datasets on the process of spatial deconcentration of manufacturing and mining industries in recent years and the evolution of poverty rates in the 137 mesoregions of the country shows a positive correlation, as most of the new firms, wages and jobs created in the last decade have taken place in areas where higher poverty rates prevail. So, one might argue that spatial deconcentration of manufacturing activities, though not intended to reduce poverty, has indirectly contributed to poverty reduction in Brazil in recent years, by boosting job and wage growth in poor regions.
And yet there is no consensus on the issue of tax competition in Brazil. It is rather quite a controversial one, with positive and negative sides. In any case, in face of the interests of local populations and the lack of a more effective national policy aimed at reducing regional inequalities, tax competition has achieved positive outcomes in many underdeveloped regions of the country.
1. Introduction
The debate on spatial deconcentration of manufacturing in Brazil in the past two decades has been pioneered by Diniz (1993) and Diniz & Crocco (1996), who suggest that in the 1990s deconcentration had already started. According to the authors, the metropolitan areas of São Paulo and Rio de Janeiro were believed to have lost share throughout the 1990s, whereas the Southern states, Minas Gerais and the countryside of São Paulo were said to have gained share and become a sort of industrial belt extending from mid-Minas Gerais to the northeast Rio Grande do Sul. Thus, as a result of the ongoing changes at that time, deconcentration was believed to be restricted to the municipalities within that belt.
Other authors such as Negri (1994), Pacheco (1999) and Saboia (2000) argue that the deconcentration was not restricted to that particular area though. For instance, Negri (1994) shows that decentralization of economic activities benefited other regions such as the Midwest, the Northeast and the Free Trade Zone of Manaus by stimulating the development of a number of industrial sectors.
Pacheco (1999) argues that the process continued until the mid-1990s, but showed different patterns across the regions. According to the author, at that time deconcentration had already slowed down compared to previous years. Andrade & Serra (2000) provide evidence of spatial deconcentration within the industrial belt circumscribed by Diniz & Crocco (1996), with most of its industrial areas becoming less relevant.
Saboia (2000) analyzes the 1989-1997 period and finds corroborating evidence on the process of deconcentration: the decline of manufacturing jobs in most state capitals and metropolitan areas, as well as the increased relevance of the countryside of the main industrial states and other states outside the South-Southeast corridor. As a result, small industrial hubs were believed to have emerged in different regions of the country where low wages and low level of industrial diversification prevailed.
Azevedo & Toneto Junior (2001) also find evidence that the decentralization of economic activities continued in the 1990s. According to their study, labor-intensive sectors were believed to be relocating towards regions with lower wages; natural-resource-intensive sectors were said to be relocating into areas where those inputs were more available; whereas capital-intensive sectors were believed to be competing with regions located in the countryside of the South/Southeast states.
Saboia (2001) provides corroborating evidence on the aforementioned movement of spatial deconcentration in the 1990s. The South region was believed to have benefited most from that process, as it showed a relative increase in its share of the employment and wages in several industrial sectors. Saboia also reveals that less developed areas in the Northeast and Midwest gained importance in a number of traditional manufacturing industries.
Suzigan et alii (2001) and Azzoni (2002) study the particular case of São Paulo. The former discusses the heterogeneity of São Paulo’s industrial clusters and reveals that the countryside’s performance scored better than the metropolitan area’s. The latter argues that the metropolitan still hada key role in the process of industrialization.
Saboia (2004) studies the deconcentration of manufacturing activities in the Northeast during the period 1994-2000. According to the author, despite the improvements in job creation and wage levels, that region remained in an unfavorable position compared to the rest of the country. Nevertheless, he highlights the great gaps in the Northeast countryside.
Ramos & Ferreira (2005) compare the behavior of large cities and the rest of the country. According to the authors, large cities as industrial hubs were believed to be exhausting and shrinking even more as a result of tax competition between states’ governments. As the Rio-São Paulo corridor lost relative importance, manufacturing jobs were believed to be relocating into the countryside of São Paulo and the South/Southeast neighboring states.
Adopting an economic-demographic perspective, Garcia, Lemos & Carvalho (2003) suggest that significant changes have been taking place in Brazil’s main economic hubs in the last decades. The studies by Pereira & Lemos (2003) and Lemos et alii (2003) reaffirm that the geographical distribution of Brazilian manufacturing activities remains concentrated in São Paulo and surrounding areas; however, according to the authors, new subnational hubs have emerged, with limited geographic influence nonetheless.
Oliveira Junior (2006) examines the determinants of locational decision-making in manufacturing sectors. They conclude that locational decision-making of firms is strongly associated with the characteristics of each manufacturing sector, driven by factors such as wages, economies of agglomeration, proximity to market and existing plants.
Using multivariate statistical methods and synthetic indicators for analyzing data on Brazil’s mesoregions, Saboia, Kubrusly & Barros (2008) confirm that in the mid-2000s the geographical distribution of economic activities was still highly unbalanced, as the South and Southeast regions benefited most. However, favorable evidence has been found on a number of mesoregions located in the North, Northeast and Midwest regions, which is believed to allow an extrapolation of deconcentration for beyond the original Diniz & Crocco belt. Cases have been found of development in the surrounding areas of state capitals, as well as specific cases of policies aiming at attracting industrial investments to the countryside.
Ardissone (2009) examines data on 58 microregions featuring higher industry value added and concludes that the decentralization of economic activities in the period 1996-2005 has produced different outcomes depending on the manufacturing sector being considered. While a number of areas shows a trend towards deconcentration, with the emergence of new industrial microregions, in others reconcentration of manufacturing sectors is believed to have occurred.
Saboia (2013) extends his previous analysis until the year 2007 and confirms that spatial deconcentration of manufacturing activities had continued. He examines three groups of manufacturing sectors - traditional goods, commodities and durable goods - and finds similar trends across sectors.
The present study shares the same basic concern as the reviewed literature, with a view to updating and deepening the discussion on the geographical distribution of manufacturing industries until the year 2012,
in the context of the resumption of economic growth and the eventual slowing down of Brazil’s economic activity at the end of the 2003/2012 period. This report will show that the decentralization of manufacturing and mining industries continued in the period and has benefited most the countryside by boosting the creation of jobs and income, as well as contributing in some way to poverty reduction in several regions.
This report is divided into eight sections. Section two presents an overview of the literature on the investment attraction policies behind tax competition, highlighting their pros and cons. Section three details the methodology used in the empirical research. In section four manufacturing growth data will be presented for the years 2003/2012. Section five discusses the process of spatial deconcentration of manufacturing activities during that period. Section six describes the case of a specific mesoregion of the country and the type of policies adopted to attract a major multinational company. In section seven data on the evolution of geographical decentralization of manufacturing will be compared to data on the poverty reduction with a view to determine the type of correlation that might exist between the two phenomena. Section eight concludes and is followed by an appendix containing the statistical data used in the research, in addition to Brazil’s maps that illustrate the process of spatial deconcentration of manufacturing and mining activities being examined.
2. Policies to Attract Investments at a Local Level
The process of industrialization had a major role in Brazil’s economic growth path in the 20th century. However, according to Policarpo & Cruz (2010), it was insufficient to reduce regional inequalities. In the 1970s, the national government managed to centralize its development policies. The creation of the Superintendency of the Development of the Northeast (SUDENE - Superintendência do Desenvolvimento
do Nordeste) and the Superintendency of the Development of the Amazon (SUDAM - Superintendência do Desenvolvimento da Amazônia) are examples of how the military administration pursued the goal of
reducing regional inequalities.
Prado (1999) argues that tax exemption policies have been quite popular in Brazil for many decades. In the 1970s states’ governments already competed in the fiscal arena. According to the author, in the 1980s tax competition between the states declined but resumed to grow in the 1990s and soared in the mid-1990s, when tax exemption boomed all over the country. The phenomenon, locally known as “fiscal war”, is still very popular in Brazil.
Whereas during the military administration the national government was able to implement development policies all over the country, with the end of dictatorship in the 1980s its ability to intervene in the economy became less effective. According to Policarpo & Cruz, it allowed for local governments to expand their tax exemption policies aiming at attracting investments to their states.
Piancastelli & Perobelli (1996) argue that the new Constitution of 1988 had a great effect on public coffers. State governments’ expenditures raised, but fiscal transfers from the national government did not manage to grow accordingly. States plunged into debt and it seemed a way out of that situation to enforce and collect taxes, the most important of which is the Brazilian State Value-Added Tax on Goods and Services, or (ICMS - Imposto sobre Circulação de Mercadorias e Prestação de Serviços, in Portuguese). A box detailing this particular tax is presented ahead. According to the authors, tax competition has made it difficult for state governments to reorganize their finance. Although attracting new investments seems important, tax exemptions have contributed to a decline in the quality of the public services provided by the states.
comments. Ahead we shall see how different authors have been debating this topic in Brazil in the last three decades.
One of the pioneer works on this topic, Varsano (1977) argues against tax exemption policies being unregulated, since they eventually produce negative results, according to the author. States’ governments actually lose when major tax exemptions are made available to private companies. If all states enter into a tax competition, taxation in general is likely to become lower, but as tax threshold at state level is maintained tax competition is turned into a mere tax exemption by local departments of finance. Varsano also questions that minor states may benefit from using tax exemptions to compete with major states. According to the author, eventually governments of more developed states are able to lower the ICMS to higher thresholds and still provide valued public services to the population, while the underdeveloped states tend to lose tax revenues and thus lower the quality of public services.
Piancastelli & Perobelli analyze from a historical perspective the aggravation of tax policies in Brazil. They conclude that states’ governments had had previous knowledge of tax exemption aggravating local accounts, but they just chose to look the other way. Fiscal incomes accruing to economic activities that could help reorganize public coffers have turned into a real problem for the states’ departments of finance.
Prado examines the pros and cons of tax competition. He argues that in Brazil the political system is not organized in a way to manage the competition between states’ governments. In addition, the internationalization of national economies has also made it difficult for governments to design centralized industrialization policies and has reduced national government’s ability to design truly effective macroeconomic policies.
Varsano, Ferreira & Afonso (2002) believe that tax exemptions are important tools to promote local development, but they should not result from an ill-advised decision-making at risk of jeopardizing states’ accounts. Their study shows that tax competition at state level is a natural outcome of the decentralization of manufacturing activities in Brazil and that states’ governments should be aware of the market dynamics, as private companies will seek to maximize their gains by demanding bigger redistributive efforts from the governments. Private companies tend to invest in more developed regions and thus contribute to deepen regional inequalities. It is worth to mention, however, that before approving tax exemptions states’ governments should estimate future gains and determine whether they will be advantageous to society and the public coffers.
Nascimento (2008) analyses tax competition in Brazil during the 1990s and has not established a clear relationship between tax exemptions and the decentralization of manufacturing activities. He finds that São Paulo’s department of finance has plunged into debt due to companies relocating towards other jurisdictions that had offered to lower tax burden. The relocation of manufacturing firms has had a double effect on public coffers: led to lower tax revenues in more developed states and, due to tax exemptions, also led to lower revenues in the less developed states.
A study conducted by the Pro-Development Brazilian Association (Adial-Brasil -Associação Brasileira
Pró-Desenvolvimento, in Portuguese) in 2009 advocates that states’ governments should make use of tax
competition to attract investments, as the national government has failed to undertake a clear-cut policy for regional development. It is argued that putting an end to tax competition would be a disaster for the country, but improvements in that instrument are needed, especially in regards to its regulation by the national government.
Policarpo & Cruz (2010) find that increases in employment and tax exemptions in the Northeast regions are positively related, but argue that the lowering of tax burden by states’ governments must be complemented with a regional development policy. A better geographic distribution of economic activities in the countryside of the several Northeast states is needed, since most investments tend to be
concentrated in the suburbs of states’ capitals.
Vasconcelos, Vasconcelos & Lima Junior (2012) study the tax exemption policy conducted by the government of the state of Rio de Janeiro and compare it to the lack of tax exemptions offered by the state of Minas Gerais. Since those two states are geographically close and have similar economic structures, it is clear that the municipalities located in the state of Rio de Janeiro have received a larger amount of industrial investments. The authors highlight that both states should make plans in the long run, though tax competition in the short term is believed to be beneficial in terms of attracting investments.
Brazilian State Value-Added Tax on Goods and Services
(ICMS - Imposto sobre Circulação de Mercadorias e Prestação de Serviços)
The Brazilian State Value-Added Tax on Goods and Services (ICMS, in Portuguese) is levied at the state level, including the Federal District of Brasília. The ICMS was born out of studies that sought to improve the previous system of taxation, which produced a cascade effect. Among the alternatives to change the tax code, figured a consumption tax and also a value-added tax levied at each stage in the economic chain of supply, just like in the French system.
While the consumption tax is collected at the point of purchase by the end consumer, the value-added tax is levied at each stage (sales) throughout the supply chain. To simplify the tax system, governments may choose to collect origin or destination-based taxes. The ICMS is levied at the state level, including the Federal District, and tax rates vary depending on the type of goods or services. On average, the rate of ICMS is 18%. For essential food supplies the rate is reduced, but for non essential goods such as tobacco, perfumes and wine, the rate of ICMS is 25%.
The ICMS is a non-cumulative tax on the circulation of goods and services, which means it applies to all provisions of a taxable product. As a non-cumulative tax, at each taxable transaction (sale/purchase), a fiscal credit/debit is created and must be examined. For instance, if a business sells a taxable good for R$ 200.00 and the applicable rate of ICMS is 10%, a fiscal debt of R$ 20.00 must be collected. To avoid the cascade effect, the ICMS system also provides a fiscal credit related to its application on the purchase of inputs. That is, when a firm purchases inputs to its operations, seller issues an invoice that informs the amount of ICMS charged on that operation, which, in turn, is converted into a fiscal credit to be claimed by the firm who has purchased those inputs. If the firm is located in the state of Rio de Janeiro, the local tax authority must collect the difference between ICMS credits and debts.
The motivation behind the heated debate on the ICMS is the freedom each state has to modify the rate of ICMS according to the goal of attracting investments to regions which cannot compete only by infrastructure and labor force. Tax competition has become aggressive and lawsuits over changes in the rate of ICMS have been taken to the Supreme Court rule. Since today the ICMS is an origin-based tax, it favors the states with massive industrial production, such as São Paulo, whose main revenue source is the ICMS. Other states with less developed manufacturing industries tend to reduce the ICMS threshold in an effort to attract manufacturing firms seeking fiscal advantages to make locational decisions.
According to the Secretariat of the Federal Revenue of Brazil, in 2012 the total tax revenue represented 35.85% of GDP, while the ICMS alone accounted for 7.46% of GDP. According to Lourenço (2014), total tax exemptions account for 4.4% of GDP, being 3.2% at the national level and 1.2% at the state level (ICMS).
3.
Methodology and Manufacturing Data Source
In years 2003/2012 Brazil went through a period of major social and economic change. After President Lula took office in 2003, he clearly aimed at reducing poverty and income inequality by adopting
distributive policies, among which the best known is the Bolsa Família program2. In addition, the policy of
increasing the federal minimum wage has pushed up the wages of low-wage workers and the official social security floor3.
From a macroeconomic perspective, Brazil experienced relatively high economic growth between 2004 and 2008 (4.8% per year), but eventually was hit by the international crisis. Since then, economic growth has been relatively low except for year 2010 (7.5%). In years 2009/2013, GDP annual growth rate was 2.5% and in the period 2011/2013 it amounted to barely 2% per year.
Brazil is divided into 27 states, 137 mesoregions, 556 microregions and 5570 municipalities. A breakdown by mesoregion is used in the present study to analyze the spatial deconcentration of manufacturing activities. In our framework, each state is divided into about five mesoregions, so a mesoregion provides a breakdown at an intermediate, but reasonable level of geographical disaggregation. Thus it has the advantage of simplifying the analysis which would be otherwise difficult if it were to consider hundreds or thousands of units depicting microregions or municipalities.
The dataset contains data on manufacturing and miningretrieved from the Annual Social Information Survey (RAIS - Relação Anual de Informações Sociais, in Portuguese), and a breakdown by firms, jobs, wages, and average wage4. Wages are deflated by the National Consumer Price Index (IPCA - Índice de
Preços ao Consumidor Ampliado, in Portuguese), which is officially used to measure inflation in Brazil and
is herein used to escalate the 2003/2012 data series.
For the analysis, industrial activity is disaggregated at a “division” level, with a breakdown into 23 divisions in manufacturing and four in mining.
Spatial deconcentration patterns have been analyzed using typical measures such as concentration ratios that inform the ratio of each variable (firms, jobs, wages) in the main mesoregions; and the Hirschmann-Herfindahl Index (HHI), that ranges from 0 to 10,000, where increased indexes indicate increased spatial concentration.
4. First Results
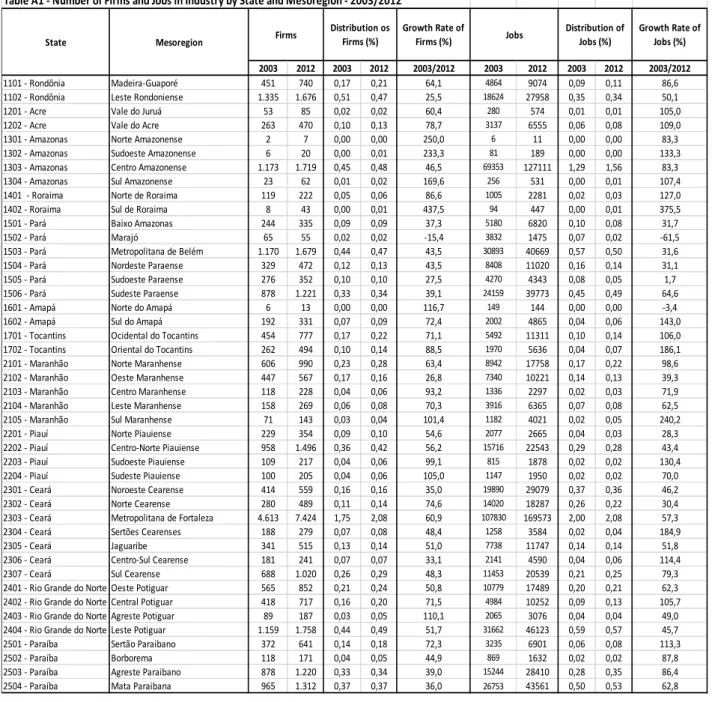
Our analysis has yielded favorable results for the four variables in the period being examined. The number of firms has grown by 35.3%, from 263,331 to 356,329. Jobs have risen by 51.6%, increasing from 5,379,853 to 8,153,329. And real wages have soared by 96.9%, amounting R$ 16.1 billion per month in 20125. Since total wage growth has been higher than job growth in the period 2003/2012, the average real wage has grown by 29.9%, from R$ 1,522 to R$ 1,977.
In Brazil, manufacturing industries have been mainly driven by the production of foods and beverages, textiles, clothing and footwear, and furniture. Still, in general the highest growth rates in the period have
2
For a discussion of the Bolsa Familia program see Lavinas (2013). 3
The federal minimum wage has increased by 69.5% between 2003 and 2012. The social security floor is equal to the minimum wage.
4 Those are the main variables examined by RAIS in relation to Brazil’s formal economy. 5
As mentioned before, monetary values have been updated for 2012. The average exchange rate of that year was approximately R$ 2 / USD 1.
been observed in more modern manufacturing sectors such as machinery and equipment, computer and electronic products, transport equipments and others. See Tables 1 and 2.
5. Evidences on the Continuing Process of Spatial Deconcentration
The analysis of spatial deconcentration in Brazilian industry will be facilitated by the breakdown of the 137 mesoregions into six groups organized in a descending order of importance related to each of the four variables being examined. Group 1 includes the five main mesoregions; group 2 contains the following 20; groups 3 to 5 bring together 25 mesoregions each; and group 6 includes the 37 mesoregions left. In the attachment individual data on each of the 137 mesoregions are presented.
The degree of geographic concentration of industrial activities is still very high, but spatial deconcentration has clearly expanded in the period 2003/2012. The analysis of the variable number of firms, for example, reveals that the main mesoregion - the Metropolitan Region of Sao Paulo - has lost share, from 14.4% to 12.4%, while the main five mesoregions have lost share by 2.9 p.p. altogether, from 30.8% to 27.9%. In contrast, the 37 more underdeveloped mesoregions of the country have gained share, from 2.1% to 2.6%, thus incorporating 0.5 p.p. from those 2.9 p.p. lost by the five main mesoregions. That corresponds to an increase of 23% in their share of employment. The Hirschmann-Herfindahl Index (HHI) has fallen from 367 to 311 in the period, which confirms that deconcentration has expanded (see Table 3 and Figure 1).
Figure 2 presents the growth rate of the number of firms in the period for each of the six groups being examined. While in the five main mesoregions the number of firms has increased by 22.2%, in the 37 less important ones it has soared by 66.7%, which corroborates our findings on the process of spatial deconcentration. In the intermediate-size groups, growth rate has ranged from 32.5% to 54.8% in the period.
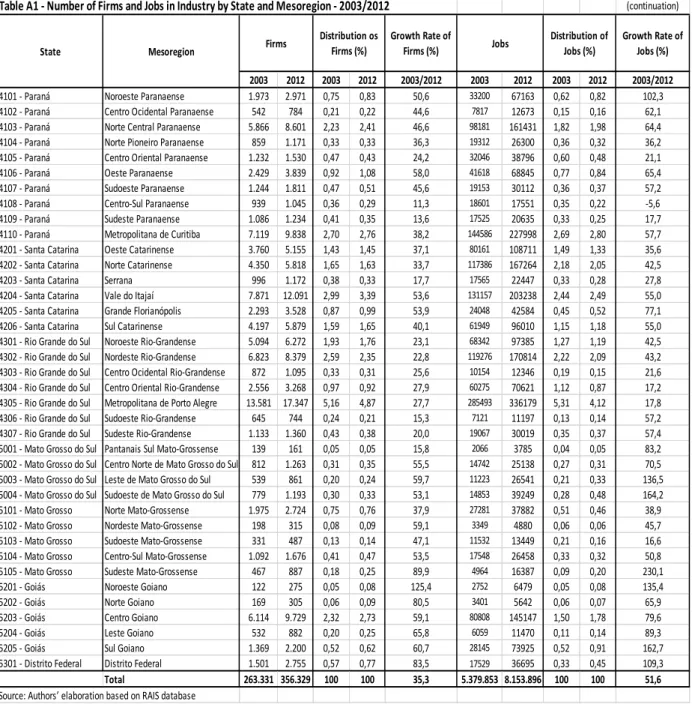
The analysis of the variable jobs reveals that the share of the Metropolitan Region of Sao Paulo alone and the five main mesoregions altogether has decreased from 16.8% to 14.3% and from 34.2% to 30.6%, respectively. That is, they have lost share by 3.6p.p., an amount that has been distributed among the less developed regions. In the 37 regions with the lowest employment rates, the share of total employment has increased from 1.4% to 1.7% in the period - a result that, despite being seemingly small in absolute terms, represents an increase of 22%. The HHI Index has fell from 444 to 362, thus indicating the geographic decentralization of jobs as well.
The rate of job growth in the period has increased accordingly in all groups of mesoregions where manufacturing is less developed. While in the five major mesoregions a 35.6% increase in jobs have been registered, in the group of the 37 minor ones job growth has peaked 85.1%. In all intermediate-size groups growth rates have revolved around 60% (see Figure 3).
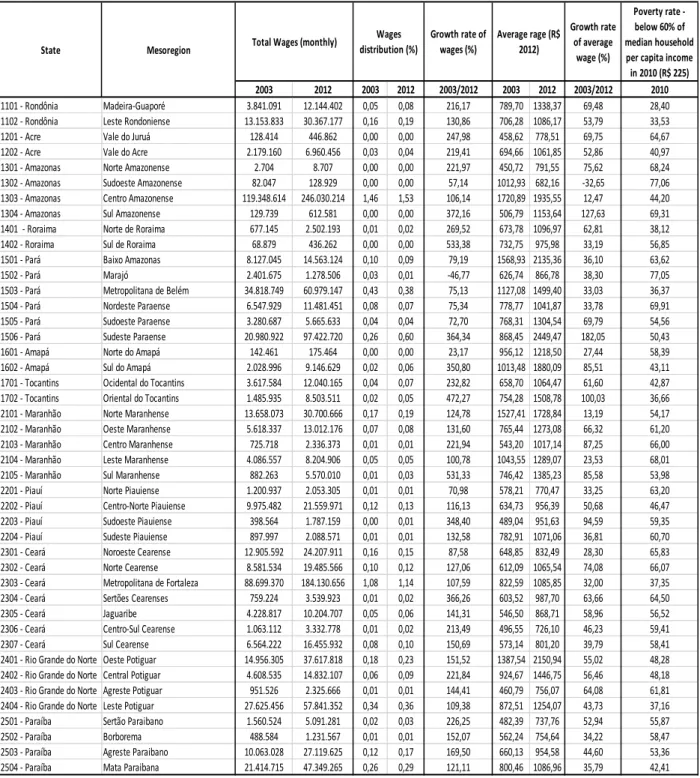
Since in the more developed mesoregions workers are paid higher wages, spatial concentration of wages is higher compared to the other variables. And yet a similar movement towards spatial deconcentration has also been found nonetheless. Again the Metropolitan Region of Sao Paulo area has lost share, from 25.9% to 20.3%, while the five main mesoregions have had their share decreased from 45.9% to 40.8% (most of it due to the results in Metropolitan Sao Paulo). The share of the 37 less important industrial mesoregions has increased from 0.7% to 1%, that is a growth of 48%. The HHI index of wages is clearly higher, but it has also decreased in the period, from 852 to 607.
The increase in wage levels has been more intensive in the less developed regions. While in the five major regions real growth rate has been 75.1%, in the 37 less developed ones it has peaked 190.7%, or almost tripled in real terms during the nine years under analysis. Figure 4 ahead illustrates that.
As expected, average wages are much higher in the more developed regions where most of the country’s manufacturing firms are located. For instance, in 2012 the average wage paid in the five main mesoregions was three times the average wage paid in the 37 less developed ones. Nonetheless, the evolution of wages paid in the less developed mesoregions has been quite favorable in the period, and the wage gap among the mesoregions has reduced. See Figures 5 and 6.
A number of industries are more geographically concentrated than others. In general, the lowest levels of geographic concentration are found in traditional industries, but deconcentration is actually widespread. As a general rule, the lowest level of geographic concentration is obtained for the variable number of firms, whereas the highest is obtained for wages. Despite the variable being focused, the level of geographic concentration in Brazilian manufacturing activities has unequivocally decreased in the analyzed period nonetheless.
Taking wages as an example, only in the divisions of mining of metallic minerals and manufacture of refined petroleum products and blending of biofuels there has been an increase in geographic concentration. Even in industries where concentration is relatively low there has been a decrease in concentration levels, such as in mining of non-metallic minerals, manufacture of food products and beverages, manufacture of products of wood and furniture, manufacture of non-metallic products, and recycling. Similar outcomes have been found for the other two variables –number of firms and jobs. Table 4 illustrates how spatial deconcentration of manufacturing and mining industries in Brazil has behaved for each of the three variables being examined.
A few maps illustrating the evolution of spatial deconcentration in Brazilian manufacturing across the 137 mesoregions in years 2003/2012 are presented in the attachment.
6.
An example of policies aimed at attracting industrial investments to the
countryside - the case of the mesoregion of South Goias
The case of the municipality of Catalão, located in South Goias, will be described to illustrate the type of policy being undertaken by states’ and local governments to attract industrial investments.
In years 2003/2012, the mesoregion of South Goias has had its number of firms increased by 60.7%; the number of workers, by 162.7%; wages, by 324.4%; and the real average wage, by 61.6%. In 2012, the region counted 2,200 industrial firms and 73,925 jobs, paying an amount of R$ 124 million in wages per month or an average wage of R$ 1,675.
We shall discuss the opening of the Mitsubishi car assembly plant in the municipality of Catalão in 1998 - the first auto manufacturing facility to operate in Midwest Brazil6. According to Silva Só (2004), a comparative advantage of the city of Catalão at the time was the expansion of education infrastructure, which had taken the overall education level of the population above the average of the state of Goias in the period 1930/1990. The educational outcomes of Catalão were believed to be a result of the proximity to major cities (Uberlandia, Goiania and Brasilia); the presence of professional training institutions such as the National Industrial Training Service (SENAI -Serviço Nacional de Aprendizagem Industrial, in Portuguese) and the National Sales Training Service (SENAC - Serviço Nacional de Aprendizagem
Comercial, in Portuguese), as well as of a large number of universities (both private and public).
In addition, state-led program FOMENTAR7 also contributed to the significant development of the
Catalão8. Not only Mitsubishi started operations in the municipality, but also John Deere opened a plant
there, in a clear sign of local manufacturing activities converging with local crop and animal production. Among the attractive factors of Catalão considered in the locational decision-making by the auto manufacturing companies are the existence of weak labor unions to organize local workers; the aforementioned higher education level of the population; the large amount of young workers lacking experience and willing to be paid low wages; the logistics convenience of being close to a railroad system; a substantial local market for 4x4 cars; and lower-level government’s policies aimed at attracting investments9.
6
See “Mitsubishi to double production in Catalão”, O Popular, 04/27/2011 (our translation).
7
FOMENTAR (Fund to Support Manufacturing in the State of Goias - in Portuguese, Fundo de Participação
e Fomento à Industrialização do Estado de Goiás) was created by the Law n. 9489 passed on April 7,
1984, with a view to stimulate the development and expansion of manufacturing activities in the state of Goias. Eventually, it has been replaced by PRODUZIR (Program for the Development of Manufacturing in the State of Goias - in Portuguese, Programa de Desenvolvimento Industrial do Estado de Goiás), created by the Law n. 13.591 passed on January 18, 2000.
8
See Guimarães & Ribeiro (2006).
9
Charts 1 and 2 below list the different types of benefits and incentives offered to Mitsubishi by the lower-level government to attract the car assembly plant to Catalão10.
Chart 1 - Incentives and benefits offered by state government
70% ICMS exemption for 20 years;
Funding guarantee of R$ 4 million to plant installation and operation;
Approval and release of public funds from the Constitutional Fund of the Midwest for plant construction and installation;
Efforts to approve a special working capital funding; Creation of a customs office at the municipality;
Supporting the company’s bid for obtaining the approval of its registration in R.A.E.; Sale of land for construction, including infrastructure work, for R$ 0.25 per square meter; Water supply of 10 cubic meters per hour;
Free connection to water supply and sewerage systems;
Construction of a railroad branch for exclusive use of the car assembly plant; Adapting local airport infrastructure;
90-day limit to collect the ICMS charged on the taxable goods; 50% ICMS exemption to be charged on the unsubsidized operations; Expansion of high voltage power lines;
Purchase and installation by TELEGOIAS of up to 40 landlines, toll-free lines and PLDC (Private
Line for Data Communication).
Chart 2 - Incentives and benefits offered by the municipality
Free asphalt paving of both access and internal streets; Plant terrain urbanization;
Provision of earthwork and rainwater drainage services; Execution of landscape works at the area;
Restructuring of public transport system; Provision of child day care to plant employees.
Maintenance of a community health center in the vicinity;
Creation of a fireman station in the vicinity;
Free transportation of all materials for plant construction; Partial ISSQN (service tax) exemption;
Local housing tax exemption on the plant building during the funding entitlement period; Installation of street lights on plant access streets and internal areas.
Refuse collection.
7. Poverty and Creation of Jobs and Wages in Manufacturing and Mining
Industries
One of the most remarkable changes occurred in Brazil in recent years has been the reduction in poverty rates. A combination of significant improvements in the labor market, a national policy of increasing the federal minimum wage, and distributive policies undertaken by the national government has contributed to the reduction of poverty and indigence rates.
All poverty indicators at an aggregate level have shown a sharp fall throughout the 2000s. Taking the poverty threshold applied in Bolsa Família as an example, poverty rate has decreased from 35.8% in 2001 to 11% in 201111.
Since spatial deconcentration of manufacturing activities has benefited the less developed regions of the country, it is reasonable to assume that those regions were also the poorest ones and might have benefited as well from the relocation of economic activities. In this section, we shall examine if spatial deconcentration has gone towards the poorer regions of the country.
With that in mind, we will compare the growth rates of number of firms, jobs, wages, and average wages in years 2003/2012 described in previous sections, on one hand, and poverty rates in all 137 mesoregions
in 2010, on the other. Map 1 illustrates poverty rates in the 137 mesoregions in 201012.
11
See Lavinas (2013). In 2014 the Bolsa Família program applies a poverty threshold of R$ 154, that is, a little less than USD 70.
12
We used poverty data related to year 2010 since that was the year of the last National Census conducted by the Brazilian Census Bureau (IBGE - Instituto Brasileiro de Geografia e Estatística, in Portuguese), which covers the whole territory of Brazil and thus is the only source of data on poverty related to the 137 mesoregions of the country. The poverty threshold referenced in this study corresponds to 60% of the median value of the per capita household income according to the Census (R$ 225). Original data are disaggregated by municipalities and have been reaggregated into the 137 mesoregions.
At the beginning correlations have been calculated between the amount of firms, jobs, wages and the average wage paid in all mesoregions in year 2012, and the poverty rates registered in 201013. As expected, industrial activities tend to be more developed in the richest mesoregions of the country. Correlation coefficients between poverty rates and each variable are negative, respectively 0.76, 0.73,
-0.75, and -0.5914. Correlations are shown in the scatter diagrams of Figures 7 to 10.
13
Since the variables related to industrial activities in the mesoregions have shown great variations, we have chosen the ordinal correlation. Each variable has taken an ascending order of values. For instance, in case of poverty data, the lowest position in the order corresponds to the lowest poverty level. In Graphs 7 to 14, the straight lines have been obtained by the linear least squares adjustment method. Straight lines with negative inclination correspond to the negative correlation coefficients and vice-versa.
After that, correlations have been estimated between poverty rates in the mesoregions in 2010 and the growth rate of each variable in the period 2003/2012. Correlation coefficients are now positive: 0.45, 0.16, 0.23, 0.28, respectively. Although relatively small in absolute terms, all coefficients are positive, which suggests that the amount of firms, jobs, wages, and average wages increased more in the poorest
mesoregions of the country15. Thus, geographic deconcentration of manufacturing has positively
contributed to income and job creation and probably to poverty reduction in those mesoregions as well. The scatter diagrams in Figures 11 to 14 show the correlations between poverty and the growth rate of the four variables considered.
15
8.
Conclusion
Brazil has seen a sharp fall in poverty rates in recent years due to many factors, one of the most important of which is the pro-poor redistributive policies, especially Bolsa Familia program. The favorable behavior of the labor market and the increase in the federal minimum wage have also contributed to the poverty reduction in the period.
Simultaneously to poverty reduction, an intense process of spatial deconcentration of economic activities has taken place, with the less developed regions of the country gaining importance. The present study has provided corroborating evidence on those findings by analyzing different variables, such as the number of firms and jobs and the wages paid in manufacturing and mining industries.
Geographic decentralization of economic activity has been occurring for a few decades, as a result of investment attraction policies based on fiscal and credit incentives undertaken by states’ governments in face of the national government’s unsatisfactory performance in fighting regional inequalities. Lower-level governments’ policies have been subjected to criticism due to costs to be incurred by the involved states and municipalities, but eventually the outcome is the undoubted spatial deconcentration of industrial activities in the country.
The present study has found a positive correlation between local poverty levels and the expansion of manufacturing activities regionally, as the regions featuring the highest poverty levels have benefited the most in terms of job and wage growth. Thus, spatial deconcentration of industrial activities should have contributed to poverty reduction in those regions by creating jobs and income.
There is no doubt that tax competition is not the best way to pursue regional development. However, in face of the interests of local governments and the lack of unified policies by the central government to grow the underdeveloped regions, tax competition has become beneficial to those who manage to take one step ahead and offer the manufacturing firms more advantageous conditions, with real outcomes like those we have just examined.
References
Andrade, T. A., Serra, R.V. - Distribuição espacial da indústria: possibilidades atuais para sua investigação. Estudos Econômicos, v.30, n.2, April/June 2000.
Ardissone, M. S. – Mudança na distribuição espacial das atividades industriais por microrregião no período
1996/2005. PhD Thesis, Instituto de Economia, UFRJ, 2009.
Associação Brasileira Pró-Desenvolvimento Regional. - Importância dos Incentivos Fiscais Regionais para o Desenvolvimento Econômico-Social. São Paulo, December 2009.
Azevedo, P. F., Toneto Júnior, R. – Relocalização do emprego industrial formal no Brasil na década de 90. Pesquisa e Planejamento Econômico, v. 31, n. 1, April 2001.
Azzoni, C. R. – Sobre a Necessidade da Política Regional, in Unidade e Fragmentação: a questão regional no Brasil. São Paulo: Perspectiva, 2002.
Crocco, M. A. et alli – Metodologia de Identificação da Arranjos Produtivos Locais. Nova Economia, v. 16, n. 2, August 2006.
Diniz, C.C. – Desenvolvimento poligonal no Brasil: nem desconcentração, nem contínua polarização. NovaEconomia, v.3, n. 1, September 1993.
Diniz, C. C., Crocco, M. A. – Reestruturação econômica e impacto regional: o novo mapa da indústria
brasileira. Nova Economia, v.6, n. 1, July 1996.
Diniz, C. C. – A questão regional e as políticas governamentais no Brasil. Texto para Discussão, n. 159 – Cedeplar, UFMG, Belo Horizonte, 1995.
Diniz, C. C., Campolina, B. – A região metropolitana de São Paulo: reestruturação, re-espacialização e
novas funções. Review Eure, v. 33,2007.
Dulci, O. S. – Guerra fiscal, desenvolvimento desigual e relações federativas no Brasil. Revista de Sociologia e Política, n.18: 95/107, June 2012.
Ferraz, J. C., Kupfer, D., Haguenauer, L. - Made in Brazil: Desafios Competitivos para a Indústria Brasileira. Ed. Campus, Rio de Janeiro, 1996.
Garcia, R. A., Lemos, M. B., Carvalho, J. A. M. - A Evolução das áreas de influência demográfica e
econômico-demográfica dos polos econômicos brasileiros entre 1980, 1991 e 2000. Texto para Discussão,
n. 224, Cedeplar, UFMG, Belo Horizonte, October 2003.
Guimarães, E. N., Ribeiro, R. A. A nova fronteira industrial do sudeste de Goiás. Multiciência, UNICAMP, v. 06, Campinas, 2006.
Kupfer, D., Rocha, C. - Dinâmica da produtividade e heterogeneidade estrutural na indústria
Chile, 2004.
Lavinas, L. - 21st Century Development, New Left Review, n. 84, November/December, 2013.
Lemos, M. B. et. alli - A nova configuração regional brasileira e sua geografia econômica. Estudos Econômicos, v.33, n. 4, October/December 2003.
Lemos, M. B. et alli – A organização territorial da indústria no Brasil, in De Negri, J. A. and Salerno, M. S. Inovações, Padrões Tecnológicos e Desempenho das Firmas Industriais Brasileiras. IPEA, Rio de Janeiro, 2005.
Lourenço, G.M. – O Peso e o Preço da Guerra Fiscal. Análise Conjuntural, IPARDES, v. 16, n. 3-4, March/April, 2014.
Nascimento, S. P. - Guerra Fiscal: uma avaliação comparativa entre alguns Estados participantes. Economia Aplicada, São Paulo, v. 12, n. 4, October/December 2008.
Negri, B. – Concentração e Desconcentração Industrial em São Paulo (1880-1990).PhD Thesis, Unicamp, Campinas, 1994.
Oliveira Jr, M. – Aglomeração Espacial e Eficiência Industrial: Um estudo a partir da evolução da produtividade nos municípios brasileiros de 1970 a 1996. PhD Thesis, Instituto de Economia, UFRJ,Rio de Janeiro, 2006.
Pacheco, C. A. – Novos padrões de localização industrial? Tendências recentes dos indicadores da produção e do investimento industrial. Discussion Text, n. 633. IPEA, Brasília, March 1999. Pereira, F. M., Lemos, M. B. - Cidades médias brasileiras: características e dinâmicas
urbano-industriais. Pesquisa e Planejamento Econômico, v.33, n.1, April 2003.
Piancastelli, M., Perobelli, F. - ICMS: Evolução Recente e Guerra Fiscal. IPEA – Texto para Discussão, n. 402, IPEA, February 1996.
Policarpo, J. R. L., Da Cruz, A. C. L. - Programas de desenvolvimento local na região Nordeste do Brasil: uma avaliação preliminar da “guerra fiscal”. Economia e Sociedade, Campinas, v. 19, n. 3, December 2010. Prado, S. - Guerra Fiscal e políticas de desenvolvimento estadual no Brasil. Economia e Sociedade, v. 13, n. 2, December 1999.
Ramos, L., Ferreira, V. - Geração de empregos e realocação espacial do mercado de trabalho brasileiro - 1992-2002. Pesquisa e Planejamento Econômico, v. 35, n.1, April 2005.
Ribeiro, R. A., Cunha, S. Mitsubishi: organização da produção e do trabalho. In: Araújo, S. M., Trabalho e capital em trânsito: a indústria automobilística no Brasil. Ed. UFPR, Curitiba, 2007. Saboia, J. – Descentralização industrial no Brasil nos anos 90: um enfoque regional. Pesquisa e
Planejamento Econômico, v. 30, n. 1, April 2000.
Saboia, J. - Descentralização industrial no Brasil na década de noventa: um processo dinâmico e diferenciado regionalmente. Nova Economia, v. 11, n.2, December 2001.
Saboia, J. - A indústria brasileira no Nordeste e as desigualdades inter e intra regionais. Econômica, v.6, n. 1, June 2004.
Saboia, J. – A continuação do processo de desconcentração regional da indústria brasileira nos anos 2000. Nova Economia, v.23, n. 2, May/August 2013,
ordenação a partir de um novo índice. Nova Economia, v. 18, n. 3, December 2008.
SENAI - Geração do Emprego Industrial nas Capitais e Interior do Brasil. Brasília, 2005.
Silva Só, L.L. - Desenvolvimento em municípios rurais: a margem da estrada de ferro em Goiás. MSc Dissertation, Instituto de Economia, UFU, Uberlândia, 2004.
Siqueira, A. D., Instalação da Mitsubishi em Catalão: elementos que definem a escolha como uma decisão estratégica, CEPPG–CESUC – Centro de Ensino Superior de Catalão , v. XI, n. 20, 2nd Semester 2009. Suzigan, W., Furtado, J., Garcia, R., Sampaio, S. E. K. - Aglomerações industriais no Estado de São Paulo. Economia Aplicada, v.5, n.4, October/December 2001.
Varsano, R. – A guerra fiscal do ICMS: Quem ganha e quem perde. Discussion Text, n. 500, IPEA, July 1977. Varsano, R., Ferreira, S. G., Afonso, J. R. - Fiscal competition: Bird’s eye view. Discussion Text, n. 887, IPEA, June 2002.
Vasconcelos, C. R. F., Vasconcelos, S. P., Lima Júnior, L. A. - A sensibilidade da decisão de localização das
firmas a argumentos fiscais e não fiscais: Evidências empíricas para municípios selecionados. Análise Econômica, v. 30, n.58, September 2012.
Table A1 - Number of Firms and Jobs in Industry by State and Mesoregion - 2003/2012
2003 2012 2003 2012 2003/2012 2003 2012 2003 2012 2003/2012
1101 - Rondônia Madeira-Guaporé 451 740 0,17 0,21 64,1 4864 9074 0,09 0,11 86,6 1102 - Rondônia Leste Rondoniense 1.335 1.676 0,51 0,47 25,5 18624 27958 0,35 0,34 50,1 1201 - Acre Vale do Juruá 53 85 0,02 0,02 60,4 280 574 0,01 0,01 105,0 1202 - Acre Vale do Acre 263 470 0,10 0,13 78,7 3137 6555 0,06 0,08 109,0 1301 - Amazonas Norte Amazonense 2 7 0,00 0,00 250,0 6 11 0,00 0,00 83,3 1302 - Amazonas Sudoeste Amazonense 6 20 0,00 0,01 233,3 81 189 0,00 0,00 133,3 1303 - Amazonas Centro Amazonense 1.173 1.719 0,45 0,48 46,5 69353 127111 1,29 1,56 83,3 1304 - Amazonas Sul Amazonense 23 62 0,01 0,02 169,6 256 531 0,00 0,01 107,4 1401 - Roraima Norte de Roraima 119 222 0,05 0,06 86,6 1005 2281 0,02 0,03 127,0 1402 - Roraima Sul de Roraima 8 43 0,00 0,01 437,5 94 447 0,00 0,01 375,5 1501 - Pará Baixo Amazonas 244 335 0,09 0,09 37,3 5180 6820 0,10 0,08 31,7 1502 - Pará Marajó 65 55 0,02 0,02 -15,4 3832 1475 0,07 0,02 -61,5 1503 - Pará Metropolitana de Belém 1.170 1.679 0,44 0,47 43,5 30893 40669 0,57 0,50 31,6 1504 - Pará Nordeste Paraense 329 472 0,12 0,13 43,5 8408 11020 0,16 0,14 31,1 1505 - Pará Sudoeste Paraense 276 352 0,10 0,10 27,5 4270 4343 0,08 0,05 1,7 1506 - Pará Sudeste Paraense 878 1.221 0,33 0,34 39,1 24159 39773 0,45 0,49 64,6 1601 - Amapá Norte do Amapá 6 13 0,00 0,00 116,7 149 144 0,00 0,00 -3,4 1602 - Amapá Sul do Amapá 192 331 0,07 0,09 72,4 2002 4865 0,04 0,06 143,0 1701 - Tocantins Ocidental do Tocantins 454 777 0,17 0,22 71,1 5492 11311 0,10 0,14 106,0 1702 - Tocantins Oriental do Tocantins 262 494 0,10 0,14 88,5 1970 5636 0,04 0,07 186,1 2101 - Maranhão Norte Maranhense 606 990 0,23 0,28 63,4 8942 17758 0,17 0,22 98,6 2102 - Maranhão Oeste Maranhense 447 567 0,17 0,16 26,8 7340 10221 0,14 0,13 39,3 2103 - Maranhão Centro Maranhense 118 228 0,04 0,06 93,2 1336 2297 0,02 0,03 71,9 2104 - Maranhão Leste Maranhense 158 269 0,06 0,08 70,3 3916 6365 0,07 0,08 62,5 2105 - Maranhão Sul Maranhense 71 143 0,03 0,04 101,4 1182 4021 0,02 0,05 240,2 2201 - Piauí Norte Piauiense 229 354 0,09 0,10 54,6 2077 2665 0,04 0,03 28,3 2202 - Piauí Centro-Norte Piauiense 958 1.496 0,36 0,42 56,2 15716 22543 0,29 0,28 43,4 2203 - Piauí Sudoeste Piauiense 109 217 0,04 0,06 99,1 815 1878 0,02 0,02 130,4 2204 - Piauí Sudeste Piauiense 100 205 0,04 0,06 105,0 1147 1950 0,02 0,02 70,0 2301 - Ceará Noroeste Cearense 414 559 0,16 0,16 35,0 19890 29079 0,37 0,36 46,2 2302 - Ceará Norte Cearense 280 489 0,11 0,14 74,6 14020 18287 0,26 0,22 30,4 2303 - Ceará Metropolitana de Fortaleza 4.613 7.424 1,75 2,08 60,9 107830 169573 2,00 2,08 57,3 2304 - Ceará Sertões Cearenses 188 279 0,07 0,08 48,4 1258 3584 0,02 0,04 184,9 2305 - Ceará Jaguaribe 341 515 0,13 0,14 51,0 7738 11747 0,14 0,14 51,8 2306 - Ceará Centro-Sul Cearense 181 241 0,07 0,07 33,1 2141 4590 0,04 0,06 114,4 2307 - Ceará Sul Cearense 688 1.020 0,26 0,29 48,3 11453 20539 0,21 0,25 79,3 2401 - Rio Grande do Norte Oeste Potiguar 565 852 0,21 0,24 50,8 10779 17489 0,20 0,21 62,3 2402 - Rio Grande do Norte Central Potiguar 418 717 0,16 0,20 71,5 4984 10252 0,09 0,13 105,7 2403 - Rio Grande do Norte Agreste Potiguar 89 187 0,03 0,05 110,1 2065 3076 0,04 0,04 49,0 2404 - Rio Grande do Norte Leste Potiguar 1.159 1.758 0,44 0,49 51,7 31662 46123 0,59 0,57 45,7 2501 - Paraíba Sertão Paraibano 372 641 0,14 0,18 72,3 3235 6901 0,06 0,08 113,3 2502 - Paraíba Borborema 118 171 0,04 0,05 44,9 869 1632 0,02 0,02 87,8 2503 - Paraíba Agreste Paraibano 878 1.220 0,33 0,34 39,0 15244 28410 0,28 0,35 86,4 2504 - Paraíba Mata Paraibana 965 1.312 0,37 0,37 36,0 26753 43561 0,50 0,53 62,8
Distribution of Jobs (%)
Growth Rate of Jobs (%)
State Mesoregion Firms
Distribution os Firms (%)
Growth Rate of
Table A1 - Number of Firms and Jobs in Industry by State and Mesoregion - 2003/2012 (continuation)
2003 2012 2003 2012 2003/2012 2003 2012 2003 2012 2003/2012
2601 - Pernambuco Sertão Pernambucano 457 826 0,17 0,23 80,7 4096 8559 0,08 0,10 109,0 2602 - Pernambuco São Francisco Pernambucano 209 399 0,08 0,11 90,9 2182 4904 0,04 0,06 124,7 2603 - Pernambuco Agreste Pernambucano 1.611 3.531 0,61 0,99 119,2 17030 38987 0,32 0,48 128,9 2604 - Pernambuco Mata Pernambucana 582 890 0,22 0,25 52,9 36329 58665 0,68 0,72 61,5 2605 - Pernambuco Metropolitana de Recife 3.349 4.533 1,27 1,27 35,4 68582 114525 1,27 1,40 67,0 2701 - Alagoas Sertão Alagoano 46 85 0,02 0,02 84,8 767 1150 0,01 0,01 49,9 2702 - Alagoas Agreste Alagoano 180 317 0,07 0,09 76,1 3162 6157 0,06 0,08 94,7 2703 - Alagoas Leste Alagoano 938 1.307 0,36 0,37 39,3 76678 95628 1,43 1,17 24,7 2801 - Sergipe Sertão Sergipano 49 71 0,02 0,02 44,9 477 4273 0,01 0,05 795,8 2802 - Sergipe Agreste Sergipano 263 545 0,10 0,15 107,2 3269 13123 0,06 0,16 301,4 2803 - Sergipe Leste Sergipano 976 1.380 0,37 0,39 41,4 22779 32851 0,42 0,40 44,2 2901 - Bahia Extremo Oeste Baiano 190 512 0,07 0,14 169,5 1831 5934 0,03 0,07 224,1 2902 - Bahia Vale São-Franciscano da Bahia 205 359 0,08 0,10 75,1 4811 6764 0,09 0,08 40,6 2903 - Bahia Centro Norte Baiano 1.257 1.998 0,48 0,56 58,9 21515 40156 0,40 0,49 86,6 2904 - Bahia Nordeste Baiano 375 703 0,14 0,20 87,5 7511 13008 0,14 0,16 73,2 2905 - Bahia Metropolitana de Salvador 2.659 4.155 1,01 1,17 56,3 62212 109888 1,16 1,35 76,6 2906 - Bahia Centro Sul Baiano 1.207 1.897 0,46 0,53 57,2 19041 36598 0,35 0,45 92,2 2907 - Bahia Sul Baiano 1.191 1.688 0,45 0,47 41,7 15739 25818 0,29 0,32 64,0 3101 - Minas Gerais Noroeste de Minas 358 556 0,14 0,16 55,3 5477 9648 0,10 0,12 76,2 3102 - Minas Gerais Norte de Minas 1.062 1.451 0,40 0,41 36,6 21066 25116 0,39 0,31 19,2 3103 - Minas Gerais Jequitinhonha 409 573 0,16 0,16 40,1 3844 4811 0,07 0,06 25,2 3104 - Minas Gerais Vale do Mucuri 277 340 0,11 0,10 22,7 2586 4398 0,05 0,05 70,1 3105 - Minas Gerais Triângulo Mineiro/Alto Paranaíba 3.551 4.838 1,35 1,36 36,2 59557 96272 1,11 1,18 61,6 3106 - Minas Gerais Central Mineira 871 1.081 0,33 0,30 24,1 10489 15747 0,19 0,19 50,1 3107 - Minas Gerais Metropolitana de Belo Horizonte 10.228 13.092 3,88 3,67 28,0 196590 341043 3,65 4,18 73,5 3108 - Minas Gerais Vale do Rio Doce 1.770 2.265 0,67 0,64 28,0 33460 47172 0,62 0,58 41,0 3109 - Minas Gerais Oeste de Minas 4.042 5.378 1,53 1,51 33,1 52552 83490 0,98 1,02 58,9 3110 - Minas Gerais Sul/Sudoeste de Minas 6.262 8.520 2,38 2,39 36,1 90540 147678 1,68 1,81 63,1 3111 - Minas Gerais Campo das Vertentes 1.079 1.337 0,41 0,38 23,9 13371 20408 0,25 0,25 52,6 3112 - Minas Gerais Zona da Mata 4.574 5.798 1,74 1,63 26,8 60731 92201 1,13 1,13 51,8 3201 - Espírito Santo Noroeste Espírito-Santense 973 1.318 0,37 0,37 35,5 15091 19901 0,28 0,24 31,9 3202 - Espírito Santo Litoral Norte Espírito-Santense 690 1.027 0,26 0,29 48,8 12711 22890 0,24 0,28 80,1 3203 - Espírito Santo Central Espírito-Santense 2.567 3.802 0,97 1,07 48,1 44788 66835 0,83 0,82 49,2 3204 - Espírito Santo Sul Espírito-Santense 1.248 1.714 0,47 0,48 37,3 15154 23703 0,28 0,29 56,4 3301 - Rio de Janeiro Noroeste Fluminense 612 856 0,23 0,24 39,9 5552 10052 0,10 0,12 81,1 3302 - Rio de Janeiro Norte Fluminense 741 1.000 0,28 0,28 35,0 24827 50843 0,46 0,62 104,8 3303 - Rio de Janeiro Centro Fluminense 1.343 2.248 0,51 0,63 67,4 20906 34281 0,39 0,42 64,0 3304 - Rio de Janeiro Baixadas 414 640 0,16 0,18 54,6 4046 8682 0,08 0,11 114,6 3305 - Rio de Janeiro Sul Fluminense 895 1.273 0,34 0,36 42,2 33768 57964 0,63 0,71 71,7 3306 - Rio de Janeiro Metropolitana do Rio de Janeiro 10.451 12.479 3,97 3,50 19,4 222959 316152 4,14 3,88 41,8 3501 - São Paulo São José do Rio Preto 3.467 4.508 1,32 1,27 30,0 53704 109831 1,00 1,35 104,5 3502 - São Paulo Ribeirão Preto 5.346 7.080 2,03 1,99 32,4 117708 175916 2,19 2,16 49,5 3503 - São Paulo Araçatuba 1.581 2.028 0,60 0,57 28,3 36706 56886 0,68 0,70 55,0 3504 - São Paulo Bauru 2.827 3.499 1,07 0,98 23,8 66022 104837 1,23 1,29 58,8 3505 - São Paulo Araraquara 1.868 2.731 0,71 0,77 46,2 46477 77877 0,86 0,96 67,6 3506 - São Paulo Piracicaba 4.051 5.379 1,54 1,51 32,8 96304 165511 1,79 2,03 71,9 3507 - São Paulo Campinas 8.997 11.253 3,42 3,16 25,1 228367 336977 4,24 4,13 47,6 3508 - São Paulo Presidente Prudente 1.324 1.519 0,50 0,43 14,7 24014 44266 0,45 0,54 84,3 3509 - São Paulo Marília 913 1.051 0,35 0,29 15,1 19316 27218 0,36 0,33 40,9 3510 - São Paulo Assis 939 1.169 0,36 0,33 24,5 16973 28891 0,32 0,35 70,2 3511 - São Paulo Itapetininga 1.196 1.516 0,45 0,43 26,8 29751 46943 0,55 0,58 57,8 3512 - São Paulo Macro Metropolitana Paulista 5.098 6.975 1,94 1,96 36,8 156753 265535 2,91 3,26 69,4 3513 - São Paulo Vale do Paraíba Paulista 2.323 2.948 0,88 0,83 26,9 95117 131840 1,77 1,62 38,6 3514 - São Paulo Litoral Sul Paulista 322 361 0,12 0,10 12,1 2963 4318 0,06 0,05 45,7 3515 - São Paulo Metropolitana de São Paulo 37.945 44.258 14,41 12,42 16,6 904870 1162001 16,82 14,25 28,4
Jobs Distribution of Jobs (%) Growth Rate of Jobs (%)
State Mesoregion Firms
Distribution os Firms (%)
Growth Rate of Firms (%)
Table A1 - Number of Firms and Jobs in Industry by State and Mesoregion - 2003/2012 (continuation)
2003 2012 2003 2012 2003/2012 2003 2012 2003 2012 2003/2012
4101 - Paraná Noroeste Paranaense 1.973 2.971 0,75 0,83 50,6 33200 67163 0,62 0,82 102,3
4102 - Paraná Centro Ocidental Paranaense 542 784 0,21 0,22 44,6 7817 12673 0,15 0,16 62,1
4103 - Paraná Norte Central Paranaense 5.866 8.601 2,23 2,41 46,6 98181 161431 1,82 1,98 64,4
4104 - Paraná Norte Pioneiro Paranaense 859 1.171 0,33 0,33 36,3 19312 26300 0,36 0,32 36,2
4105 - Paraná Centro Oriental Paranaense 1.232 1.530 0,47 0,43 24,2 32046 38796 0,60 0,48 21,1
4106 - Paraná Oeste Paranaense 2.429 3.839 0,92 1,08 58,0 41618 68845 0,77 0,84 65,4
4107 - Paraná Sudoeste Paranaense 1.244 1.811 0,47 0,51 45,6 19153 30112 0,36 0,37 57,2
4108 - Paraná Centro-Sul Paranaense 939 1.045 0,36 0,29 11,3 18601 17551 0,35 0,22 -5,6
4109 - Paraná Sudeste Paranaense 1.086 1.234 0,41 0,35 13,6 17525 20635 0,33 0,25 17,7
4110 - Paraná Metropolitana de Curitiba 7.119 9.838 2,70 2,76 38,2 144586 227998 2,69 2,80 57,7
4201 - Santa Catarina Oeste Catarinense 3.760 5.155 1,43 1,45 37,1 80161 108711 1,49 1,33 35,6
4202 - Santa Catarina Norte Catarinense 4.350 5.818 1,65 1,63 33,7 117386 167264 2,18 2,05 42,5
4203 - Santa Catarina Serrana 996 1.172 0,38 0,33 17,7 17565 22447 0,33 0,28 27,8
4204 - Santa Catarina Vale do Itajaí 7.871 12.091 2,99 3,39 53,6 131157 203238 2,44 2,49 55,0
4205 - Santa Catarina Grande Florianópolis 2.293 3.528 0,87 0,99 53,9 24048 42584 0,45 0,52 77,1
4206 - Santa Catarina Sul Catarinense 4.197 5.879 1,59 1,65 40,1 61949 96010 1,15 1,18 55,0
4301 - Rio Grande do Sul Noroeste Rio-Grandense 5.094 6.272 1,93 1,76 23,1 68342 97385 1,27 1,19 42,5
4302 - Rio Grande do Sul Nordeste Rio-Grandense 6.823 8.379 2,59 2,35 22,8 119276 170814 2,22 2,09 43,2
4303 - Rio Grande do Sul Centro Ocidental Rio-Grandense 872 1.095 0,33 0,31 25,6 10154 12346 0,19 0,15 21,6
4304 - Rio Grande do Sul Centro Oriental Rio-Grandense 2.556 3.268 0,97 0,92 27,9 60275 70621 1,12 0,87 17,2 4305 - Rio Grande do Sul Metropolitana de Porto Alegre 13.581 17.347 5,16 4,87 27,7 285493 336179 5,31 4,12 17,8
4306 - Rio Grande do Sul Sudoeste Rio-Grandense 645 744 0,24 0,21 15,3 7121 11197 0,13 0,14 57,2
4307 - Rio Grande do Sul Sudeste Rio-Grandense 1.133 1.360 0,43 0,38 20,0 19067 30019 0,35 0,37 57,4
5001 - Mato Grosso do Sul Pantanais Sul Mato-Grossense 139 161 0,05 0,05 15,8 2066 3785 0,04 0,05 83,2
5002 - Mato Grosso do Sul Centro Norte de Mato Grosso do Sul 812 1.263 0,31 0,35 55,5 14742 25138 0,27 0,31 70,5
5003 - Mato Grosso do Sul Leste de Mato Grosso do Sul 539 861 0,20 0,24 59,7 11223 26541 0,21 0,33 136,5
5004 - Mato Grosso do Sul Sudoeste de Mato Grosso do Sul 779 1.193 0,30 0,33 53,1 14853 39249 0,28 0,48 164,2
5101 - Mato Grosso Norte Mato-Grossense 1.975 2.724 0,75 0,76 37,9 27281 37882 0,51 0,46 38,9
5102 - Mato Grosso Nordeste Mato-Grossense 198 315 0,08 0,09 59,1 3349 4880 0,06 0,06 45,7
5103 - Mato Grosso Sudoeste Mato-Grossense 331 487 0,13 0,14 47,1 11532 13449 0,21 0,16 16,6
5104 - Mato Grosso Centro-Sul Mato-Grossense 1.092 1.676 0,41 0,47 53,5 17548 26458 0,33 0,32 50,8
5105 - Mato Grosso Sudeste Mato-Grossense 467 887 0,18 0,25 89,9 4964 16387 0,09 0,20 230,1
5201 - Goiás Noroeste Goiano 122 275 0,05 0,08 125,4 2752 6479 0,05 0,08 135,4
5202 - Goiás Norte Goiano 169 305 0,06 0,09 80,5 3401 5642 0,06 0,07 65,9
5203 - Goiás Centro Goiano 6.114 9.729 2,32 2,73 59,1 80808 145147 1,50 1,78 79,6
5204 - Goiás Leste Goiano 532 882 0,20 0,25 65,8 6059 11470 0,11 0,14 89,3
5205 - Goiás Sul Goiano 1.369 2.200 0,52 0,62 60,7 28145 73925 0,52 0,91 162,7
5301 - Distrito Federal Distrito Federal 1.501 2.755 0,57 0,77 83,5 17529 36695 0,33 0,45 109,3
Total 263.331 356.329 100 100 35,3 5.379.853 8.153.896 100 100 51,6
Source: Authors’ elaboration based on RAIS database
State Mesoregion Firms
Distribution os Firms (%) Growth Rate of Firms (%) Jobs Distribution of Jobs (%) Growth Rate of Jobs (%)
Table A2 - Total Monthly Wages, Real Average Wages (in R$ of 2012) in Industry and Poverty Rate in 2010 by State and Mesoregion - 2003/2012
2003 2012 2003 2012 2003/2012 2003 2012 2003/2012 2010
1101 - Rondônia Madeira-Guaporé 3.841.091 12.144.402 0,05 0,08 216,17 789,70 1338,37 69,48 28,40
1102 - Rondônia Leste Rondoniense 13.153.833 30.367.177 0,16 0,19 130,86 706,28 1086,17 53,79 33,53
1201 - Acre Vale do Juruá 128.414 446.862 0,00 0,00 247,98 458,62 778,51 69,75 64,67
1202 - Acre Vale do Acre 2.179.160 6.960.456 0,03 0,04 219,41 694,66 1061,85 52,86 40,97
1301 - Amazonas Norte Amazonense 2.704 8.707 0,00 0,00 221,97 450,72 791,55 75,62 68,24
1302 - Amazonas Sudoeste Amazonense 82.047 128.929 0,00 0,00 57,14 1012,93 682,16 -32,65 77,06
1303 - Amazonas Centro Amazonense 119.348.614 246.030.214 1,46 1,53 106,14 1720,89 1935,55 12,47 44,20
1304 - Amazonas Sul Amazonense 129.739 612.581 0,00 0,00 372,16 506,79 1153,64 127,63 69,31
1401 - Roraima Norte de Roraima 677.145 2.502.193 0,01 0,02 269,52 673,78 1096,97 62,81 38,12
1402 - Roraima Sul de Roraima 68.879 436.262 0,00 0,00 533,38 732,75 975,98 33,19 56,85
1501 - Pará Baixo Amazonas 8.127.045 14.563.124 0,10 0,09 79,19 1568,93 2135,36 36,10 63,62
1502 - Pará Marajó 2.401.675 1.278.506 0,03 0,01 -46,77 626,74 866,78 38,30 77,05
1503 - Pará Metropolitana de Belém 34.818.749 60.979.147 0,43 0,38 75,13 1127,08 1499,40 33,03 36,37
1504 - Pará Nordeste Paraense 6.547.929 11.481.451 0,08 0,07 75,34 778,77 1041,87 33,78 69,91
1505 - Pará Sudoeste Paraense 3.280.687 5.665.633 0,04 0,04 72,70 768,31 1304,54 69,79 54,56
1506 - Pará Sudeste Paraense 20.980.922 97.422.720 0,26 0,60 364,34 868,45 2449,47 182,05 50,43
1601 - Amapá Norte do Amapá 142.461 175.464 0,00 0,00 23,17 956,12 1218,50 27,44 58,39
1602 - Amapá Sul do Amapá 2.028.996 9.146.629 0,02 0,06 350,80 1013,48 1880,09 85,51 43,11
1701 - Tocantins Ocidental do Tocantins 3.617.584 12.040.165 0,04 0,07 232,82 658,70 1064,47 61,60 42,87
1702 - Tocantins Oriental do Tocantins 1.485.935 8.503.511 0,02 0,05 472,27 754,28 1508,78 100,03 36,66
2101 - Maranhão Norte Maranhense 13.658.073 30.700.666 0,17 0,19 124,78 1527,41 1728,84 13,19 54,17
2102 - Maranhão Oeste Maranhense 5.618.337 13.012.176 0,07 0,08 131,60 765,44 1273,08 66,32 61,20
2103 - Maranhão Centro Maranhense 725.718 2.336.373 0,01 0,01 221,94 543,20 1017,14 87,25 66,00
2104 - Maranhão Leste Maranhense 4.086.557 8.204.906 0,05 0,05 100,78 1043,55 1289,07 23,53 68,01
2105 - Maranhão Sul Maranhense 882.263 5.570.010 0,01 0,03 531,33 746,42 1385,23 85,58 53,98
2201 - Piauí Norte Piauiense 1.200.937 2.053.305 0,01 0,01 70,98 578,21 770,47 33,25 63,20
2202 - Piauí Centro-Norte Piauiense 9.975.482 21.559.971 0,12 0,13 116,13 634,73 956,39 50,68 46,47
2203 - Piauí Sudoeste Piauiense 398.564 1.787.159 0,00 0,01 348,40 489,04 951,63 94,59 59,35
2204 - Piauí Sudeste Piauiense 897.997 2.088.571 0,01 0,01 132,58 782,91 1071,06 36,81 60,70
2301 - Ceará Noroeste Cearense 12.905.592 24.207.911 0,16 0,15 87,58 648,85 832,49 28,30 65,83
2302 - Ceará Norte Cearense 8.581.534 19.485.566 0,10 0,12 127,06 612,09 1065,54 74,08 66,07
2303 - Ceará Metropolitana de Fortaleza 88.699.370 184.130.656 1,08 1,14 107,59 822,59 1085,85 32,00 37,35
2304 - Ceará Sertões Cearenses 759.224 3.539.923 0,01 0,02 366,26 603,52 987,70 63,66 64,50
2305 - Ceará Jaguaribe 4.228.817 10.204.707 0,05 0,06 141,31 546,50 868,71 58,96 56,52
2306 - Ceará Centro-Sul Cearense 1.063.112 3.332.778 0,01 0,02 213,49 496,55 726,10 46,23 59,41
2307 - Ceará Sul Cearense 6.564.222 16.455.932 0,08 0,10 150,69 573,14 801,20 39,79 58,41
2401 - Rio Grande do Norte Oeste Potiguar 14.956.305 37.617.818 0,18 0,23 151,52 1387,54 2150,94 55,02 48,28
2402 - Rio Grande do Norte Central Potiguar 4.608.535 14.832.107 0,06 0,09 221,84 924,67 1446,75 56,46 48,18
2403 - Rio Grande do Norte Agreste Potiguar 951.526 2.325.666 0,01 0,01 144,41 460,79 756,07 64,08 61,81
2404 - Rio Grande do Norte Leste Potiguar 27.625.456 57.841.352 0,34 0,36 109,38 872,51 1254,07 43,73 37,16
2501 - Paraíba Sertão Paraibano 1.560.524 5.091.281 0,02 0,03 226,25 482,39 737,76 52,94 55,87
2502 - Paraíba Borborema 488.584 1.231.567 0,01 0,01 152,07 562,24 754,64 34,22 58,47
2503 - Paraíba Agreste Paraibano 10.063.028 27.119.625 0,12 0,17 169,50 660,13 954,58 44,60 53,36
2504 - Paraíba Mata Paraibana 21.414.715 47.349.265 0,26 0,29 121,11 800,46 1086,96 35,79 42,41
Growth rate of average wage (%) Poverty rate - below 60% of median household per capita income in 2010 (R$ 225) State Mesoregion Total Wages (monthly)
Wages distribution (%) Growth rate of wages (%) Average rage (R$ 2012)