CHALLENGES AND CONSTRAINTS
Stéphanie Horion1*, Bernard Tychon2 and Yves Cornet3Abstract
Many studies already investigated the impact of climate change and climate variability on vegetation at global and continental scales. Low resolution satellite imagery is one of the main sources of information. In this paper, we describe a strategy to improve the quality of 10-daily time series of Normalized Difference Vegetation Index derived from SPOT-VEGETATION. A specifi c methodology was also defi ned in order to identify optimal test sites for the analysis of climate control on intra-annual dynamic of croplands. Finally two cases studies are pre-sented to illustrate this research and in particular the non linear relationship between NDVI and meteorological parameters during the growing season.
Keywords
Vegetation dynamic, climate variability, low resolution imagery, geostatistics, time series analysis
Résumé
L’impact du changement climatique sur la végétation a déjà fait l’objet de nombreuses études à l’échelle continentale. L’imagerie satellitaire basse résolution est une importante source d’information pour ce genre d’étude. Cet article présente une méthodologie mise en place afi n de maximiser l’information extraite de séries temporelles de l’indice normalisé de végétation (synthèses de 10 jours) pour l’analyse de l’impact de la varia-bilité climatique sur les cultures. La sélection des sites d’étude a également fait l’objet d’une grande attention afi n de minimiser les facteurs perturbateurs du signal satellitaire autres que le climat. Pour terminer, deux cas d’étude seront présentés : le cas de la région d’Amhara en Ethiopie et celui de la Picardie en France.
Mots-clés
Dynamique de la végétation, variabilité climatique, image satellitaire basse résolution, géostatistique, analyse de séries temporelles
INTRODUCTION 1.
Many studies already investigated the impact of cli-mate change and clicli-mate variability on vegetation at global and continental scales. Using time series of re-mote sensing and climate data, Nemani et al. (2003) analysed trends in Net Primary Production in relation with changes in climate and showed that, between 1982 and 1999, primary productivity increased by 6% glo-bally in response to climate change. This study also stressed the need to take into account the spatial varia-bility of climatic constraints on plant growth when ana-lysing the climate change impact on vegetation. Others authors described different phenomena linked with cli-mate change, such as increases of seasonal Normalized Difference Vegetation Index amplitude and of growing season duration in the Northern high latitudes (Myneni
et al., 1998) or changes in circumpolar photosynthetic
activities (Bunn et al., 2005).
Understanding the interactions between climate and
vegetation is also a key issue in the PhD research of the main author (S. Horion) of this article. However, unlike other studies, we do not consider the vegetation glo-bally but we focus on two specifi c types of vegetation: croplands and grasslands. One of our main objectives is to identify the meteorological factors that limit the de-velopment of croplands and grasslands in relation with their geographical localisation.
Because they provide both spatial and temporal data in large amount, low resolution satellites are customarily used as primary source of information on vegetation status and on meteorological conditions. However their coarse spatial resolution is greatly limiting their poten-tial use. Indeed many vegetation types, land covers or natural processes can co-exist in a 1 km2 pixel.
In this paper, we describe our strategy to improve the quality of 10-daily time series of Normalized Difference Vegetation Index derived from SPOT-VEGETATION. A specifi c methodology was also defi ned in order to identify optimal test sites for our research. Finally two
(1) Institute for Environment and Sustainability, Joint Research Centre of the European Commission, Ispra, Italy (2) Département des Sciences et Gestion de l’Environnement, Université de Liège, Belgique
(3) Unité de Géomatique, Département de Géographie, Université de Liège, Belgique * Corresponding author. E-mail address: stephanie.horion@jrc.ec.europa.eu
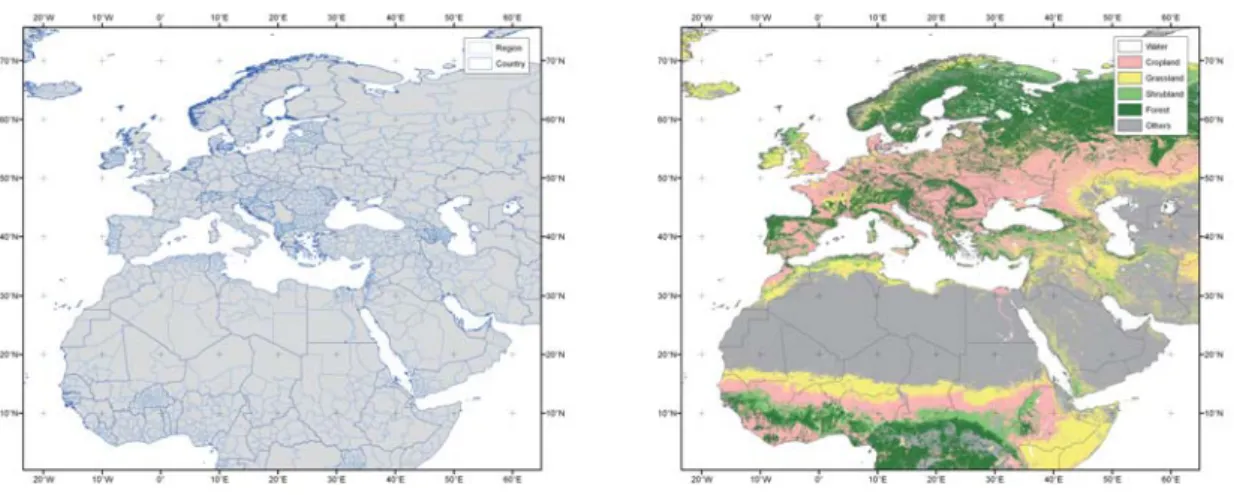
it for time series analysis, it went through a 3-steps pro-cedure during which pixel values were aggregated to administrative entities (fi g. 1a).
The fi rst step is the pre-processing of raw images, i.e. geometric and atmospheric corrections and the compu-tation of ten-days synthesis images, carried out by the Image Processing and Archiving Centre (CTIV, Mol) (Passot, 2000).
The next step is the computation of the NDVI regional unmixed statistics. Within a given region (fi g.1a), pixels covered totally by cropland are used for the calcula-tion of the regional NDVI mean and standard deviacalcula-tion (Eerens et al., 2004; Genovese et al., 2001) (fi g. 2). As reference for the land cover types, we used the Global Land Cover 2000 (Bartholomé et al., 2005; Mayaux et
al., 2006) generalized in 6 classes at the original 1 km2
resolution, GLC2000-6C (fi g. 1b). This aggregation step is really important as it allows us to focus on a cer-tain type of vegetation with a specifi c phenology. Finally the last processing step is the temporal smoo-thing of the time series. During this step residual noise due to mainly undetected cloud/snow is fi ltered out. cases studies are presented to illustrate the non linear
relationship between NDVI and meteorological para-meters during the growing season.
DATA 2.
Remote sensing Normalized Difference Vegeta-2.1.
tion Index
The Normalized Difference Vegetation Index (NDVI) is widely used as a proxy of the vegetation status and health. It has proven its effi ciency in many research fi elds such as the monitoring of land cover changes and land degradation (Lambin et al., 2001 ; Lambin, 2000), the crop growth monitoring and yield forecasting (Ba-laghi et al., 2008 ; Zhang et al., 2005), the study of vegetation phenology and its evolution over time (Whi-te et al., 2006 ; Verstrae(Whi-te et al., 2007), the in(Whi-teraction between climate and vegetation (Yu et al., 2003 ; Vogt
et al., 2000 ; White et al., 1997) and more specifi cally
the impact of climate change on vegetation (Nemani et
al., 2003 ; Zhou et al. 2001 ; White et al., 2005 ; Bunn et al., 2005 ; Myneni et al., 1998).
The NDVI is derived from the red and the near infrared bands following the equation:
NDVI = (NIR - RED) (eq. 1) (RED + NIR)
Where NIR and RED are the amount of near infrared and red light refl ected by the spectral object and recor-ded by the sensor (here: VEGETATION 1 and 2 sen-sors). This index ranges from -1 to +1 and relies on the absorption in the red part of the light spectrum due to the chlorophyll contained in the leaves, and on the scat-tering of the NIR by the mesophyll cells of the leaves. The more green and turgescent are the leaves, the closer to 1 is the NDVI. A null value represents more or less the threshold between the presence and the absence of vegetation.
For our research, ten years of 10-daily SPOT-VEGE-TATION NDVI were acquired from April 1998 till May 2008 for the entire globe. The original image data set has a spatial resolution of 1 km². However, before using
Figure 1. (left) Administrative layer: countries and regions, (right) Global Land Cover 2000, with legend simplifi ed to 6 classes.
Figure 2. Regional unmixed mean. In dark green, pixels con-sidered to calculate the regional statistics.
Global meteorological data set 2.2.
The global meteorological dataset used in this study has been acquired freely through the FOODSEC por-tal of the Joint Research Centre (http://cidporpor-tal.jrc. ec.europa.eu/home/idp/thematic-portals/foodsec-im-ageserver/). Out of the twelve indicators available, six
potential evapotranspiration. It corresponds to a proxy of the climatic water balance. Time series are composed by 10-daily global images at 0.5 degree resolution. They are derived from 2 different sources, (1) the ERA40 re-analyses (Uppala et al., 2005) for the period starting in January 1990 till August 2002 and (2) the operational
tember 2002 till May 2008. Regional statistics of the 7 meteorological indicators were also extracted per admin-istrative region following a similar procedure than for the NDVI images, i.e. they were calculated using strictly the values of grid cells covered totally by agricultural areas in the GLC2000-6C (fi g. 1b).
Table 1. 10-daily meteorological indicators.
Indicator Unit Abbreviation
Minimum temperature Maximum temperature Mean temperature Cumulated precipitation
Cumulated potential evapotranspiration Cumulated global radiation
Climatic water balance
°C °C °C mm mm KJ/m2*day mm Tmin Tmax Tmean Rain ET0 Rg P-ETP SITE SELECTION 3.
Optimal test sites for the modelling of vegetation-cli-mate interactions using the NDVI should ideally cor-respond to regions where the major part of the signal variation can be attributed to the climate and not to other phenomena such as land cover changes. For this reason our set of study cases has been established using a group of criteria which describe the spatial and tem-poral heterogeneities of the land covers and of the si-gnal retrieved by the sensor (Horion et al., 2007). The criteria and their implementation strategies are defi ned hereafter.
Spatial heterogeneity of land covers 3.1.
The spatial heterogeneity introduced by the occurrence of different land covers in a region is evaluated with 2 different indices, the Relative Area and the Frag-mentation index, both extracted from the generalized GLC2000-6C. The relative area is calculated for each land cover class existing in the administrative regions and gives information on the relative importance of land covers within the region. This indicator is important to assess the reliability of the regional NDVI statistics. In-deed the unmixing process used for the extraction of these statistics already improves the quality of the da-taset by considering only pixels completely covered by croplands. But the regional statistics might nevertheless not be reliable or representative of the regional vegeta-tion state if they are derived from too few pixels. The Fragmentation index refers to the spatial pattern in the surroundings of a pixel (3x3 window) (Eq. 2). The overall fragmentation of a region is evaluated by
averaging the Fr values of each pixel contained in that region.
Fr = (cr - 1) (eq. 2)
(nr - 1)
Where cr is the number of different classes observed in a 3x3 window and nr is the number of cells in the kernel (always 9 cells in this case).
Temporal heterogeneity of land covers (or land 3.2.
cover changes)
MODIS Land Cover products, MODIS LC, have been acquired in order to evaluate the error introduced by the use of a static land-cover map such as the GLC2000. These products are computed annually at a 1-km² re-solution (Friedl et al., 2002). The temporal trajectory of each pixel evaluated with MODIS LC for the period 2001-2004 is analyzed in order to identify land cover changes. Aberrant behaviours are identifi ed using sim-ple logical rules and such pixels are excluded from the land cover change analysis. A temporal trajectory is considered as aberrant or incoherent if one of the fol-lowing rules is not respected: (1) a maximum of two land cover changes is acceptable in the temporal trajec-tory of the pixel; (2) the ‘Shrublands’ class is the only accepted phase prior to ‘Forest’; (3) pixels with a tem-poral trajectory oscillating between water and another class are removed.
Spatial heterogeneity of the signal recorded by 3.3.
the sensor
The Coeffi cient of Variation CV measures the relative dispersion of a variable (Eq. 3). It is used here to
esti-mate how much the spectral signature of croplands is varying inside a same region.
d
CVr = 1 Σ ( Stdr ) (eq. 3)
di=1 Meanr
Where Stdr andMeanr are the standard deviation and average values calculated using the NDVI values of pixels covered by cropland and pertaining to region r.
d is the 10-daily period (decade). The fi nal CVr
corres-ponds to the average of all 10-daily CVr,d.
RESULTS AND DISCUSSION 4.
Optimal test sites for croplands 4.1.
The analysis of the indicators presented in the previous section allowed us to identify candidate regions for our research. Figure 3a presents the relative area (RA) of cro-pland for our area of interest which comprises Europe and the part of Africa situated in the Northern Hemisphere. In Europe, regions mostly dominated by croplands (RA > 60%) are quite numerous and spread over the entire area, notably in northern France, in Germany, in Poland, in Ukraine and in Spain. By contrast, in Africa, they are more concentrated on the Sahelian belt.
Like the relative area, the annual Fragmentation index per region Fr is also a good indicator of the spatial he-terogeneity caused by mixed land covers. Most regions in our area of interest present a very low level of frag-mentation, with Fr equal or below 0.125, meaning that in the 3x3 kernel (9 km2) only two different land covers
are observed in average (fi g. 3b).
The temporal trajectories of the MODIS LC images from 2001 to 2004 have been analyzed to identify in-coherencies and to locate the pixels where land cover changes occurred from 2001 to 2004. The identifi cation of stable regions is crucial as we are working on the response of vegetation to climatic events. Using regions with a high land cover change dynamic or incoherent changes would affect our analysis by introducing ex-tra-variability in the vegetation response retrieved from the sensor. Croplands are probably the most stable land cover in Europe, followed by the forest (fi g.3c). The agricultural regions of France (Nord Pas-de-Calais, Pi-cardie, Ile de France, etc) have recorded few land cover changes as well as the Pô region, the Garonne plain and Ukraine. On the contrary, regions with prevailing cro-pland stability are almost absent in Africa. Indeed land cover changes are important especially in the cropland and shrubland areas. Very few African regions can be
Figure 3. (top left) Relative Area of cropland derived from GLC2000, (top right) Spatial fragmentation of land covers, (bottom left) Land cover changes between 2001 and 2004, (bottom right) Coeffi cient of variation of NDVI for cropland (in grey, no data).
Figure 4. (left) Region of Amhara, Ethiopia; (right) Region of Picardie, France. selected as potential agricultural regions for our study.
The coeffi cient of variation is globally low (CV < 0.2), except in some areas in the Middle East and in Egypt (fi g.3d). This suggests that the signal recorded at the sensor for the pixels covered by croplands can be consi-dered homogeneous at the region scale.
Two cases studies 4.2.
After evaluation of the preceding results, 15 regions were selected as test cases for our research, 10 in Europe and 5 in Africa. In this section we present two test cases, one in Ethiopia (fi g.4a) and one in France (fi g.4b).
The fi rst case study corresponds to the region of Amhara in the Northern highlands of Ethiopia. Its size is about 165,000 km2, of which more than 70 % are covered by
cropland. The Coeffi cient of Variation of NDVI for cro-pland and the land cover fragmentation are both quite small (CVr = 0.22; Fr = 0.01). However the percentage of stable cropland is rather low (about 11 %) and in-coherent changes recorded between 2001 and 2004 by the MODIS Land Covers are important (12 %). Figure 5 (left) shows the typical landscape of Amhara. The agricultural fi elds are quite small (between 50 and 100 m in length) and mainly located on the plateau areas.
These observations and the importance of the relief in this area can explain the relatively high score for inco-herent changes.
The second case corresponds to the region of Picar-die in northern France. Its size is about 20,000km2, of
which more than 85 % are covered by stable croplands. The medium fi eld size, much bigger than in Amhara, is about 500x100 m (fi g.5b). Incoherent changes are negligible (< 2 % of the total area) and CVr is also re-ally low (~0.11), which indicates that the NDVI values recorded for all VEGETATION pixels covered by crop-land in the region are similar.
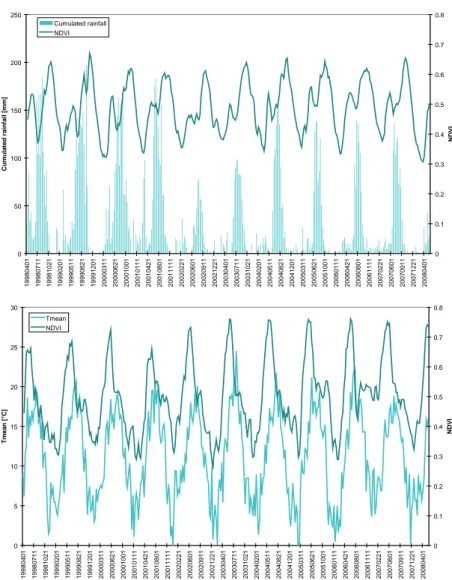
Figure 6 presents the 10-daily evolution of NDVI for the two case studies in parallel with the 10-daily evol-ution of a limiting meteorological factor: 10-daily cu-mulated rainfall in the case of Amhara and mean tem-perature in the case of Picardie. The seasonality linked to the growing cycle of plants is obvious in both cases. In Ethiopia, a double crop cycle can be observed: from April to May-June (Bleg season) and from July to Octo-ber (Meher season). In Picardie, the NDVI green-up is generally observed in March and the end of the growing season in October. The identifi cation of a double crop season is less clear even though a small increase of the NDVI is often observed in August-September.
A good correlation between the NDVI cycle and the limiting meteorological parameter is also recorded in both regions. In Amhara, the rainfall increase precedes that of NDVI while in Picardie, cycles of NDVI and mean temperature are shifted in the opposite way. Scat-terplots between NDVI and the limiting meteorological parameter show also interesting results regarding the type of relation between both variables (fi g. 7a and 7b). We see clearly that fi tting a linear regression line on the cloud of points is not a good solution. This de-monstrates that a meteorological factor does not have the same impact on the NDVI evolution throughout the year and even through the growing season. In order to fi nd statistically signifi cant linear relation which is also meaningful from an agro-meteorological point of view, we need to split the growing season into separate (phe-nological) phases. For example, in the case of Picardie, a good linear relation can be found between March and June (R² = 0.65), which corresponds respectively to the greening phase and to the beginning of the maturing process for winter crops (USGS crop calendar, http://
www.usda.gov/oce/weather/CropCalendars/index.htm, consulted in December 2009).
Following those preliminary results, a detailed investi-gation of interrelations between meteorological events and the vegetation response is currently undergone with specifi c focuses on (1) identifying key phenological stages within the growing season, (2) considering the cumulated impact of meteorological events (e.g. rain-fall defi cit during several decades, heat wave, etc) and (3) considering the possibility of a delayed response of vegetation.
CONCLUSION AND PERSPECTIVES 5.
We have presented here some results of the PhD re-search of S. Horion concerning the impact of climate on croplands using two low resolution global datasets, respectively 10-daily NDVI estimated for cropland and 10-daily meteorological parameters combining ERA-40 and ECMWF data (table 1).
A specifi c strategy was set up to improve these
data-0 50 100 150 200 250 19980401 19980711 19981021 19990201 19990511 19990821 19991201 20000311 20000621 20001001 20010111 20010421 20010801 20011111 20020221 20020601 20020911 20021221 20030401 20030711 20031021 20040201 20040511 20040821 20041201 20050311 20050621 20051001 20060111 20060421 20060801 20061111 20070221 20070601 20070911 20071221 20080401 Cumulated rainfall [mm] 0 0.1 0.2 0.3 0.4 0.5 0.6 0.7 0.8 NDVI Cumulated rainfall NDVI 0 5 10 15 20 25 30 19980401 19980711 19981021 19990201 19990511 19990821 19991201 20000311 20000621 20001001 20010111 20010421 20010801 20011111 20020221 20020601 20020911 20021221 20030401 20030711 20031021 20040201 20040511 20040821 20041201 20050311 20050621 20051001 20060111 20060421 20060801 20061111 20070221 20070601 20070911 20071221 20080401 Tmean [°C] 0 0.1 0.2 0.3 0.4 0.5 0.6 0.7 0.8 NDVI Tmean NDVI
Figure 6. daily evolution of NDVI for cropland compared (top) with evolution of 10-daily cumulated rainfall in Amhara (Ethiopia) and (bottom) with evolution of 10-10-daily mean temperature in Picardie (France).
sets and to focus only on agricultural areas. The Global Land Cover 2000 was used to identify VEGETATION pixels completely covered by cropland. These pixels were then used to compute regional statistics of NDVI and meteorological parameters.
The next step was the selection of optimal test cases for the analysis of climate control on croplands. Ideally, NDVI seasonal signal of such regions should be main-ly infl uenced by the variation of meteorological para-meters. Therefore regions with high fragmentation in landscapes, high land cover change dynamics and high spatial variation of NDVI with respect to the mean si-gnal were excluded. The fi nal choice was based on the percentage of stable cropland cover.
Further work will be dedicated to the analysis of cross-correlations between the monthly NDVI and the 7 meteorological parameters. As the two case studies showed, interactions between meteorological param-eters and NDVI can not be modelled using a simple linear regression over the year or the growing season. Indeed they need to be studied at a time scale smaller than the growing season in order to identify properly the limiting factors on plant growth. Like the limiting factors, which are variable from a region to another, the time scale for the analysis needs also to be adjusted for each region, taking into account the phenology of the vegetation under consideration. Moreover, we also considered in our analysis the possibility of a delayed response of the vegetation and/or a cumulated effect of meteorological events (up to 3 months).
Acknowledgments
The PhD research of S. Horion was founded by the F.R.I.A (Fonds pour la formation à la Recherche dans l’Industrie et dans l’Agriculture). We would like also to thank the Agriculture Unit (European Commission, Joint Research Centre) and Herman Eerens (VITO) for
providing us with regional unmixed statistics of SPOT-VEGETATION NDVI.
References
Balaghi, R., Tychon, B., Eerens, H. and Jlibene, M., 2008. Empirical regression models using NDVI, rainfall and temperature data for the early prediction of wheat grain yields in Morocco. International Journal of Applied Earth Observation and Geoinformation, 10(4), 438-452.
Bartholomé, E. and Belward, A., 2005. GLC2000: a new approach to global land cover mapping from Earth observation data. International Journal of Remote Sensing, 26(9), 1959-1977.
Bunn, A. G., Goetz, S. J. and Fiske, G. J., 2005. Observed and predicted responses of plant growth to climate across Canada. Geophysical Research Letters, 32, L16710.
Eerens, H., Piccard, I., Royer, A. and Orlandi, S., 2004. Methodology of the MARS Crop Yield Forecasting System (Vol.3). Remote sensing information, data processing and analysis. Eds. Royer, A. and Genovese, G. European Commission, DGJRC. EU 21291/EN3. 53-56.
Friedl, M.A., McIver, D.K., Hodges, J.C.F., Zhang, X.Y., Muchoney, D. Strahler, A.H., Woodcock, C.E., Gopal, S., Schneider, A., Cooper, A., Baccini, A., Gao, F. and Schaaf, C., 2002. Global land cover mapping from MODIS: algorithms and early results. Remote Sensing of Environment, 83(1-2), 287-302.
Genovese, G., Vignolles, C., Nègre, T. and Passera, G., 2001. A methodology for a combined use of normalised difference vegetation index and CORINE land cover data fro crop yield monitoring and forecasting. A case study on Spain. Agronomie, 21, 91-111.
Horion, S., Eerens, H., Tychon, B. and Cornet, Y., 2007. Spatial aggregation of low resolution satellite data for the monitoring of vegetation response to climatic stresses: Analysis of the spatial heterogeneity of aggregated entities. European Space Agency, (Special Publication) ESA SP-636, July 2007, 6p.
Lambin, E., 2000. Land Cover Assessment and Monitoring. in Wiley J.:Encyclopedia of Analytical Chemistry. Eds. R.A. Meyers, John Wiley and Sons Ltd, Chichester, 22p.
Lambin, E.F., Turner, II B.L., Geist, H., Agbola, S., Angelsen, A., Bruce, J.W., Coomes, O., Dirzo, R., Fischer, G., Folke, C., George, P.S., Homewood, K., Imbernon, J., Leemans, R., Li, X., Moran, E.F.,
200 150 100 50 0 Crain (mm) 0.7 0.6 0.5 0.4 0.3 0.2 NDVI 25 20 15 10 5 0 -5 Tmean 0.7 0.6 0.5 0.4 0.3 0.2 NDVI 12 11 10 9 8 7 6 5 4 3
Figure 7. Scatterplots between 10-daily NDVI and a limiting meteorological parameter: (left) 10-daily cumulated rainfall in Amhara (Ethiopia), (right) mean temperature in Picardie (France).
Mortimore, M., Ramakrishnan, P.S., Richards, J.F., Skånes, H., Steffen, W., Stone, G.D., Svedin, U., Veldkamp, T., Vogel, C. and Xu, J., 2001. The Causes of Land-Use and Land-Cover Change: Moving beyond the Myths. Global Environmental Change, 11, 261-269.
Mayaux, P., Strahler, A., Eva, H., Herold, M., Shefali, A., Naumov, S., Dorado, A., Di Bella, C., Johansson, D., Ordoyne, C., Kopin, I., Boschetti, L. and Belward, A., 2006. Validation of the Global Land Cover 2000 Map. IEEETrans. on Geoscience and Remote Sensing, 44(7), 1728-1739.
Myneni, R.B., Tucker, C.J., Asrar, G. and Keeling, C.D., 1998. Interannual variations in satellite-sensed vegetation index data from 1981 to 1991. Journal of Geophysical Research, 103, 6145-6160.
Nemani, R.R., Keeling, C.D., Hashimoto, H., Jolly, W.M., Piper ,S.C., Tucker, C.J., Myneni, R.B. and Running, S.W., 2003. Climate-driven increases in global terrestrial net primary production from 1982 to 1999. Science, 300, 1560-1563.
Passot, X., 2000. VEGETATION image processing methods in the CTIV. In VEGETATION 2000: 2 years of operation to prepare the future. Ed. Saint G., Lake Maggiore, Italy, 15-21.
Uppala, S.M., Kallberg, P.W., Simmons, A.J., Andrae, U., Bechtold, V.D., Fiorino, M., Gibson, J.K., Haseler, J., Hernandez, A., Kelly, G.A., Li, X., Onogi, K., Saarinen, S., Sokka, N., Allan, R.P., Andersson, E., Arpe, K., Balmaseda, M.A., Beljaars, A.C.M., Van De Berg, L., Bidlot, J., Bormann, N., Caires, S., Chevallier, F., Dethof, A., Dragosavac, M., Fisher, M., Fuentes, M., Hagemann, S., Holm, E., Hoskins, B.J., Isaksen, L., Janssen, P.A.E.M., Jenne, R., McNally, A.P., Mahfouf, J.F., Morcrette, J.J., Rayner, N.A., Saunders, R.W., Simon, P., Sterl, A., Trenberth, K.E., Untch, A.,
Vasiljevic, D., Viterbo, P. and Woollen, J., 2005. The ERA-40 re-analysis. Quarterly Journal of the Royal Meteorological Society, 131, 2961-3012.
Verstraete, M.M., Gobron, N., Aussedat, O., Robustelli, M., Pinty, B., Widlowski, J.-L. and Taberner, M., 2007. An automatic procedure to identify key vegetation phenology events using the JRC-FAPAR products. Advances in Space Research, 41, 1773-1783.
Vogt, J.V., Niemeyer, S., Beaudin, I. and Viau, A., 2000. Drought Monitoring from Space. Advances in Natural and Technological Hazards Research, 14, 167-183. White, M.A. and Nemani, R.R., 2006. Real-time monitoring
and short-term forecasting of land surface phenology. Remote Sensing of Environment,104(1), 43-49. White, M.A., Hoffman, F., Hargrove, W.W. and Nemani,
R.R., 2005. A global framework for monitoring phenoligical responses to climate change. Geophysical Research Letters, 32, L04705.
White, M.A., Thornton, P.E. and Running, S.W., 1997. A continental phenology model for monitoring vegetation responses to interannual climatic variability. Global Biogeochemical Cycles, 11, 217- 234.
Yu, F., Price, K.P., Ellis, J. and Shi, P., 2003. Response of seasonal vegetation development to climatic variations in eastern central Asia. Remote Sensing of Environment, 87, 42-54.
Zhang, P., Anderson, B., Tan, B., Huang, D. and Myneni, R. B., 2005. Potential monitoring of crop production using a satellite-based Climate-Variability Impact Index. Agricultural and Forest Meteorology, 132, 344-358.
Zhou, L., Tucker, C.J., Kaufmann, R.K., Slayback, D., Shabanov, N.V. and Myneni, R.B., 2001. Variations in northern vegetation activity inferred from satellite data of vegetation index during 1981 to 1999. Journal of Geophysical Research, 106(D17), 20069-20083. ___________________________________________