Children’s perception of degraded speech at normal vs. fast speech rate
7
0
0
Texte intégral
(2) degraded (8). At the stage of signal transmission, background noise, such as babble -, classroom-, or cafeteria noise, is the major source of acoustic speech degradation faced by children (4). Moreover, a speaker’s voice impairment, also referred to as dysphonia, may lead to speech signal degradations (9). This latter form of degradation takes place at an earlier point in time, during the production of speech. Evidence indicates that listening to speech in noise or a dysphonic speaker may nega tively affect children’s performance and response latency in listening tasks, such as phoneme discrimination (910), word recognition (11), word recall (12-13), and sentence- or passage comprehension (14-18). This effect may be explained by the widely accepted theory that cognitive capacity is limited (8). When listening to acoustically degraded speech, more capacity may be allocated to the processing of irrelevant signal features, thus leaving fewer resources to process the relevant information (17). Little is known about the interaction of speech rate and listening condition on how children process speech. The aim of the present study was to determine children’s perception of normal and acoustically degraded speech at two different speech rates (normal versus fast). Performance and response times were measured in a speech perception task. In the light of the theory of processing capacity limitations, we hypothesized that acoustic degradations would impede children ’s speech perception performance and that this effect would be stronger for fast speech rate. Moreover, we expected children to require longer response times to process degraded speech at fast speed than at normal speed.. 2. METHODS 2.1 Participants The study sample consisted of 53 children, aged five to six years old (M = 6;4, SD = 0;3), who complied with the following inclusion criteria: 1. first-grade primary school student, 2. French native speaker, 3. hearing threshold ≤ 25 dBA for octave frequencies between 500 and 4000 Hz, 4. no history of auditory impairments or speech-language disorders, 5. normal or above normal receptive lexical skills (subtest LexR of the Épreuve du Langage Orale (ELO) [Oral Language Assessment] (19), and 6. normal or above normal selective attention skills (subtest Attention et Fonctions Executives [Attention and Executive Functions] of the Bilan NEuroPSychologique de L’Enfant 2 (NEPSYII) [Developmental NEuroPSYchological Assessment] (20-21). Children were recruited from five randomly selected primary schools in the French-speaking part of Belgium. 2.2 Speech Perception Task A digitalized version of the Épreuve Lilloise de Discrimination Phonologique (ELDP) (22) was used for this study. The ELDP is a two-alternative forced-choice (2AFC) speech perception task that assesses children’s ability to discriminate between similar sounding pseudo-words. It contains two lists of 36 French pseudo-word pairs. The first list is presented at normal speech rate; the speed reference was provided by another listening task designed for 4-8 year old children, the EDP 4-8 (23). The second list is presented at fast speech rate; those items were recorded ~30 % faster than normal speed items (22). Pseudo-word pairs consist of either two identical items (e.g. /zil/ - /zil/) or two slightly different items (e.g. /zil/ – /zij/), with a length of up to three syllables. Children are instructed to listen to the pseudo-word pairs and decide, whether items were identical or different. 2.3 Listening Conditions For the purpose of our experiment, we newly recorded the two ELDP pseudo-word lists with a head-mounted condenser microphone (AKG C 544 L), and digitalized them at 44.1 -kHz sampling frequency with a 16-bit resolution. A female voice expert read the list at normal speech rate and the list at fast speech rate in her normal voice and while imitating a dysphonic voice. These voice samples are freely available online (24). Acoustic and perceptual evaluations of the voice qualities confirmed the absence of a voice problem for the normal voice, and a moderate to severe impairment for the dysphonic voice (25). The two voice qualities were merged with speech-shaped noise (Stipa signal, [26]) at 0 dB SNR. This resulted in four listening conditions: • C1 = normal voice in silence (control) • C2 = dysphonic voice in silence • C3 = normal voice in speech-shaped noise at 0 dB SNR • C4 = dysphonic voice in speech-shaped noise at 0 dB SNR. 5962.
(3) Irrespective of speech rate, the two pseudo-words of a pair were separated by a pause of 0.5 seconds. In speech-in-noise conditions (i.e. C3 and C4), this pause was filled with SSN as shown in Figure 1. Figure 1 also provides time-related information for normal speed and fast speed items.. Figure 1: Exemplary illustration of a speech-in-noise item consisting of a pair of pseudo-words. The upper part of the figure shows oscillograms of the noise signal and the speech signals. The lower part of the figure reports average pseudo-word duration and item duration as a function of speech rate. 2.4 Procedure Children were individually tested in a quiet room at school. The speech perception task was presented with a touch-screen laptop (Dell Latitude 5480) using Open Sesame software (27). Speech stimuli were played back via headphones (AKG K 271 MK II) at comfortable hearing level. After each pseudo-word pair, two response images appeared on the screen, allowing the child to indicate (via touch response) whether the stimuli were identical or different. Each subsequent item was manually initiated by the experimenter after ensuring that the child was still attentive. In a withinsubjects design, each participant listened to eighteen pseudo -word pairs per listening condition (i.e. C1-C4), counterbalanced by means of an algorithm provided by Open Sesame (27). This means that listening conditions varied randomly across items. The first 36 trials were presented at normal speed, the second 36 trials were presented at fast speed. Outcome variables were task performance (i.e. probability of correct vs. incorrect responses) and response times of correct trials (i.e. time elapsed from stimulus offset to touch response). Response time was measured to indirectly evaluate ch ildren’s listening effort related to processing degraded speech at normal and fast speed. Data were analyzed by means of generalized linear mixed-effects models (GLMM) with a binomial family and logit link function, using R software version 3.3.2 (28).. 3. RESULTS 3.1 Task Performance A GLMM with the fixed effects noise and voice quality revealed a highly significant effect of listening condition on task performance (χ 2 (3) = 177.16, p ≤ .001). However, the performance difference regarding normal versus fast speed (i.e. M = .77, SD = .066 versus M = .74, SD = .072) was not significant (χ 2 (1) = .312, p = .756), nor was there an interaction between speech rate and listening condition (χ 2(3) = 5.7613, p = .124). Figure 2 presents the mean probability of correct responses with respect to listening condition and speech rate. For normal speed, task performance gradually declined. 5963.
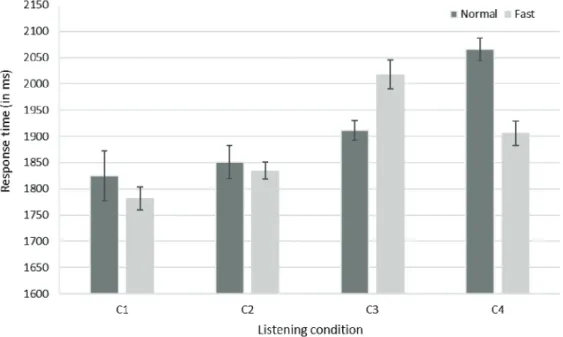
(4) from C1 (M = .89, SD = .025) to C2 (M = .82, SD = .037), C3 (M = .72, SD = .05), and C4 (M = .61, SD = .057). The GLMM followed by a Tukey HSD post-hoc test, adjusted for multiple comparisons, confirmed that each listening condition at normal speed significantly differed from the others (pvalues ≤ .01). For fast speed, we found a similar decline in task performance from C1 (M =.88, SD = .027) to C2 (M = .76, SD = .044), C3 (M = .64, SD = .056), and C4 (M = .63, SD = .056). Tukey HSD testing confirmed that C1, C2, and C3 were significantly different from one another, and C4 was significantly different from the C1 and C2 (p-values ≤ .01). There was no significant difference between C3 and C4 (z = -.103, p = .92).. Figure 2: Estimated probability of correct responses as a function of listening condition and speed. Listening conditions align on the x-axis: normal voice and no noise (C1), dysphonic voice and no noise (C2), normal voice and SSN (C3), and dysphonic voice and SSN (C4). Error bars represent SD.. 3.2 Response Time Regarding response time, a GLMM revealed a significant interaction between speech rate and listening condition (χ 2(3) = 216.680, p < .001). Tukey HSD post hoc testing, adjusted for multiple comparisons, showed response time differences between fast and normal speed were significant for C3 (z = 3.14, p = .036) and C4 (z = 10.43, p < .001), but not C1 (z = -1.52, p = .8) or C2 (z = -.49, p = 1.0). The interaction is observable in Figure 3, which presents mean response times as a function of listening condition and speech rate. Response times for C3 (i.e. normal voice in noise) were on average 107 ms longer at fast versus normal speed (i.e. M = 2018 ms, SD = 19 versus M = 1911 ms, SD = 28). This pattern was reversed for C4 (i.e. the combination of noise and dysphonic voice), where response times were on average 160 ms shorter at fast versus normal speed (M = 1906 ms, SD = 23 versus M = 2066 ms, SD = 21). Overall, Figure 3 highlights the increase in response times under conditions of degraded listening (i.e. C2-C4) as compared to the control condition (C1).. 5964.
(5) Figure 3: Estimated response times (in ms) as a function of listening condition and speed. Listening conditions align on the x-axis: normal voice and no noise (1), dysphonic voice and no noise (2), normal voice and SSN (3), and dysphonic voice and SSN (4). Error bars represent SD.. 4. DISCUSSION This study examined how speech rate and acoustic signal degradations may influence children ’s performance and response times in a speech perception task. Children performed worse and r esponded slower when noise or speaker’s impaired voice interfered with the speech signal. There was a trend for a negative impact of fast speech rate on children’s perception of degraded speech. Surprisingly, a significant interaction between listening condition and speech rate revealed that children took more time to respond to speech-in-noise when listening to the normal voice compared to the dysphonic voice. These findings are discussed in more detail below. The observed decline in children’s answer accuracy under conditions of acoustically degraded speech confirms our hypothesis that acoustic degradations would impede children’s speech perception performance and supports results from past research (9-11, 13-16). When listening to speech in noise at 0 dB SNR, children made significantly more processing errors, especially when the speaker ’s voice was degraded. It seems likely that noise and dysphonic voice may also compromise children ’s speech perception in real-life situations. If signal degradations hamper the correct analysis of critical phonemes, higher-level listening comprehension might also be affected. Future experiments with a under more realistic conditions are needed to confirm this notion. In line with ELDP reference data (22), children tended to perform better at normal versus fast speech rate. However, there was no interaction between speech rate and listening condition with respect to task performance. This surprised us as we expected fast speech rate to pose an additional challenge for speech perception in already difficult listening conditions. One possibility is that the speed difference between normal and fast speech rate (i.e. 30 %) was too small to yield an effect. Recall also that pseudo-word pairs were presented in isolation with unlimited response time and short interruptions between items. With regard to listening effort and processing costs, this paradigm is less challenging than paradigms in which longer speech segments are presented or response time restrictions are applied. Beyond that, we cannot be certain whether the children’s perception of the two speech rates is actually in agreement with the intended speech rates (i.e. normal and fast). This uncertainty is worth investigating in a future perceptual experiment. Results did not confirm our hypothesis that children would be slower at processing acoustically degraded speech at fast speed than at normal speed. What we found was that children required more time to process speech presented in noise and/or dysphonic voice , which supports the findings of past. 5965.
(6) studies (16, 18). Results also revealed an interaction between listening condition and speech rate, but this interaction was difficult to interpret. At normal speed, response latencies were longest for dysphonic voice in SSN. At fast speed, however, response latencies were longest for normal voice in SSN – a condition we assumed to be less effortful. Methodological issues might help explain this finding. Recall that the task implied a 2AFC design with encouraged guessing. If our assumption was true, and dysphonic voice in SSN at fast speed was indeed most difficult to process, more children might have fallen back on a guessing strategy, resulting in a performance of ~50 % correct. In this case, a high proportion of quick but random correct trials would have fed into the response time analysis of this condition. A closer investigation of this speculation was beyond the sc ope of this paper. Taken together, our results indicated that first-grade primary school children were negatively affected by acoustic degradations when processing speech. The effect of speech rate on the processing of degraded speech remains inconclusive. To this respect, future studies could benefit from methodological adaptations, such as (1) increasing the speed difference between normal and fast speech rate, (2) collecting subjective data on the perception of experimentally set speech rate s (3) imposing response time restrictions to increase working memory load, or (4) using a task with longer speech segments, such as sentences or passages.. 5. CONCLUSION Speech-shaped noise and a speaker’s dysphonic voice may interfere with speech perception in children. A combination of noise and dysphonic voice may be especially detrimental. The present study does not allow a clear conclusion regarding the effect of speech rate on children ’s perception of degraded speech, although there was a tendency for fast speech resu lting in more speech processing errors than a normal speech rate. Future research is necessary to explore the interaction between speech rate and listening condition with regard to response times. Our results may be relevant for various kinds of listening situations in which children listen and learn, because impeded speech perception may potentially affect higher level listening comprehension. They highlight the importance of monitoring and improving quality and transmission of the speech signal directed towar ds young listeners. Providing voice training to the speaker may enhance the signal quality, while acoustic room adjustments that reduce background noise may allow better signal transmission.. REFERENCES 1. Elliott LL. Performance of children aged 9 to 17 years on a test of speech intelligibility in noise using sentence material with controlled word predictability. J Acoust Soc Am. 1979;66(3):651-653. 2. Huyck JJ. Comprehension of degraded speech matures during adolescence. J Speech Lang Hear Res. 2018;61(4):1012-1022. 3. Bradley JS, Sato H. Speech recognition by grades 1, 3, and 6 children in classrooms. Can Acoust. 2004;32(3):26-27. 4. Shield B, Dockrell J. The effect of noise on children at school: A review. Build Acoust. 2003;10(2):97106. 5. Haake M, Hansson K, Gulz A, Schötz S, Sahlén B. The slower the better? Does the speaker’s speech rate influence children’s performance on a language comprehension test? Int J Speech Lang Pathol. 2014;16(2):181-190. 6. Hayiou-Thomas ME, Plunkett K. Simulating SLI : General cognitive processing stressors can produce a specific linguistic profile. J Speech Lang Hear Res. 2004;47:1347-1362. 7. Montgomery JW. Effects of input rate and age on the real-time language processing of children with specific language impairment. Int J Lang Commun Disord. 2005;39(1):115-133. 8. Wingfield A. Evolution of models of working memory and cognitive resources. Ear Hear. 2016;37:35S43S. 9. Morsomme D, Minell L, Verduyckt I. Impact of teachers’ voice quality on children’s language processing skills. VOCOL: Stem En Stemstoorn. 2011;9-15. 10. Nishi K, Lewis DE, Hoover BM, Choi S, Stelmachowicz PG. Children’s recognition of American English consonants in noise. J Acoust Soc Am. 2010;127(5):3177-3188. 11. Fallon M, Trehub SE, Schneider BA. Children’s perception of speech in multitalker babble. J Acoust Soc Am. 2000;108(6):3023-3029. 12. Hurtig A, Van de Poll MK, Pekkola EP, Hygge S, Ljung R, Sörqvist P. Children’s recall of words spoken in their first and second language: Effects of signal-to-noise ratio and reverberation time. Front Psychol.. 5966.
(7) 2016;6:2029. 13. Morton V, Watson DR. The impact of impaired vocal quality on children’s ability to process spoken language. Logoped Phoniatr Vocol. 2001;26(1):17-25. 14. Klatte M, Lachmann T, Meis M. Effects of noise and reverberation on speech perception and listening comprehension of children and adults in a classroom-like setting. Noise Health. 2010;12(49):270-282. 15. Rogerson J, Dodd B. Is there an effect of dysphonic teachers’ voices on children’s processing of spoken language? J Voice. 2005;19(1):47-60. 16. Visentin C, Prodi N. A matrixed speech-in-noise test to discriminate favorable listening conditions by means of intelligibility and response time results. J Speech Lang Hear Res. 2018;61(6):1497-1516. 17. Lyberg-Åhlander V, Haake M, Brännström J, Schötz S, Sahlén B. Does the speaker’s voice quality influence children’s performance on a language comprehension test? Int J Speech Lang Pathol. 2015;17(1):63-73. 18. Sahlén B, Haake M, von Lochow H., Holm L, Kastberg T, Brännström KJ, et al. Is children’s listening effort in background noise influenced by the speaker’s voice quality? Logoped Phoniatr Vocol. 2017;43(2):47–55. 19. Khomsi A. ELO: Évaluation du Langage Orale [language test]. ECPA Pearson; 2001. 20. Korkman M, Kirk U, Kemp SL. NEPSY II. Administrative manual. San Antonio, TX: Psychological Corporation; 2007a. 21. Korkman M, Kirk U, Kemp SL. NEPSY II. Clinical and interpretative manual. San Antonio, TX: Psychological Corporation; 2007b. 22. Macchi L, Descours C, Girard É, Guitton É, Morel C, Timmermans N, et al. ELDP: Épreuve Lilloise de Discrimination Phonologique [ELDP1 protocol & manual]. 2018 [cited 2019 May 1]. Available from: http://orthophonie.univ-lille2.fr/stocks/stock-contents/epreuve-lilloise-de-discriminationphonologique.html. 23. Autesserre D, Deltour JJ, Lacert P. (1988). EDP4-8: Épreuve de Discrimination Phonémique pour enfants de 4 à 8 ans. Issy-les-Moulineaux: Éditions et Applications Psychologiques; 1988. 24. Schiller I, Remacle A, Morsomme D. NODYS: NOrmophonic and DYsphonic Speech samples [database]. 2019 [cited 2019 May 1]. In: Mendeley data [internet]. Available from: http://dx.doi.org/10.17632/g2fmkw8t85.1 25. Schiller I, Remacle A, Morsomme D. Imitating dysphonic Voice: A suitable technique to create speech stimuli for spoken Language Processing Tasks? Submitted to Logoped Phoniatr Vocol. 2019; under review. 26. Houtgast T, Steeneken HJM, Ahnert W, Braida LD, Drullman R, Festen JM, et al. Past, present and future of the speech transmission index. Soesterberg: TNO Hum Factors; 2002. 27. Mathôt S, Schreij D, Theeuwes J. OpenSesame: An open-source, graphical experiment builder for the social sciences. Behav Res Methods. 2012;44(2):314-324. 28. R Core Team. R: A language and environment for statistical computing [Computer Software]. 2013 [cited 2019 May 1]. Available from: http://www.Rproject.org/.. 5967.
(8)
Figure


Documents relatifs
Initial results from an experiment with French listeners rating speech rates in French, German, and English show that, despite varying objective speech rates, listeners are well
Analysis of response times broken down into miniblocks of 5 sentences of the same rate reveals that whereas performance for normal sentences remains stable over time, response
• It is noteworthy that dyslexic adults present significant auditory non- words identification deficit in the control condition in which the speech signal is
None phonological codes are needed to the dyslexic group to accurately identify non-words so we hypothesis that dyslexics probably show an auditory deficit in
Such findings would help verify if lack of visual clues (if it is at all the reason for differences between blind and sighted people) has consequences on the temporal
Table 3: Regressions of human responses against native (French-DP for French listeners, English-DP for English lis- teners) versus non-native (switched) trained DPGMM
Experiment 1 revealed that infants exposed to AD speech did not show any sensitivity to either German or French visual stimuli in response to the auditory
Table 3 Shows the correlation results observed between the priming effect (according to attention: priming effect observed in the attended condition and the priming effect observed
