B.A., Gourcher College (1961)
H.S., University of Pennsylvania (1964)
Submitted in partial fulfillment of the requirements for the degree of
Master in City Planning
at the
MASSACHUSETTS INSTITUTE OF TECHNOLOGY
(September 1968) 1
)
Signature of author
Department'of City anajegional Planning, September
23, 1968*.
Certified by
Thesis Supei'visor
Accepted by
Chai
,Departmental Committee
on Graduate Students
Archives
'Oss. INiS.A
PR 3 1969
'Z/8RARIES by
M
ITLibraries
Document Services Ph: 617.253.2800 Email: [email protected] http://Iibraries.mit.edu/docsDISCLAIM ER
MISSING PAGE(S)Pages 71 & 75 have been ommitted due to a
pagination error by the author.
COMPARATIVE DEVELOPMENT: A QUANTITATIVE APPROACH Mary Christine Boyer
Submitted to the Department of City and Regional Planning on September 23, 1968 in partial fulfillment of the requirements for the degree of Master of City Planning.
This is a comparative study of ninetythree developing nations. Each country is measured on fortyfive economic, social, and political indicators and compared against one another to re-veal development types. The study uses a recently developed sta-tistical procedure called Cluster Analysis and thus becomes an inquiry into the abilities and usefulness of such techniques. A computer program named CLUSTER was programmed on the M.I.T.
C.T.S.S.
Chapter One is an introduction into developmental and comparative studies. Chapter Two defines the development indica-tors and offers a detailed discussion on each indicator. The Third Chapter examines the results of the cluster computations. Chapter Four presents a discussion of other cluster procedures and areas of applications and a description of the computer pro-gram CLUSTER and the statistical method upon which it is based.
Fleischer of the Department of City and Regional Planning for his criticism and helpful comments throughout the development of this thesis. The writer is also indebted to the services of The Computation Center, M.I.T.
TABLE OF CONTENTS: Abstract
Acknowledgements 11
Table of Contents iii
CHAPTER ONE:
1. Introduction 1.
2. Purpose of Comparative Study 2. 3. Goals of the Statistical Analysis 4. CHAPTER TWO: DEVELOPINT INDICATORS
1. The Sample 6.
2. The Scaling and Weighting Schemes 7.
3. The Indicators 7.
4. Detailed Description of the
development Indicators 9. CHAPTER TIEE: ANALYSIS OF THE RESULTS:
1. Stage One 32.
2. Stage Two 32.
3. Stage Three 50.
4. Stage Four 88.
5.
Comparative Levels of Development 97.6. Summary of the Analysis 104.
CHAPTER FOUR: DISCUSSION OF THE STATISTICAL TECHNIQUE OF CLUSTER ANALYSIS
1. Classification Schemes 106.
2. Relationship of this method to other
Statistical Procedures 107.
3. Areas of Application 109. 4. Review of Types of Cluster Analysis
A. Cluster Schemes 111.
B. Definitions of Similarity Coefficients 112. C. Definitions of Cluster Formation 115.
5. The Method:
A. The Statistical Model 118.
B. Practical Considerations 123.
C. The Program 125.
D. General Flowcharts 134.
CHAPTER FIVE: FOOTNOTES AND BIBLIOGRAPHY
1. References for Chapter one. 142. 2. References for Chapter Two. 144. 3. References for Chapter Four. 145.
PAGE 135
Third Line: 'general types' should read tphenomenal types'
Page 136
Fifth Line: "general type" should read 'phenomenal type'
1. TNTRODUCTION:
It is well understood that the delemma of the underdeveloped countries is a complex and highly interrelated process of social, poli-tical and economic change. Such complexity requires multivariate analy-sis while clarity of the interrelations calls for simplification. This study seeks to define the ambiguous term development and to offer some means of conceptualization by identifying quantifiable measurements which define development levels. Since the national level of economic, social
and political development offers too many variables and complex interrela-tionships to enable generlizations and hypothesis formation, a simplifica-tion and classificasimplifica-tion of development types is proposed. This study thus presents a numerical synthesis of the development indicators which organize the data into classifications for the sake of comparative analysis.
There are three stages to classification studies. The first stage is the impressionistic view of the classes to be studied.
Develop-(1.) ment types at this stage are ideal classifications such as Rostow's
five categories of economic growth which are holistic rather than empirical. The second stage to classification schemes is the development of typologies. This stage has two approaches, either to assign elements to predetermined pigeonholes or to permit the data to internally define the classes. The self-defining sclaes are usually of the one or two factor continuum scales
(2.)
such as Friedman's schema of traditional, transitional, industrial, and post-industrial socieites which are determined by the industrial share of the GNP. The third stage is that of hypotheses testing and formation of generalizations which are empirically verifiable. The stage that
con-a set of developing countries econ-ach of which hcon-as con-a list of development in-dicators upon which a statistical classification analysis will be based. The analysis will offer a typology which reveals significant contrasts
be-tween types, which implies membership with respect to patterns of vari-ables and which describes the varivari-ables in which the patterns differ.
2. PURPOSE OF COMPARATIVE CIASSIFICATION STUDY:
The development process, requiring structural changes within the developed nations, must be brought about through careful coordination of projects and programs which complement each other and promote the dev-elopment potential. The assumption basic to this change is that a cer-tain number of well chosen projects and plans will place the country on
(3.)
the path to development. It is contended by many development planners that the development process is not achieving these goals due to a lack of comparative analysis upon which the planner can rationally arrive at poli-cies and programs suitable to the context of the country. Moreover what is needed to spur the development process on is the ability to apply pro-grams and policies which have been successful in the developed countries to developing countries. Such rational decision-making depends upon the ability to determine what level of development a given country has achiev-ed, what path of development the country is currently charted for, and at what rate change is likely to occur so that policies and programs can be applied to those countries to which they are applicable. The purpose of this study is to deterndne development levels at a given point in time. It
historical studies would link the development levels or stages into con-nected paths.
The application of experimental projects requires that the sam-ple population of countries be controlled with respect to development le-vel presently obtained, inherent dele-velopment potential, and geographical and political type distribution. If development types and potentials were known, projects could then be selected for countries whose development en-vironment demonstrates a high probability that the projects would be suc-cessful. Projects could also be assigned to countries belonging to a populous development type so that if the project is successful it then could be transferred to other countries of the same type. Furthermore controlling the development environment would allow for comparative analy-sis of the impact of development on certain institutions and of the patterns of change which seem to occur along similar development paths.
In the search for a typology of development the concern is for a conceptual framework in which the planning process is carried out. What basic variables about a country's level of development, institutional and political environment describe the context of the planning environment?
(4.)
John Friedman has stated that there exists a "Style of National Planning in every society ... " and that this style effects the manner of decision making. (i.e. the social context of planning.) This study is consequent-ly motivated by the attempt to understand the economic, social and politi-cal conditions in which development planning must occur. There are those
each country what elements creatb the predisposition for or against the 'context of planning'. Success in development planning is not based on economic achievement alone but is determined as well by the receptivity to a pro-planning environment.
In the attempt to discover whether developing countries tend to cluster about specific points in the development continuum, several
devel-opment hypotheses can be tested. Lerner has stated that a ceftain per-centage of urbanization ( I0%+ of the population living in 'urban' areas2
has to be obtained before literacy rates begin to rise and that urbaniza-tion and literacy rise monotonically until 25% urbanizaurbaniza-tion has been reached. Although this question is not directly verifiable by the devel-opment patterns produced by cluster analysis the study can demonstrate the apparent patterns of urbanization and literacy at various development le-vels. Another area to question is the relationship between modernization and urbanization and whether urbanization is a prerequisite to moderniza-tion. Other patterns to account for in each development type are the relationships of fertility and mortality rates and education levels. It would also be of interest to determine whether development types can be defined regionally.
3. GOALS OF THE STATISTICAL ANALYSIS:
The purposes of this analysis are multifold. First an attempt is made to gain insight into the variables which are the basic determi-nants of development levels and which indicate the stage of development a
tural groupings. Natural in the sense that they are unaided by hypothe"-sized patterns which appear to the investigator to be typical of develop-ment. It is precisely the typicality question that the study seeks to answer; the determination of countries which are central to a given type. A development type consequently is a grouping of countries by certain
in-ternally determined patterns of development indicators. Third the inter-pretation of the cluster analysis of development indicators will reveal density of types through the demonstration of agglomeration or sparceness
of member countries and will define type typicality through the use of nucleus or cluster centers. Fourth the internal analysis of each type
should attempt to explain what pattern of variables is most significant for the formation of that type and what variables seem to have the least significance.
In the attempt to arrive at a quantitative measurement of deve-lopment fortyfive qualitative and quantitative indicators of economic, soc-ial, and political development were defined for ninetythree independent countries as of 1960. The statistical technique of cluster analysis was applied to the data in a search for the significant patterns of relation-ships among the indicators and for the consequent definition of develop-ment types.
THE SAMPLE:
The universe of analysis consists of the ninety-three indepen-dent countries as of 1960, excluding the Australasian, North American, Scandinavian and West European countries. The developed nations were ex-cluded in the effort to concentrate on the description of underdevelopment. The ninety-three countries included in the sample are listed below, names other than the official name used in the study are given in parentheses. Argentina Bolivia Brazil Chile Colombia Costa Rica Cuba Dominican Republic Ecuador El Salvador Gautemala Haita Honduras Jamaica Mexico Nicaragua Panama Paraguay Peru Uruaguay Venezuela Algeria Burundi Ferderal Republic of Cameroun (Cameroon) Central African Republic Republic of Chad (Chad) Congo(Brazzaville) Congo(Leopoldville) Dahomey Ethiopia Republic of Gabon (Gabon) Ghana Republic of Guinea (Guinea) Republic of Ivory Coast (Ivory Coast) Republic of Kenya (Kenya) Liberia Libya Malagasy Republic Morocco Republic of Niger (Niger) Nigeria Rwanda Republic of Sene-gal (SeneSene-gal) Sierra Leone Somali Republic Republic of South Africa Sudan Tanganyika Togo Tunisia Uganda Upper Volta Burma Cambodia China(Taiwan) Indonesia Japan Korea (North)
Republic of Korea (South) Laos Malaysia Philippines Thailand Vietnam (North) Vietnam (South) Ceylon India Nepal Pakistan Afghanistan Cyprus Greece Iran Iraq Israel Jordan Lebanon Saudi Arabia Syria Tukey
United Arab Republic Yemen (U.A.R.) Albania Bulgaria Czechoslavia Hungary Poland Romania USSR Yugoslavia
The indicators describe interrelationships between the social, economic and political factors of development at a given point in time. Both quantitative and qualitative variables were used. The fortyfive
indicators were measured along a development scale from High, Medium, Low, Very low and Extremely low although the choice of this scale appears to be somewhat arbitrary. It must also be noted that the scale of High is in the context of the developing nations and not with respect to the developed countries.
No weighting schemes have been considered although this is some-what of an oversimplification. For example in the set of indicators which express the amount of Communication Resources, the indicators of newspaper circulation and Radio distribution are more important in implying the ex-tent of communication than the indicators of television distribution and cinema attendance. Instead of considering unequal weights in the initial indicator comparison, weighting schemes were postponed until the analysis of the results. At this point the degree of importance that each indicator should have in producing the levels of development is considered.
3. THE INDICATORS:
The set of indicators present a framework of social, economic and political conditions under which development must occur. The indicators are related to the areas of economics, human resources, education, health, communication, national unity, self-governing experience, government direc-tion, amount of opposidirec-tion, power distribution and administrative structure.
listed below in the order they will be described in detail.
1./ Gross National Product (GNP) 2./ Gross National Product / capita 3./ Capital Percentage of GNP
4./ Energy consumed per capita
5./ Percentage of Labor Force employed in agriculture
6.1 Percentage of the working age employed in Industry 7./ Absolute Population Size
8./ Population Change (5' per year
)
9./
Density: population per square mile10./ Percentage of population that is working age i./ Size of country in square miles
12./ Urbanization
13./ Literacy ( % of population aged 11 and over
)
14,/ of population enrolled in Primary-Secondary schools to the Total School age population
15.1 Ratio of Teachers to Enrolled students
16./ Life expectancy at Birth (Female) 17./ Birth Rate
18./ Death Rate
19./ Ratio of Inhabitant per Physician 20./ Automobiles per capita
21./ Daily Newspaper Circulation per 100 population 22./ Radios per 100 population
23./ Television per 100 population 24./ Cinema attendance per capita 25,/ Relegious Homogeneity
26.1 Linguistic Homogeneity
27./ Racial Homogeneity
28./ Date of Independence 29./ Former colony
30./ History of Self-governing experience
31./ Experience of Political and Economic Development 32./ Ideological Orientation
33./ System Style
34./ Constitutional Status of present regime 35./ Government Stability
36./ Freedom of Group Opposition
37./ Political Encultration 38./ Sectionalism
39./ Political Leadership 40./ Charismatic Leader
41./ Vertical Power Distribution 42./ Horizontal Power Distribution
DETAILED DESCRIPTION OF DEVELOPMENT INDICATORS: ECONOMIC RESOURCES: Indicator 1: GNP Scale 1: Scale 2: Scale 3: Scale 4: Scale 5: Source: Stat
Inte
Indicator 2: GNP/ Scale 1: Scale 2: Scale 3: Scale 4: Scale 5: Source: AID Indicator 3: Capi Scale 1: Scale 2: Scale 3: Scale 4: Scale 5: Source: Russe World Yale Indicator 4: Ener Scale 1: Scale 2: Scale 3: Scale 4: Scale 5: Source: AID *Indicator 5: Perc Scale 1: Scale 2: Scale 3: (1,2,3,4,5,6) High 124.9 - 25 billion $ Medium 24.9 - 5 billion $ Low 4.9 - 1 billion $Very Low .9 - .5 billion $ Extremely low .49 - 0 billion $ istics and Reports Division, U.S. Agency for rnational Development, March 1962 (AID) capita High Medium Low Very Low Extremely low tal percentage of GNP $600 + $599 - $300 $299 - $150 $149 - $75 $74.9 - 0 High 25% + Medium 15 - 24.9% Low 14.9% - 10% Very Low 9.9% - 5%
Extremely Low Less than 4.9%
tt, B., H.R. Alker, K.W.Deutsch, H.D. Lasswell. Handbook of Political and Social Indicators. University Press , New Haven, 1964.
gy consumed per capita
High 1000 + kwhr per year /c. Medium 999 - 500 Low Very Low Extremely Low 499 - 250 249 - 100 Less than 99
entage of the Labor Force employed in Agric. High Less than or equal to
25%
Medium 25.1% - 50%
Low 50.1% - 60%
Scale 4: Very Low 80$- 60.1
Scale
5:
Ectremely low Greater than or equalSource: Russett et al. to 80%
Indicator 6: Percentage of Working age employed in Industry
Scale 1: High Greater than or equal
to 30%
Scale 2: Medium 29.9% - 104
Scale 3: Low 9.9% - 5%
Scale 4: Very Low Less than 4.9%
Source: Russett et al.
GNP is a questionable indicator because it is difficult to con-vert the sum of local currency into $ figures which are comparable between nations. This is in part due to the variety of methods by which GNP figures are computed for different countries. Further complication is involved in the determination of the buying power of the local monetary standard which should be the basis for translation into similar measures.
The most common use of total GNP is as an indicator of the total wealth or economic resources of a country. Used as an indicator of pow-er it implies how much capital a country is able to invest in industrial production and scientific and technological abilities which produce control or influence over other countries. Used as an indicator of well-being it refers to the amount of wealth that a country might be able to invest in leisure and consumer goods. These indicators are of course extremely re-lative and are further complicated by the fact that a high level of GNP has its own price to pay for support and maintenance. GNP hence has
lim-ited value as an indicator of the state of well-being or any welfare re-lated condition. It is used here as an indicator of absolute wealth to be combined with other indicators of health, well-being, education and personal wealth..
country with a GNP/capita greater or equal to $600 is defined as develop-ed. This indicator however tells little about the distribution of wealth or the degree of concentration of wealth in the hands of a few. Capital % of GNP indicates to some degree the amount of investment a country might employ in economic growth.
The last three indicators refer to the degree of industrializa-tion which can occur within a given country. Rostow discusses the transi-tion which must occur from an agriculturally based (75%) labor force to an industrially based one before the 'take-off' stage can occur. The first two of these indicators refer to the level of industrialization that a country has obtained. A high percentage of the labor force in agricultu-ral pursuits is correlated with a low energy consumption per capita and in-dicates a low level of development. The reverse situation refers to a highly developed or industrial society. The two indicators of
%
of la-bor force in agriculture and industry refer to absolute levels of develop-ment with respect to the industrialization continuum. The greater the percentage involved in agriculture the more rural oriented the country and hence the less industrialized.(6,7)
HUMAN R&SOURCES:
Indicator 7: Absolute population size:
Scale 1: High More than 100 million Scale 2: Medium 99.9 - 50 million
Scale 3: Low 49.9 - 10 million
Scale 4: Very low 9.9 - 5 million
Scale 5: Extremely low Less than 4.9 million Source: AID
Indicator 8: Population change
( %
per year)
ScAle 1: Very High Greater than or equal to 3.5
Source: AID
Indicator 9: Density: Population per square mile Very High High Medium Low Very Low Greater than 600 599 - 300 299 - 100 99 - 50 Less than 49.9 Source: AID
Indicator 10: Percentage of Population that is Working Age Very High High Medium Low Very low Greater than 65% 65% - 60.1% 60% - 55.1% 55% - 50.1% Less than 50% Sources: United Nations Statistical Yearbook, 1966.
+ Supplemented by Russett et al. Size of Country in square miles: Scale 1: Very large
Scale 2: Scale 3: Scale 4: Large Medium Small
Greater than or equal to 2 million square miles
1.9 million - .3
.299 million - .075 Less than .075 million Source: Banks, ArthurS. and Robert Textor. A
Cross-polity Survey. (Cambridge, Massachus M-- IT Press, 1963. Indicator 12: Scale 1: Scale 2: Urbanization High Low 20 of the population resides in settlements of 20,000 and 12.5$ of the population resides in settlements of 100,
600 +.
Less than 20% live in 20,000 settlements and less than 12.5% live in 100,000 + settlements Scale 2: Scale
3:
Scale 4: Scale 5: High Medium Low Very low Scale 1: Scale 2: Scale 3: Scale 4: Scale5:
Scale 1: Scale 2: Scale 3: Scale 4: Scale 5: Indicator 11: 3.5 - 2.51 1.51 - 2.5 1.1 - 1.5 Less than 1.0Source: Cross-Polity
Density, urbanization and the size of a country are related indicators contributing to economic development. A low density country without urbanized areas may impede development with the necessity to pro-vide extensive investment in communication networks before effective mobi-lization can occur. These indicators measure to some degree the wealth invested in land and urban infrstructure.
The indicators of population size and population change and de-pendency ratio are another form of wealth. The absolute size and the size of the nonproductive population refer to the amount of services and invest-ment that must be devoted to nonproductive investinvest-ment such as famine con-trol for an overpopulated agricultural population and income maintenance programs for the elderly. A rapid population growth and a high depen-dency ratio impede development by requiring higher investments in consumer goods, health and educational services and reduce the amount of capital available for production investment. A further repercussion of an expand-ing,, population even with an increasing GNP is the possible reduction in or constant level of GNP/capita so that economic gains are nullified and shifts in the economy required for development are prevented. Density can be further viewed as an indicator of the upper bound for urbanization. High density rates without urbanization however imply stagnant development
as overhead expenses consume most capital expenditures.
'These indicators are grouped together to produce a category of human resource endowment. This category measures the degree to which the population, area and degree of urbanization produce a climate which is amenable to development rather than a climate which nullifies available
resources.
(4,8,9,10) EDUCATIONAL RESOURCES:
Indicator 13: Literacy Rates (% of population aged 11 and over)
Scale 1: High Greater than or equal
to
904
Scale 2: M1edium 89$ - 50%
Scale 3: Low 49% - 25%
Scale 4s Very Low 24.9p - 10
Scale 5: Extremely Low Less than 106 Source: Indicator 14: Scale 1: Scale 2: Scale 3: Scale 4: Source: Indicator 15: Scale 1: Scale 2: Scale 3: Scale 4: Source: AID
%
of population enroll1ed in Primary-Secondary Schools to the total school age populationHigh Greater than or Equal to 60%
Medium 59% - 40.1%
Low 40Y - 25.1%
Very Low Less than or Equal to 25%
Russett et al.
Ratio of Teachers to Enrolled Students
Very Good ratio Less than or Equal to 1:20
Good ratio Between 1:20 and 1:35 Poor ratio Between 1:35 and 1:50 Bad ratio Greater than 1:50 Computed from a set of figures from AID
Education very well may be the prerequisite for social and
econ-mic change; certainly it has a major role
ofs,
instigating change on all levels. The educational system is often viewed as the vehicle for politi-cal socialization and national unity. It is to be noted that literacy fi-gures and enrollment rates do nd& reflect the quality of teaching, the drop-out rates, absenteeism or failures. The rate of enrollment may however re-flect the value placed upon education in the country under consideration.The teacher:student ratio points to the quality of education with respect to personal student attention and overcrowded classes.
Educational training, especially literacy, can be considered to be an indicator of a country' s potential for development. Countries under-going rapid urbanization but with low rates of enrollment and teacher : student ratios and consequently low literacy rates will find that many of the recent arrivals to the cities from the countryside will be unemployable. Many of the technical skills required for technological development will not be met. Similar difficulties produced by low staddrds of education occur with respect to the education of skilled administrators required to execute and coordinate development plans.
(1,4,9) HFALTH RESOURCES:
Indicator 16: Life Eapectancy at Birth (Female)
Scale 1: High Greater than 65.1
Scale 2: Medium 65 - 50.1
Scale 3: Low 50 - 40.1
Scale 4: Very Low Less than or equal to 40
Source: Statistical Yearbook, 1966 Indicator 17: Birth Rate
Scale 1: Low Less than or equal to
20 (per 1000 pop.)
Scale 2: Medium 34.9 - 20.1
Scale 3: High Greater than or Equal
to 35 Source: Statistical Yearbook, 1966
Indicator 18: Death Rate
Scale 1: Low Less than or equal to 15 (per 1000 pop.)
Scale 2: Medium 24.9 - 15.1
Scale 3: High Greater than or equal to 25
Source: Statistical Yearbook, 1966
Indicator 19: Ratio of Inhabitants per Physician
Scale 1: Low Less than or equal to
2,000 per physician
Scale 2: Medium 25,000 - 2,000
Scale 3: High 49,999 - 24,999
Scale 4: Very High Greater than or equal to 50,000
Together these indicators represent the health level of a nation which has a consequent effect on the population rate. A higher birth rate, a longer life expectancy, more physicians per capita and lower death rates are secondary determinants of increased population growth rates. Even one of these indicators showing considerable increase effects the growth rate. They can also be considered to represent the level of living standards or the risks upon life that one encounters in a given nation.
COMIUNICATION Indicator 20: Scale 1: Scale 2: Scale 3: Source: Indicator 21: Scale 1: Scale 2: Scale 3: Scale 4: Source: RESOURCES:
Automobiles per capita High
Medium Low
Greater than or equal to .025
.01 - .025
Less than or Equal to .01
Calculated from AID figures
Daily Newspaper Circulation per 100 popul tion High Greater than or equal
to 10.0 ( per 100)
Medium 10 - 3
Low 3.0 - .9
Very Low Less then 0.9
UNESCC World Communications: Press, Radio, Televi-sion, Films. Netherlands, 1964. (.C.62/D.52?A )
Indicator 22: Scale 1: Scale 2: Scale
3:
Scale 4: Source: Indicator 23: Scale 1: Scale 2: Scale3:
Source: Indicator 24: Scale 1: Scale 2: Scale3:
Radios per 100 population High
Medium Low Very Low
Greater than or equal to 10 (per 100)
10.0 - 3.0
3.0 - 0.9 Less than 0.9 UNESCO
Television per 100 population
High Greater than or equal to 5.0
Medium 5.0 - 1.5
Low Less than 1.5
UNESCO
Cinema attendance per capita
High Greater than or equal to 5.0
Medium 4.9 - 1.0
Low Less than or equal to 1.0
Source: Russett supplemented by UNESCO
To some extent these indicators can be said to measure the de-gree of modernization of a country. This concept is difficult to define in terms that will be agreeable to most concerned, however it is used here in the sense of awareness of and communication with ideas and materi-als foreign to the native culture or locale; the channels of information which produce social and economic upward mobility and cultural change.
(11.)
Daniel Lerner has pointed out that "... modernization is the transition to participient society..." and it is for this reason that the communica-tion category becomes an important vehicle for developing countries; the mode of transition from traditional to modern society.
(6,12,13,14,15,16,17,18,19,20) NATIONAL UNITY:
Indicator 25: Religious Homogeneity
Scale 1: Homogeneous
Scale 2: Heterogeneous
Source: Cross-Polity
Indicator 26: Linguistic Homogeneity
Scale 1: Homogeneous
Scale 2: Heterogeneous
Source: Cross-Polity
Indicator 27: Racial Homogeneity
Scale 1: Homogeneous(Majority of one race 85%+ and no strong minority race)
Scale 2: Weakly Heterogeneous ( Majority 85%+ of one race but strong minority of 15% or less )
Scale
3:
Strongly Heterogeneous ( no one group of 85b or more)These indicators seek to establish the degree of cultural frag-mentation of a country. Key to the adoption of most centrally directed development plans is the accepted norm of a national polity by the resi-dents of the country. A country split be religious, racial and linguistic diversity will have difficulty in obtaining commitment to or organization for comprehensive planning or institutional changes. A prerequisite for development planning thus becomes a degree of national unity. Perhaps much of the effort in non-unified countries must go to establishing a basis for future planning and agreement and to eradicating hatreds and divisive ideologies. Witness the effort in this direction by the campaign of Attaturk for national unity. These indicators can also be used as indi-rect implications to economic and social aspects which are likewise diver-gent if national unity is lacking.
The role of national unity in dievelopment _ appears to be extremely sensitive. The issue of linguistic or racial diversity can not be disregarded by directing everyone's allegiance to the unity con-cept. Particularistst views and actions will continue to thwart the nationalistic politicians. In India, the recognition of particularist groups has weakened the strength of the main political party although broadening the base of national unity.
SELF-GOVERNING Indicator 28: Scale 1: Scale 2: Scale 3: Scale 4: Source: Indicator 29: Scale 1: Scale 2: (6.12.13,14.15.16.17,18 19 20) EXPEIENCE: Date of Independence Very Early Early Recent Present
Before the 19th century
1800 - pre WWI
1913 -1945 (pre WWII)
1945 - present
Cross-Polity Former Colony
Never Colonized (or for short times only)
Governed by colonial power for some periods of time Source: Indicator 30: Scale 1: Scale "cale Source: Indicator 31: Scale 1: Cross-Polity History of Self-government
Self-governing experience gained through early self-modernization period
Limited experience gained through a developed society modernizing under tutelage
Very weak experience gained by an underdeveloped society under tutelage
Cross-Po lity
Experience of Political and Economic Development
Experience --- The transitional phase of
creat-ing a politically organized society, of assertcreat-ing , ,
political policies to develop, and of breaking with agrarian forms of institutions has been completed. In this phase, the power structure is in accord that development is desirable and effort now is concentrated on achieving such in the best manner.
Scale 2: Some experience --- This characteristic is
dis-played by those countries who entered the transi-tional phase prior to 1945.
Scale 3: Weak Experience --- This phase involves those
countries who entered the transitional phase after 1945 and consequently have obtained moderate ex-perience, political orientation and direction toward the basic aims of development.
Scale 4: No experience --- This is displayed in those
traditional societies for which modernization has had no profound effect.
Source: Cross-Polity
These indicators represent the political leadership experience which a country has gained. The first indicator measures the length of time during which the country has been an independent polity. Although independence does not imply stability it can be used as a measure of govern-ing experience. The fact that a country has recently achieved independence and prior to this has had colonials holding most authoritative positions implies a current void when independence is obtained with respect to self-governing experience. The third indicator points to possible situations under which institutional adaption to the changing conditions of develop-ment was inspired by internal or external powers. In other words, did a country receive development impetus from an external colonial source or were the self-governing institutions developed internally? The fourth
indicator is concerned with the length of time during which a country has been motivated or committed to development. This attempts to measure the
degree to which the leaders have gained general support of their develop-ment programs or to which there will be battles of acceptance to fight for any non-traditional procedure. Self-governing experience is thus de-rived from a country's political support of some basic aims of develop-ment. This support implies that the divisive conditions of colonial
versus national power, traditional versus modernizing attitudes, regionally located political systems as opposed to centrally based ones have been era-dicated and have therefore produced some degree of self-governing
experi-ence ind some estiblishment of lakblitical and administrative structure in the interim.
The prevailing self-governing experience will contribute to the general aims and direction of planning programs; the degree to which the politicians can organize and implement plans and the boundaries by which their suggestions are constrained. The degree of self-governing experi-ence will also help to determine the ability with which the leaders can modify their policies and can maintain leadership in the face of inflexi-ble opposition. Negotiating and flexibility of governmental methods can be produced by relatively long periods of self-governing experience.
(6,12,13,14,15, GOVERNMENTAL DIRECTION: GUIANCE AND CONTROL SYSTEM 17,18,19,20)
Indicator 32: Ideological Orientation
Scale 1: Doctrinil -- Communist States
Scale 2: Developmental -- development has been accepted as the first priority national goal
Scale
3:
Situational -- These countries have no commitment to developmentScale 4: Conventional -- Innovative procedures or changes in power relations are ac-complished through conventional channels.
Scale
5:
Traditional -- these countries produce no changes and are based on traditional means for accomplishing goals.Source: Cross-Polity Indicator 33: System Style
Scale 1: Mobilized
Scale 2: Lim ited mobilization Scale 3: Non-mobilization
This indicator refers to the absolute level of political commitment of all resources to solve urgent problems of development.
Source: Cross-Polity
Indicator
34:
Constitutional Statusof
Present Regime Scale 1: ConstitutionalScale 2: Authoritarian Scale
3:
TotalitarianThis indicator represents the degree to which individual rights are honored and hence the degree to which a country can compel its citizens to accept its development programs or to which the interests of all major groups are served. Source: Cross-Polity
Indicator 35: Government Stability Scale 1: Stable since W.W.I Scale 2: Stable since W.W.II
Scale 3: Moderately stable since W.W.II Scale 4: Unstable
since
W.W.IIThis indicator although difficult to measure represents the period of time during which a country has had a stable government with which to implement its development plans. Source: Cross-polity
These four indicators are grouped together to represent a cate-gory referred to as Governmental Direction. Perhaps they should be put into separate subcategories of a guidance indicator of the degree of poli-tical and resource commitment and a control indicator of enforcement and implementation ability. The category of Government Direction seeks to
re-late comitment with implementation procedures in order to assess the degree to which a government can direct its development programs.
(12.)
D. E. Apter discusses a similar concept when he defines
development types with respect to different approaches to economic develop-ment and to different processes of change within each type of system.
These development types provide a framework with which to assess the de-velopment goals and decisions and the patterns of legitimacy, loyality, and authority which occur in a given country.
A government with a strong degree of commitment to and mobiliza-tion for development plus an ability to enforce these programs will per-haps be found to sacrifice such things as immediate consumer consumption for the eventual attainment of a higher level of income per capita and more equal income distribution. On the other hand, a government equally com-mitted to development but constitutionally required to listen to the op-position would not be able to direct its programs against the will of major concerns. Yet another cause of ineffective governmental guidance is
seen in all countries with unstable governments. Internal political
unrest mainly presents itself as a barrier to development programs. Stable and committed governments on the other hand seem to be required for program implementation.
The category of government direction in some respects points to the degree of action a government can impel, assuming of course the re-quired resources. Note that one difficulty of a highly committed, mobilized and enforced program is the over-rigidity and resistance to change that may make a program incapable of adapting itself to unexpected problems. Once a typology of government direction has been established it would be in-sightful to determine the relationship of types to instances of planning
successes or failures.
The level of development may also imply the degree of government direction required. For example a strongly committed and mobilized sys-tem may be necessary to overcome stagnation and promote structural change to move a backward country onto the development escalator. On the other hand, a fairly developed country may require a relaxed environment of government direction that enables innovative decision making techniques or sophisticated methods of guidance to play a more dominate governing role. In the latter group of countries, central control may not be the most effective development procedure.
(6,12,13,14,15,16,17,18,19,20) AMOUNT OF OPPOSITION:
Indicator 36: Freedom of Group Opposition
Scale 1: Autonomous groups politically allowed to oppose the government
Scale 2: Autonomous groups politically allowed but their capacity to oppose the government is limited Scale 3: Autonomous groups only allowed informally,
extra-political
Scale 4: No autonomous groups allowed Source: Cross-Polity
Indicator 37: Political Encultration
Scale 1: High -- a highly integrated and homogeneous po-lity with no fractions nonassimilated, or disenfrancised.
Scale 2: Medium -- a less integrated polity with minority groups in extreme opposition
Scale 3: Low -- a nonintegrated or restrictive polity with a majority in extreme opposition Source: Cross-Polity
Indicator 38: Sectionalism
Scale 1: Extreme --groups which identify extremely with a sizeable geographic area and consequently challenge the cohesion of the polity.
Scale 2: 1 oderate --One group with strong feelings or several with moderate feelings of sectionalism Scale 3: Negligible -- there are no significant feelings
to be taken into account Source: Cross-Polity
These three indicators are combined to represent the amount of opposition which occurs in a given country. Those which drive all politi-cal opposition underground and have no fractional groups and little
sec-tionalism will be able to enforce their programs with considerable allegi-ance. The resources required such as maintenance of a police force and
surveillance measures to drive opposition underground may however divert funds required for development programs. On the other hand a country that has a multiplicity of political groups, allegiances and loyalties may find
itself unable to reach consensus programs and hence unable to proceed with development plans.
This category seeks to measure the degree to which political, group and sectional 6ppesition influence major planning decisions and the level of unity or diversity of allegiance which is sought. The degree of opposition can be viewed as representing the strength of interest groups which have achieved an effective voice in a relatively advanced society. For a traditional society it might represent the degree of individualism that marks the psychological position of individuals in underdeveloped countries.
Where extreme opposition exists, in one form or another, it is necessary to discover the degree of influence or control it can have over development decisions. Extreme sectionalism requires regrouping of allign-ments into national political institutions before development plans can be pursued and this procedure may be painful and slow.
(6,12,13,14,15,16,17,18, POWER DISTRIBUTION (Governmental Organization) 19,20) *Indicator 39: Political Leadership
Scale 1: Elitist -- recruitment is from a particular racial, social or ideological class
Scale 2: Moderate Elitist -- recruitment is not complete-ly closed to the non-elite
Scale
3:
Non-elitist -- recruitment is based on achievement Source: Cross-PolityIndicator 40: Charismatic Leader Scale 1: High
Scale 2: M1oderate Scale
3:
WeakSource: Cross-Polity
Indicator 41: Vertical Power Distribution
Scale 1: Federalism -- general and regional government coordinated but independent
Scale 2: Limited Federalism -- displays limited separation or strong centralism
Scale 3: Formal acceptance of Federalism but not implement-ed
Scale 4: Unitarism Source: Cross-Polity
Indicator 42: Horizontal Power Distribution
Scale 1A: Effective allocation of power to structurally au-tonomous legislature, executive and judiciary governmental branches
Scale 2: Allocation of power to one branch or two branches with limited autonomy
Scale
3:
Government dominated by one body (Governmental agency or branch)Source: Cross-Polity
Power distribution effects the ability and climate for planning in governmental system; the command, control and coordination required for action. If horizontal and vertical power is effective then there should be a distribution of persons who will guide and implement projects
out the structure. A government dominated by an elite group may not have effective channels through -hich to mobilize involvement in plan-ning. The more effective the power distribution the more coordination among governmental units involved in the development process. Certainly
the
the methodology for plan implementation is shaped byexisting type of go-vernmental organization.
Governmental organization refers to the distribution of power throughout the government. In part this category indicates the quality of environment which allows for the development of administrators th-oughout the levels of government. Administrators in developing countries can be viewed as major channels of innovating ideas and direction.
An elitist leadership with strong centralist tendencies and suf-fering from limited numbers of qualified administrators will produce an en-vironment that will find the lower ranks of the government organizations ineffectual and unable to execute any plans. Furthermore conflicting or controversial plans may have more success if they can call on allegiance throughout the governmental organization.
The charismatic leader indicator is included in this category be-cause of the substitutions in effective power distributions that the "great man" theory can produce. Given a charismatic leader, mobilization and
commitment to his program can supercede the prerequisites of effective po-wer distribution. In this case personality types are substituted for
insti-tutional structure.
(6,12,13,14,15,16,17,18,19,2o) ADIaNISTRATIVE STRUCTURE:
Indicator 43: Current Status of Legislature Scale 1: Highly effective
Scale 2: Partially effective Scale 3: Largely ineffective Scale 4: Wholly ineffective Source: Cross-Polity
Indicator 44: Current Status of Executive Scale 1: Dominant
Scale 2: Strong Scale 3: Weak
Source: Cross-Polity
Indicator 45: Character of Bureaucracy:
Scale 1: A modern effective and responsible civil service. Scale 2: Limited effectiveness because of personnel
short-age , inadequate recruitment and performance cri-terion or dominated by some other governmental organization.Scale
3:
Colonial bureaucracy in the process of person-nel 'nationalization'Scale 4: Traditional non-nationalized bureaucratic struc-ture
Source: Cross-Polity
This category is similar to that of governmental organization although here the concern is directed toward the characteristics of per-sonnel rather than the effective structure of communication and coordina-tion. Both these categories describe the "machinery for planning". The degree of personnel competence greatly effects the climate of program gui-dance and again emphasis is on the ability to translate policies and plans into action. The relationship of the legislature, executive, and bureau-Onaay to one another and the degree to which the effectiveness of one can be substituted for that of another is indeed open to question; however it is assumed here that their effectiveness is not independent and that a strong bureaucracy can compensate for a weak executive, etc.
222212335221222123411121111221103041303320202 ARGENT 5514425453223323113222C0223221222131333342222 BOLIVIA 232340235311232213322222121221103141312311222 BRAZIL 4 324222425331233231121132101221143131332341202 CHILE 332432325421223313322132121221243131212342222 COLOMBIA 5 -522333514440222213322230111221143131133341222 COSTA RICA 322322433341212213412111121221101304030143012 CUBA 432430513441324212333232121221223101233341022 DOMINICAN REPUBLIC 433532525431233313332232223221243141311342222 ERUDOR 7 5324435123423322133321321212212332423313A21.2_ELSALVADOR 533543524342342312333222223221203040331342002 GAUTER4IA 8 554553542342544412 333433221223244003330343412 HAITA 532543525441332312333230121221243141231342212 HONDURAS 422322532441224113312202221422303101233241122 JAMAICA 222333325421223213322121121221143122202332212 MEXICO 535443515441342212332232121221203232301342312 NICARAGUA 523433525441222213312120122221203141332342222 PANAMA 11 544532525330222213432200101221203202031343412 PARAGUAY 331342325421233113322131223421203101233341122 PERU 12 521211522440212123312201222222403101233341122 TRINIDAD 320320535141223223411121111221143121003341132 URUGUAY 2112234253212220134121111,22221122141233322222 VENEZUEIA 322444335322040432323432113422421200220243313 ALGERIA 14 55000000304_25004310000000114233230020_33042303_BURUNDI 550300555432534432234400213423323002223212223 CAMEROON
550500545332540431234300013423323203333243313 CENTRAL AFRICAN REPUBLIC 550504535322540431134403223423323002323243303 CHAD
16 550500535432430432334300213423323002323243313 CONGO(BRAZZAVILLE)
3453i3i54226304332344032 i i3423323040313000003~ CONGOa(i~f6Di E ---
-7 550500525242540431234403213423323003323243313 DAHOMEY-454500345322543000134400223411253233323143414 ETHIOPIA 18 540500555032530321324200213423323002323243313 GABON 333540424532333432332302213423321223222143412 GHANA 550530425432443333334300213423321223222143412 GUINEA 430500535432540431234300213423322003233143313 IVORY COAST 20 --- 402500435440433333324433CC OOOOCCOOO00000COOKENYA---531400555342540000334403213212302213321343312 LIBERIA 21- 531500545321432023324202111422301122212222222 LIBYA 540500425332304000334000201423301101213332223 MALAGASY REPUBLM 22 - -- 55050043522254043123440222342332C 00300_3242313 MALI 502540525222C41431120300123423321102222242313 MAURITANIA -- 332543324221444332323232112422101122213242212 MOROCCO 5505005233224043113440022~342332C03303243303 NIM- ---24 344530333422443032224333213423301100310022223 NEGERIA 05050052334254303213000301142332C002030042303 RWANDA 25 53050052553244243233420011342332C000223243313 SENEGAL 550550534342443012234403213423323101222342223~ ImLNN---26 552500525332544000234303111423323002212342303 SOMALI REPUBLIC
222122325321332221412202223221243010211341111 R1MMMICF SeA MCA ---27 344550325522544012234402223422122243220343003 SUDAN
452500435322544412334403213423322002233143313 TANGANYIFA 550500524342544023234303213423322000223043003 TOGO
433543534441334013323202111422122122233243312-TUNIS 55350043433234201233433321342320310131C010203 UGANDA
01t- s-- i -- -- i -- -i - - - -Ii - ---id i ff-o-- --- UPP9_9 Votir - -- --- - - ---550500535332543011 134400213423203101310010203 UrVL -352540334332233311333401113422301240210030003 BUMS 443550434442233312134433112422302233220143414 CAMBODIA 342333311440123123432231010111111324021143412 CHINA(T&lAN- -255540233222233112133432113422322232313143310 INDONESIA 32 -
_---DEVEPMENT____JCARS---_---CT---2 55000030344000013000000011102111324031243412_KORE (NORTH)L 3535433314412242123322320111021C0240330340002 KORFA, REPUBLIC 550550545332442012134403213422333240311043404 1Aos 333433423440322223322201223422323211323321122 NAJAysTA 344544434540223223433333113422143121222341122__PaLI---ES 343533322342212223332302213422303141222342202 THAIIAND 340000343040C 0000000000012422311324911143412___yrM(NORT) 344500333040404023333402012422301033332343410 VIETNAM, REPUBLIC OF 6- 343554323332223213333430112111252323121343404 CEYL)N, 143543132322433313323402113422103121213131112 INDIA 550054433342502012104400203111303243301043424_jEpAL 254543232522443312334403113422103240310223010 PAKISTAN 450550354332540000134400123_113253213221042414_AFfzBAS-ISTA--522322533342223123411131213422143101330041122 CYPRUS 322322453141223233431101111213143131233341202 GREECE 332952335421442013333232113123203242310043014 IRAN 10---31450435531432023313330113322133040310040C00__ _A_ 311112523341112123411101113422122121233341121 ISRAEL 11 13002052554132201333320211142215324031124341_4__JIMUL 212520532341221023432211211322143141320342222 LEBANON 12 330000405322442000224330101312453213331243014 SAUDI ARABIA 230040424341332023333232112322133040320040002 SYRIA 13---133443324321_333213432232112113143101133341222
TURKEY-2435433-34321333212333232111422121223030143412 UNITED ARAB REPUBLIC
14 --- 140000504332_3_20000_10000010131230000031004000YEEN-____ 430040523442200123002202211213111324021343412 ALBANIA 15 321042443141212133001131112213111324021343412 BULGARIA 210021343241112133001111213313111324011343412 CZECHOSIAVIA 216 __- 33.4_%4_1100112121111_3111303031343412__UAITJ-G 221021343331112133001121111313111323131343412 POLAND 17 2200A0--4-1131213-3.0-31ll22l_3lliU2_4QM3.43.41_i0M-NIA 112021104311121133001121013113111324011003012 USSR 18 221042343232212123002231213313111323311243412 YUGOSIAVIA I DEVELOPMENT INDICATORS 45 19--- 20---21 24 26 27 u 3 2-- --- --- K
329---CHAPTER THREE
ANALYSIS OF THE RESULTS:
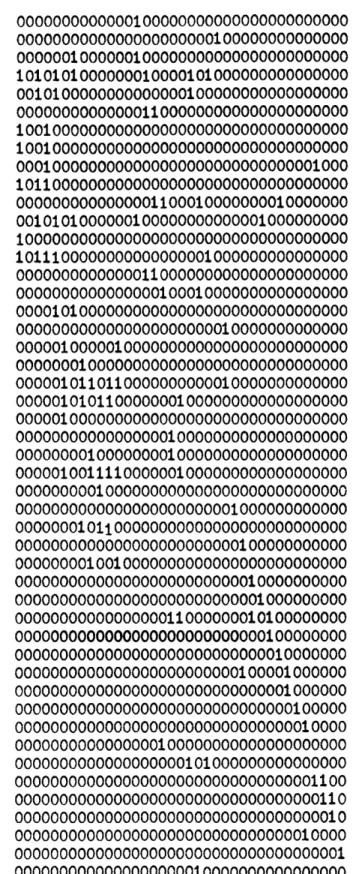
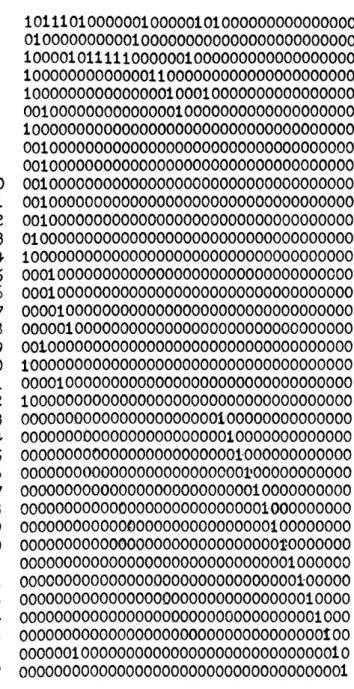
Although the technique of cluster analysis is explained in de-tail elsewhere, a few words about the procedure are necessary in order to understand the results. Fourtyfive indicators of development for 93
inde-pendent countries are compared against each other to obtain an agreement coefficient for each pair of countries. A significance test SO is placed on each of the 8,649 agreement coefficients to produce an incidence matrix whose entries are '1' when the agreement coefficient passes the test and otherwise '0'. All the consequent cluster formations are based on this indidence matrix. Four test levels are tried: s0 = 0.8, SO = 0.5, SO = 0.2, and SO = 0.1 . The incidence matrix is analyzed to determine space-types which are further defined as phenomenal and nuclear clusters. Phenomenal clusters are obtained directly from the linkages contained in the incidence matrix. Each member of a phenomenal cluster is linked to every other cluster member. The number of overlaps in the phenomenal clusters yield a matrix of nucleus counts from which the nuclear clusters are determined. When orders of overlaps are introduced, the concept of
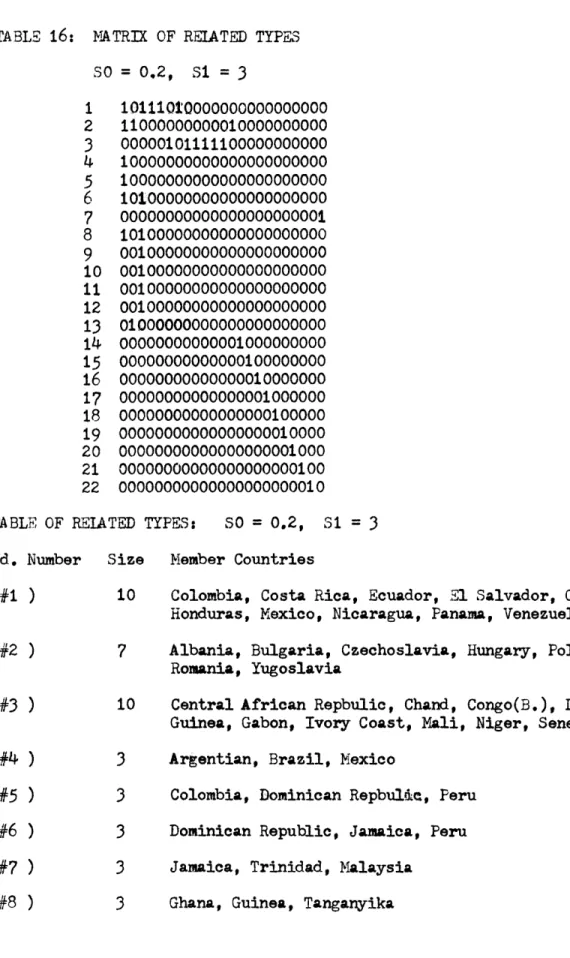
'typicality' is defined. The overlap matrix is also given a significance test Si, usually 31=2 , to determine relatedness. A matrix of related-types is produced by combining all the phenomenal clusters which have a significant number of overlaps in common. The indicator patterns of agree-ment and variability are next examined to produce developagree-ment- stages for each related-type. These stages are then compared against each other to offer tentative development paths. /
1. STAGE ONE: Cluster and Type formation at SO = 0.8:
This test appears to be too stringent a criterion for the data of comparative development for no agreement coefficient is able to pass it. The significance test SO is consequently lowered to SO = 0.5
2. STAGE TWO: Cluster and Type formation at SO = 0.5:
Testing the agreement coefficients against this significance level yields the incidence matrix of Table 1. This matrix produces the eight phenomenal clusters of Table 2 and Table
3.
The column for cluster frequency is obtained from the percentage of clusters of a given size to the total number of clusters. Obviously clusters of size two are the most prevalent. When the matrix of nucleus counts is analyzed it becomes apparent that there are no significant overlaps ( Si = 2 or greater)
among the phenomenal clusters. However when the criterion is lowered to Si = 1, the Tables 5,6, 7, and 8 yield the related-types. The overlaps of Table 6 are best displayed by the diagrams of Figure I .Regional Definitions at SO = 0.5:
The second stage of cluster formation reveals that regional boundaries are maintained. The five related-types can be defined by the following regional descriptions: (type 1): Eastern European;
(type 2): Latin American; (-type 3): African; (! type 4): Carrlbean; (.type 5): African.
Indicator Patterns of Agreement and Variability:
In order to facilitate analysis, the 45 indicators have been grouped into eleven categories. The following sets of indicators
INCIDENCE MATRIX: so
=
0.5 Columns: 1 5 9 14 2030
35
11 1 1 1 1 1 1 1 1 1 1-1 1-1 1.1 1 1 1 11 i 1( all zeroes are suppressed
)
Row 42
TABLE 1 ( continued on next page ) Rows: Row
5
Row 9 Row 14 Row 20 Row 28 Row 30 Row 32 Row 34Columns: 87 93 :rows:: i4 Row 43 1 1 1 1 1 1 1 1 1 1 1 1 1 1 1 1 1 1 1 1 1 1 1 1 1 1 1 1 1 1 1 1
( all zeroes are suppressed ) TABLE 1 : ( continued ) 11111 11111 11111 11111 11111 Row 87 Row 89 Row 91 Row 93
TABLE 2: LINKAGE MATRIX WITH ZERO ROWS DELETED: 01010000 01000000 00100000 00010000 00100000 00001101 00001000 00000100 00000010 00000010 00000001 10000000 10000000 10000000 10000000 10000000 Colombia Ecuador Jamaica Mexico Trinidad Congo (B.) Dahomey Gabon Ghana Guinea Ivory Coast Bulgaria Czechoslavia Hungary Poland Romania
12345678 Cluster Identification Numbers
TABLE
3:
PHENOMENAL CLUSTERS: Cluster Id. Numbers(
1.)
'
(
2.)
( 3.
)
(
4.)
( 5. )
(
6.
)
( 7. )
(
8.)
Size of Cluster Member Countries of Cluster Bulgaria, Czechoslavia, Hungary, Poland, Romania Colombia, Ecuador Jamaica, TrinidadColombia, Mexico
Congo(B.), Dahomey Congo (B.), GabonGhana, Guinea
Congo(b.), Ivory Coast
Cluster frequency 12.5%
87.5%
Row5:
Row 9: Row 14: Row 15: Row 20: Row 28: Row 30: Row 32: Row 33: Row 34: Row 35: Row 87: Row 88: Row 89: Row 90: Row 91:TABLE 4: Matrix of Nucleus Counts: 12345678 50000000 02010000 00200000 01020000 00002101 00001201 00000020 00001102
TABLE 6: Incidence Matrix among Phenomenal Clusters:
TABLE 5: Nuclear Clusters Size Number of Member
Poolisters Countries involved in
overlap
Congo(B.) Colombia
TABLE 7: Matrix of Related-Types: 12345678 10000000 01010000 00100000 01010000 00001101 00001101 00000010 00001101 Id. numbers #1 #2 #3 #4 #5 1 0 0 1 0 0 0 1 0 0 0 0 0 0 0 0
TABLE 8: Table of Related-Types: Id. Number Size
(
#1) (##2)( #3)
(
#4)(
#5)
Member Countries:Bulgaria, Czechoslavia, Hungary, Poland, Romania Colombia, Ecuador, Mexico
Cong(B.), Dahomey, Gabon, Ivory Coast Jamaica, Trinidad
FIGURE 1:
Type numbers:
(
7
f
1
)
Cluster numbers: (
Countries: Bulgari Czech. Hungary oland omania
Tyje numbers: Cluster numbe Countries: Type numbers: Cluster number Countries
(2)
rs: )()
Ecuado Colombia Mexico Jama
(# )
s(8
( )
(#6)
Ivory oast Dahome Congo(B abon
(#4) 3) ica Trinidad
(#5)
(
7)
Gha Guineasent each category: Categories:
I. Economic Resources:
II. Human Resources:
III. Educational Resources:
IV. Health Resources:
V. Communication Resources:
VI. National Unity
VII. Self-governing experience: Indicators: 1/ 2/
3/
4/5/
6/
7/
8/9/
10/ 11/ 12/ 13/ 14/ 15/ 16/ 17/ 18/ 19/ 20/ 21/ 22/ 23/ 24/ 25/ 26/ 27/ 28/ 29/ 30/31/
GNP GNP/capita Capital formation of GNP Energy consumption%
of labor force in agriculture%
of working age employed in industryAbsolute population size Rate of population change Density
% of population working age Size of country
Urbanization
Literacy rates
%
of enrollment to school age population Teacher:Student ratioLife expectancy at birth Birth rate
Death rate
Population:Doctor ratio
Automobiles/capita
Daily newspaper circulation Radios per 100 population Television per 100 population Cinema attendance/ capjita
Religious homogeneity Linguistic homogeneity Racial homogeneity Date of independence Former colony History of self-government
Experience of political and economic develop-ment
32/ Ideological orientation
33/ System style-- degree of commitment to devel-opment
VIII. Governmental Direction: VIV. Amount of Opposition: X. Power Distribution: XI. Administrative Structure: 34/ Constitutional status 35/ Governmental stability 36/ 37/ 38/
Freedom of group opposition Political encultration Sectionalism
39/ Political leadership 40/ Charismatic leader
41/ Vertical power distribution 42/ Horizontal power distribution
43/ 44/ 45/ Status of legislature Status of executive Status of bureaucracy
The indicators have been grouped into three categories; those which demonstrate agreement between all members of the related-type,
those variables which demonstrate near agreement, and those indicators which are either no measured or vary widely between members.
ment means that indicators vary at most by one measurement.
REIATED TYPES ( #1) Near agree-MEMBER COUNTRIES Bulgaria Czechoslavia Hungary Poland Romania PATTERNS OF INDICATORS: Agreement indicators:
(8) a low population growth rate
(9) medium population density (12)a high degree of urbanization (13)a good teacher:student ratio (14)a high life expectancy
(17)a high birth rate (18)a high death rate
(21)a high daily newspaper circulation (22)a high number of radios per 100
(24) a high cinema attendance (26) linguistically homogeneous (27) never been colonized
(30) a weak history of self-governing experience
(31) a high degree of experience in econo-mic and political development
(32) communist ideology
(33) a mobilized or high degree of politi-cal commitment to development
(34) totalitarian status (39) elitist leadership
(40) weak charismatic leaders
(41) no vertical power distribution (top-down )
(42) no horizontal power distribution ( dominated by one body )
(44) a dominant executive
(45) a limited effective bureaucracy Near Agreement Indicators:
(1) ;a medium to low GNP
(2) a high to medium GNP per capita
(6) a high to medium % of the working force in industry
(7) a low or very low population size
(11) medium and small country size (14) a near high literacy rate
(35) Governments been stable since WWI or
WWII.
(36) no opposition groups allowed or only allowed informally
Highly variable indicators:
(4) energy consumption
(5)