Toward a tool aimed to quantify soil compaction risks at a
regional scale: application to Wallonia (Belgium)
Dimitri D’Or, M.-F. Destain Dimitri D'Ora, Marie-France Destainb,*
a
Ephesia Consult, Tienne-de-Mont, 10 – 5140 Sombreffe (Belgium). Email: [email protected]
b
Precision Agriculture Unit, Department of Environmental Science and Technology, University of Liège, 2 Passage des Déportés, 5030, Gembloux (Belgium). Email : [email protected]
ABSTRACT
The spatial analysis of the soil compaction risk has been developed at the regional level and applied to Wallonia (Belgium). The methodology is based on the estimation of the probability of exceeding the preconsolidation stress due to the application of loads on the soil.
Preconsolidation stresses (Pc) are computed from the pedotransfer functions of Horn and Fleige (2003) at pF 1.8 and 2.5 and classified into 6 categories ranging from very low Pc (< 30 kPa) to extremely high Pc (> 150 kPa). The computation requires the knowledge of pedological (texture, organic content), mechanical (bulk density, cohesion, internal friction angle), and hydraulic variables (water content available, non-available water content, air capacity, saturated hydraulic conductivity). These variables are obtained from databases like HYPRES or AARDEWERK or from pedotransfer functions. The computation of Pc takes into account the spatial structure of the data: in some cases, data are abundant (e.g. texture data) and spatial variability is taken into account through geostatistical methods. In other cases, the data is sparse but uncertainty information can be extracted from the knowledge of the statistical distribution. Maps of the most probable Pc class are produced. Uncertainty is computed as the classification error probability. Implementation of these methods in Wallonia showed that Pc values higher than 120 kPa are reached either on 64 % of the territory at pF 2.5 or on 55 % at pF 1.8. A higher uncertainty was found at pF 2.5 than at pF 1.8. Uncertainty was also found higher for clay and clayed loess than for other textural classes present in Wallonia.
The risk of compaction is defined as the probability that Pc is exceeded by the stress created by a load applied to the soil at a depth of 40 cm, the loads being similar to those induced by agricultural or forestry tires. It appeared that subsoil compaction risks exist mainly in loamy forest soils with small coarse fragments supporting loads similar to that existing on logging machines.
In the zones where the uncertainty is low, the developed tool could be used as a basis for providing policy measures in order to promote soil-friendly farming and forest practices.
Keywords:
Soil compaction ; preconsolidation stress ; risk assessment ; uncertainty ; pedotransfer function
1. Introduction
Compaction concerns agricultural and forestry crops and results from the passage of heavy machines on sensitive soils, mainly during harvest operations and harvest transport. The detrimental effects of soil compaction on the crop production have been reported in many studies on both agricultural and forest soils (Hakansson and Reeder, 1994; Hamza and Anderson, 2005; Greacen and Sands, 1980; Goutal, 2012). Compaction causes a decrease in porosity and an increase in soil strength that may restrict root growth and affect the density and diversity of soil mesofauna and bacterial communities (Soane and van Ouwerkerke, 1995; Batey and McKenzie, 2006; Frey et al., 2009, Lipiec et al., 2012). Soil compaction not only reduces crop and forest production, but has also negative environmental effects (Jones et al., 2003). Indeed, saturated hydraulic conductivity is reduced, increasing the risk of runoff of water and pollutants towards surface waters, and the movement of nitrate and pesticides into ground waters. The volume of soil available to act as a buffer for pollutants is reduced. The risk of soil erosion increases through the presence of excess water above compacted layers. Because of the reduction of soil aeration, production of greenhouse gases through denitrification may occur by anaerobic processes (Jarvis, 2007; Hoefer, 2010).
Considering the detrimental effects of soil compaction, the proposal of the EU Commission for a Soil Framework Directive mentions soil compaction as one of the major threats to a sustained quality of soils in Europe (COM, 2006). The compaction of the subsoil, defined as ‘subsurface soil material that lies below the normal cultivation depth or pedological A horizon’, is particularly problematic since it is difficult and expensive to alleviate (Hakansson and Reeder, 1994; Spoor et al., 2003). Subsoil compaction risks are increasing with growth in farm size, increased mechanisation and equipment size, and the drive for greater productivity (Jones et al., 2003).
In analysing soil compaction, a distinction has to be made between the susceptibility of soils to compaction and their vulnerability. Susceptibility is the likelihood that compaction occurs if subjected to factors that are known to cause compaction (Louwagie et al., 2009). Susceptibility to compaction depends on quasi-permanent characteristics such as texture and
carbon content and on short-term changing characteristics such as soil moisture condition. It ranges from sand (least susceptible) – loamy sand – sandy loam – loam – clayed loam – loamy clay to clay soils (Woods et al., 1944, cited by Louwagie et al., 2009). Medium- and fine-textured loam and clay soils are resistant to mechanical pressure at low water contents but they are highly susceptible to severe compaction at high water contents (Horn et al., 1995).
The soil's vulnerability to a given threat is determined taking into account the inherent soil susceptibility and an exposure estimate based on an evaluation of the stresses inflicted by land management and climate (Troldborg et al., 2013). Jones et al. (2003) propose a simple classification system for subsoil vulnerability to compaction using a two-stage process. First, the inherent susceptibility of the soil to compaction is estimated on the basis of the relatively stable soil properties, such as soil texture, nature of clay, bulk density, organic matter content, structure, soil moisture content and soil moisture potential. Second, the susceptibility class is converted into a vulnerability class through consideration of the likely soil moisture status at
the time of critical loadings. The authors conclude that some improvements could be brought to the method, including namely the use of pedotransfer functions. Another method for estimating the soil’s vulnerability or the risks of soils being further compacted is obtained by comparing calculated soil strengths with vertical stresses created by a given wheel. The soil strength is usually expressed by the precompression stresses evaluated from pedotransfer functions (van den Akker, 2004, Horn and Fleige, 2003). More recently, Troldborg et al.
(2013) developed Bayesian Belief Networks for assessing the risk of soil compaction, allowing the combination of available data from standard soil surveys and land use databases with qualitative expert knowledge.
In order to face the challenge of the Soil Framework Directive, if implemented, the Governments of the European Union wish to identify areas of risk and develop relevant policy measures suited to provide soil-friendly farming practices. The report of the SoCo (Sustainable Agriculture and Soil Conservation) project presents a European map of natural soil susceptibility to compaction (Louwagie et al., 2009). Based on soil properties, it gives an idea of the geographic spread of compaction susceptibility. Unfortunately, this map does not provide sufficiently accurate information to determine the extent of actual and potential problems at a regional scale and to bring responses to the regions in Europe who have been asked to develop environmental plans.
In Wallonia (South of Belgium), political discussion on the problem of compaction is namely taken into account by the Walloon Forest Code which is in application since 13th September 2008 (Décret relatif au Code forestier wallon, 2008) and prohibits explicitly damages on the ground that could have long-term consequences on the forests vitality. Wallonia occupies around 17 000 km². Forest areas represent 530 600 ha while agricultural areas represent 756 000 ha. Forest soils are mainly Cambisols, while agricultural soils are mainly Luvisols. The aim of the paper is thus to develop a methodology that would be suitable to help the policy-makers in order to limit soil compaction. The methodology concerns the subsoil (40 cm depth) because compaction in this horizon is generally considered as particularly serious because of its persistence. As far as possible, the methodology should involve the use of existing databases. The main challenge concerns the structure of the information. In some cases, the information is abundant while in other cases, there is a lack of data. At the same time, the uncertainties relative to the data and to the modelling process have to be taken into account and their contributions in terms of overall uncertainty on the results have to be quantified.
2. Material and methods
The methodology comprises two stages. Firstly, the susceptibility of soils to compaction is assessed by computing the soil strength, this latter being expressed by the precompression stress (Pc). Secondly, the vulnerability of soils is analysed by computing the vertical stresses created in the soils by a load similar to that applied by a wheel and comparing it to the precompression stress.
2.1.
Soils susceptibility
Soil compaction is conveniently defined by the precompression stress (Pc): loading of a soil will cause compaction only if a certain level of stress called ‘precompression stress’ is exceeded (Dexter, 1988; Lebert and Horn, 1991; Horn et al., 1994). When soil is subjected to stress smaller than Pc, it deforms and recovers elastically along the recompression curve. However, at stresses greater than the Pc, the soil deformation is irreversible.
2.1.1. Pedotransfer functions of Horn and Fleige (2003)
Pc is usually measured in laboratory conditions by confined uniaxial compression tests (oedometer tests). As measurement of precompression stresses is a long and tedious task, attempts have been made to evaluate them by pedotransfer functions (PTF). According to
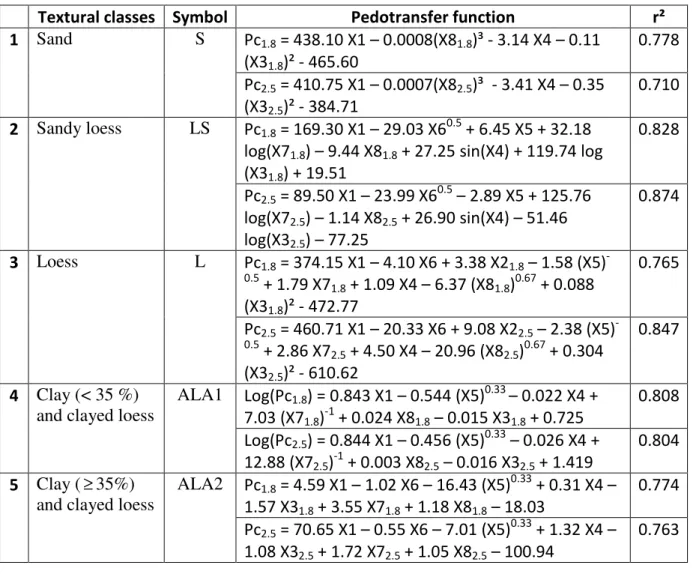
Horn and Fleige (2003), Pc can be predicted by multiple regression analysis for 5 different textural groups based on the German soil texture classification (Table 1). A high degree of significance can be obtained when the shear parameters angle of internal friction and cohesion are included as independent variables.
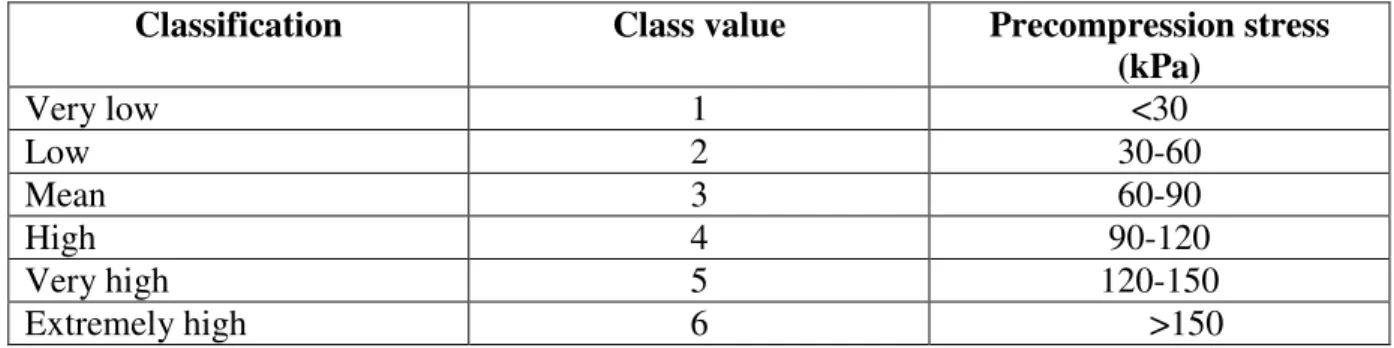
The five PTFs are derived on basis of 20-year measurements of physical and mechanical properties of 39 typical, differently textured and structured agricultural soils in Bavaria. The equations use mechanical variables (bulk density, cohesion, and angle of internal friction), hydraulic variables (air capacity, available and non-available water capacity, saturated hydraulic conductivity) and organic matter content as independent variables. They are established for two water potentials, pF= 1.8 (h = -63 cm or -6.2 kPa) and 2.5 (h = -316 cm or -31 kPa), which indicates the strong relationship between the soil suction and the precompression stress. Horn and Fleige (2003) consider that these equations are applicable for organic matter contents between 0 and 15 %. Furthermore, they suggest the classification of the precompression stress values in 6 categories (Table 2). The soils with low values of Pc may be considered as highly sensitive to compaction. The effect of coarse fragments (> 2 mm) on the precompression stress is considered by applying a surcharge coefficient.
Table 1. Pedotransfer functions to calculate the precompression stress for different soil textures at pF 1.8 and 2.5 (Horn & Fleige, 2003).
Textural classes Symbol Pedotransfer function r²
1 Sand S Pc1.8 = 438.10 X1 – 0.0008(X81.8)³ - 3.14 X4 – 0.11 (X31.8)² - 465.60 0.778 Pc2.5 = 410.75 X1 – 0.0007(X82.5)³ - 3.41 X4 – 0.35 (X32.5)² - 384.71 0.710 2 Sandy loess LS Pc1.8 = 169.30 X1 – 29.03 X6 0.5 + 6.45 X5 + 32.18 log(X71.8) – 9.44 X81.8 + 27.25 sin(X4) + 119.74 log
(X31.8) + 19.51 0.828 Pc2.5 = 89.50 X1 – 23.99 X60.5 – 2.89 X5 + 125.76 log(X72.5) – 1.14 X82.5 + 26.90 sin(X4) – 51.46 log(X32.5) – 77.25 0.874 3 Loess L Pc1.8 = 374.15 X1 – 4.10 X6 + 3.38 X21.8 – 1.58 (X5) -0.5 + 1.79 X71.8 + 1.09 X4 – 6.37 (X81.8) 0.67 + 0.088 (X31.8)² - 472.77 0.765 Pc2.5 = 460.71 X1 – 20.33 X6 + 9.08 X22.5 – 2.38 (X5) -0.5 + 2.86 X72.5 + 4.50 X4 – 20.96 (X82.5)0.67 + 0.304 (X32.5)² - 610.62 0.847 4 Clay (< 35 %) and clayed loess
ALA1 Log(Pc1.8) = 0.843 X1 – 0.544 (X5)0.33 – 0.022 X4 + 7.03 (X71.8)-1 + 0.024 X81.8 – 0.015 X31.8 + 0.725 0.808 Log(Pc2.5) = 0.844 X1 – 0.456 (X5) 0.33 – 0.026 X4 + 12.88 (X72.5) -1 + 0.003 X82.5 – 0.016 X32.5 + 1.419 0.804 5 Clay ( ≥ 35%)
and clayed loess
ALA2 Pc1.8 = 4.59 X1 – 1.02 X6 – 16.43 (X5) 0.33 + 0.31 X4 – 1.57 X31.8 + 3.55 X71.8 + 1.18 X81.8 – 18.03 0.774 Pc2.5 = 70.65 X1 – 0.55 X6 – 7.01 (X5)0.33 + 1.32 X4 – 1.08 X32.5 + 1.72 X72.5 + 1.05 X82.5 – 100.94 0.763 ܺଵ = ߛௗ : bulk density (g/cm³) ;
ܺଶ = ܿ : air capacity (v/v ; %) ; ܺଷ = ߠ : available water (v/v ; %) ; ܺସ = ߠ : non available water (v/v ; %) ;
ܺହ = ܭ௦ : saturated hydraulic conductivity (cm s-1)103 ; ܺ = ܯܱ : total organic content (g/g ; %) ;
ܺ = ܿ : cohesion (kPa) ;
଼ܺ = ∅ : internal friction angle (degrees) ;
ܲܿ : precompression stress, pF 1.8 or 2.5 kPa (kPa).
Table 2. Classification of the precompression stress (Horn and Fleige, 2003).
Classification Class value Precompression stress
(kPa) Very low 1 <30 Low 2 30-60 Mean 3 60-90 High 4 90-120 Very high 5 120-150 Extremely high 6 >150
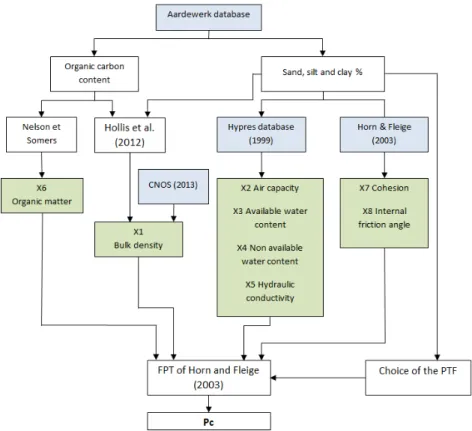
Figure 1 offers a synthetic view of the Pc computation flowchart. The databases are identified in blue and the variables X1 to X8 are in the green frames. Those can be classified in two
groups:
- variables depending on the soil texture (right part of Figure 1): hydraulic variables (air capacity, available water content, non-available water content, hydraulic conductivity) and mechanical variables (bulk density, cohesion and internal friction angle),
- variables that are function of the total organic carbon (left part of Figure 1): bulk density and internal organic content.
To obtain these variables, databases including soil properties and PTFs are necessary. They are presented respectively at points 2.1.2 and 2.1.4. As the databases are based on different soil classifications, the textural triangles related to each database are presented (see point 2.1.3).
Figure 1. Flowchart of computation of the precompression stress.
2.1.2. Databases
The computation of the PTFs of Horn and Fleige (2003) at the regional scale was based by making use of four databases:
1. AARDEWERK (Van Orshoven et al., 1988) is the Belgian soil profile description database from which 5364 soil profile descriptions were extracted. It was used with two purposes: (i) to select the suited PTF and (ii) to furnish the soil granulometry and the soil organic carbon content.
2. HYPRES (Hydraulic Properties of European Soils) is a European database classifying the hydraulic characteristics of European soils in five mineral textural classes for the topsoil and subsoil, and an organic class (Wösten et al., 1999, 2000).
3. Tables of cohesion and internal friction angle at pF 1.8 and 2.5 for various texture and structures were provided by Horn and Fleige (2003).
4. Land use map of Wallonia (Carte Numérique d’Occupation des Sols de Wallonie, CNOS, 2013) was used to separate cultivated soils from forest soils.
In all cases, information concerning the subsoil, considered as the horizon located between 40 and 60 cm, was retained.
2.1.3. Textural classifications
In the flowchart of Figure 1 and in the databases structure, three different textural classifications are involved:
- The German classification is required for the choice of the function PTF of Horn and Fleige (2003). It is based on loess percentages for soil particles lying between 2 µm and 63 µm. The classification involves 5 classes: S, L, LS, AL1, and AL2.
- The FAO classification involved in the HYPRES database is necessary to select the water retention curve and to derive hydraulic parameters. Loess is here defined as the fraction between 2 and 50 µm. It comprises 5 classes: Coarse, Medium, Medium Fine, Fine, Very Fine.
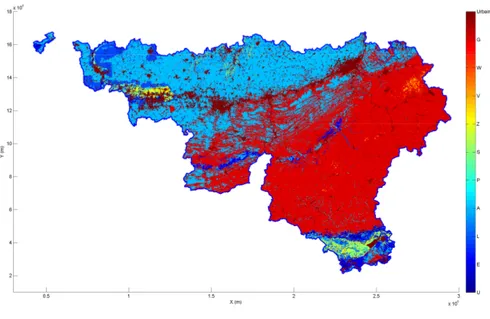
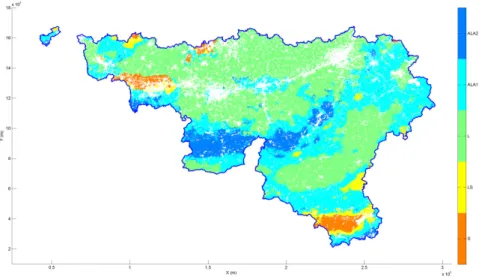
- In the Belgian classification, the textural limits are the same as in the FAO classification. 7 soil classes, Z, S, P, L, A, E, and U with lesser than 5 % of stones are involved. Furthermore, G corresponds to stony loess with more than 5 % stones and W corresponds to peat zones. Urban zones are also included. The classes are represented in Digital Soil Map of Wallonia (CNSW, Carte Numérique des Sols de Wallonie, 2013) (Figure 2). As it may be seen, a large proportion of soils belongs to class G. In the implementation of the PTFs of Horn and Fleige (2003), the initial Belgian soil classification has to be transposed in the German and in the FAO classifications. This implies to take into account the different limits between soils particles (between German and Belgian and FAO limits). As the limits for classifying loess are different in Belgian and German classification, a linear interpolation was performed to convert the loess and sand Belgian percentages in German percentages. Other interpolation methods could be used (loglinear, splines,…), but the gained accuracy was found negligible and would have require a computation time not required in this application.
Figure 2. Classification of Walloon soils obtained from Digital Soil Map of Wallonia (CNSW Carte Numérique des Sols de Wallonie, 2013).
Another problem arises from consideration of classes ALA1 in the German textural triangle and A and L in the Belgian one. When computing Pc for soils located at the limits of German classes ALA1 and L, a discontinuity occurs according the use of PTF 3 or 4. Consequently, to avoid abrupt jumps in mapping Pc, the German classification was slightly changed with the
aim that the limits between classes L, ALA1, and ALA2 correspond to the boundaries of the Belgian classification between classes A, L, and E: the initial limit value for clay of 17 % was set to 17.5 %. Concretely, the area corresponding to German class L was enlarged to include more loamy soils. Figure 3 gives the superposition of the three used textural triangles. Once this step is performed, the relationships between the PTFs of Horn and Fleige (2003) and the Belgian soil texture classes can be established.
Figure 3. Superposition of the three used textural triangles: red: Belgian triangle, blue: modified German triangle, green: FAO triangle.
2.1.4. Estimation of the organic content
Considering that organic matter (OM) is composed of 58 % of total organic carbon (TOC) (Nelson et Somers, 1996), its content is estimated by:
TOC OM =1.724×
The percentage of TOC is available in the AARDEWERK database.
2.1.5. Estimation of bulk density
Sensitivity analyses show that most of the PFTs given in Table 1 present a high sensitivity to the bulk density (BD), highlighting the importance of estimating BD using an appropriate FPT. Therefore, the recent PTFs of Hollis et al. (2012) were used (Table 3). The differentiation between the three types of subsoil horizons was performed taking into account the landuse and the presence of gleyfied horizon. The first information is extracted from the CNOS database and the second from the AARDEWERK database.
Table 3. Pedotransfer functions for estimation of bulk density (Hollis et al., 2012). TOC is the total organic content, Depth is the depth of the middle of the considered horizon (40 cm), s is the percentage of sand content, c is the percentage of clay content.
Horizons Pedotransfer functions
Compacted horizons
(
)
(
TOC)
(
(
Depth)
) (
s)
BD=1.1257− 0.1140245ln % + 0.0555ln + 0.002248 Mineral horizons(
)
(
Exp TOC) (
s) (
c BD=0.69794+ 0.750636 −0.230355 % + 0.0008687 − 0.0005164 Cultivated horizons(
(
)
) (
) (
)
c s TOC Exp BD=0.80806+ 0.823844 −0.27993 % + 0.0014065 − 0.00102992.1.6. Estimation of the hydraulic variables
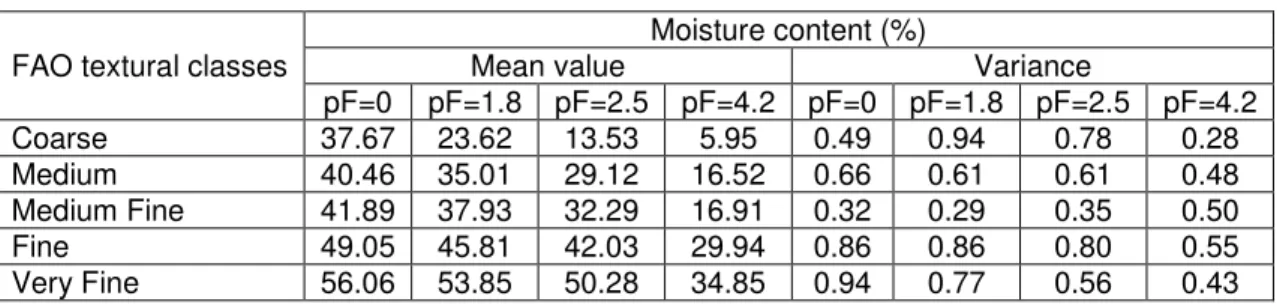
The mean values and standard deviations of the soil moisture content (SMC) corresponding to four characteristic pF values (0, 1.8, 2.5 and 4.2) are given in the HYPRES database (Table 4).
Table 4. Soil moisture content according to the FAO textural classes.
FAO textural classes
Moisture content (%)
Mean value Variance
pF=0 pF=1.8 pF=2.5 pF=4.2 pF=0 pF=1.8 pF=2.5 pF=4.2 Coarse 37.67 23.62 13.53 5.95 0.49 0.94 0.78 0.28 Medium 40.46 35.01 29.12 16.52 0.66 0.61 0.61 0.48 Medium Fine 41.89 37.93 32.29 16.91 0.32 0.29 0.35 0.50 Fine 49.05 45.81 42.03 29.94 0.86 0.86 0.80 0.55 Very Fine 56.06 53.85 50.28 34.85 0.94 0.77 0.56 0.43
The non-available water θna (= X4) is the soil moisture content where most plants cannot exert
enough force to remove water from small pores in the soil and correspond to the wilting point (pF = 4.2): 2 . 4 pF a n =θ = θ (1) The available water θa (= X3) is the water available for growing crops. It was computed as the
difference between water content at field capacity θfc (pF = 1.8 and 2.5) and permanent
wilting point (pF = 4.2):
θa =θfc −θpF=4.2 (2) The air capacity cair (= X2) is the difference between the water content at saturation θs (pF =
0) and water content at field capacity θfc (pF = 1.8 and 2.5):
fc 0 pF a
c =θ = −θ (3) Equations (2) and (3) were computed taking into account two values of field capacities, pF 2.5 or 1.8.
2.1.7. Estimation of cohesion and internal friction angle
The cohesion and the internal friction are given by Horn and Fleige (2003) at two suction values (pF = 1.8 and 2.5) for German soil textural classes, having various structures. The values given for the German textural soil classes were transformed to take into account the Belgian textural limits. Concerning the effect of the soil structure on the cohesion and internal friction, the less favourable value was chosen (‘worst case’).
2.1.8. Measurements
Measurements were performed on four sites chosen as being representative of agricultural and forest soils. They have the objective to identify trends and are not designed to validate the PTFs and databases in an extensive manner. Indeed, the evaluation of the accuracy of the PTFs would imply to use extensive measurement campaigns on data sets representative of all textural classes which falls beyond the scope of this study.
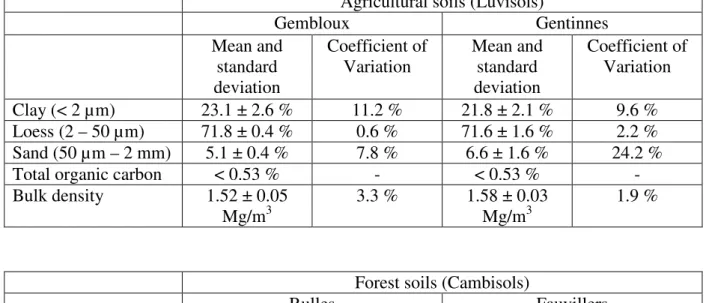
Two sites (Gentinnes 50°34’N, 4°35’W; Gembloux 50°33’N, 4°42’W) located in textural class A of the Belgian classification are agricultural soils with conventional tillage, while two other sites (Rulles 49°72’N, 5°55’W; Fauvillers 49°88’N; 5°70’W) belonging to the textural class L are forest soils with Fagus sylvatica as dominant species. A brief description of the soil properties is shown in Table 5.
Table 5. Soil properties at 40 cm depth of the experimental sites.
Agricultural soils (Luvisols)
Gembloux Gentinnes Mean and standard deviation Coefficient of Variation Mean and standard deviation Coefficient of Variation Clay (< 2 µm) 23.1 ± 2.6 % 11.2 % 21.8 ± 2.1 % 9.6 % Loess (2 – 50 µm) 71.8 ± 0.4 % 0.6 % 71.6 ± 1.6 % 2.2 % Sand (50 µm – 2 mm) 5.1 ± 0.4 % 7.8 % 6.6 ± 1.6 % 24.2 %
Total organic carbon < 0.53 % - < 0.53 % -
Bulk density 1.52 ± 0.05 Mg/m3
3.3 % 1.58 ± 0.03 Mg/m3
1.9 %
Forest soils (Cambisols)
Rulles Fauvillers Mean and standard deviation Coefficient of Variation Mean and standard deviation Coefficient of Variation Clay (< 2 µm) 13.1 ± 6.5 % 50.0 % 22.3 ± 3.8 % 17.0 % Loess (2 – 50 µm) 65.2 ± 5.8 % 8.9 % 46.7 ± 0.6 % 1.3 % Sand (50 µm – 2 mm) 21.7 ± 1.6 % 7.4 % 29.0 ± 4.0 % 13.8 %
Bulk density 1.38 ± 0.04 Mg/m3
2.9 % 1.42 ± 0.09 Mg/m3
6.3 %
In each site, three straight racks of 10 m length and 5 m wide were selected for the experiments. In each rack, soil samples were taken at 40 cm depth in autumn. Undisturbed samples (φ = 7 cm, h = 2 cm) were taken for measuring dry bulk density, water content, precompression stress, and soil water retention curve (SWRC) with four repetitions. Four samples were taken for measuring granulometry and organic carbon content. The saturated hydraulic conductivity, the cohesion and internal friction angles were not measured. From the SWRC, non-available water θna, available water θa, and air capacity cair were computed
according to Equations (1) to (3).
Pc was measured in laboratory conditions by confined uniaxial compression tests. An automatic multistep oedometer (VJTechnology, type Acons) under drained condition was used, with pressures of 7.87, 15.75, 31.25, 62.5, 125, 250, 500 and 1000 kPa applied for 10 min each (Horn and Fleige, 2009). The Pc value was determined according to the graphic determination (Casagrande, 1936). As Pc decreases with increasing water content (WC), following procedure was employed to obtain normalized values independent of the WC. Pc was measured at the WC of the soil at the moment of the tests on half of the soil samples. The second part of the samples was saturated and new measurements of Pc were performed. Assuming a linear relationship of Pc versus the suction (Alonso et al., 1990), Pc could be computed at two values of water potentials: pF = 1.8 and 2.5.
2.1.9. Methodology of cartography of soil susceptibility
In the data structure, two cases have to be distinguished. In the first case, such as hydraulic variables derived from the HYPRES database and mechanical variables extracted from the database of Horn and Fleige (2003), the spatial information is limited or even not available. In this case, statistical distributions of values are taken into account and the values to be used in the computation of Pc are determined by a Monte Carlo procedure. This consists in calculating the deterministic results (realizations) for a large number of random draws from the individual distribution functions of input data. The advantage of Monte Carlo analysis is its general applicability and that it does not impose many assumptions on probability distributions and correlations and that it can be linked to any model. The key limitation is the large run times (Refsgaard et al., 2007). Hence, a Gaussian distribution is assumed for hydraulic variables, an empirical distribution for saturated hydraulic conductivity, and a uniform distribution for cohesion and internal friction angle. As quantitative relationships between the hydraulic variables and the mechanical variables are not available, the realizations were drawn independently. As cohesion and internal friction angle are physically dependent on the water content, it is thus possible that some realizations use incoherent sets of data. However, the occurrence of this situation is deemed limited.
In the second case, the data are abundant and spatial coordinates are available. This is the case for texture and organic content data which are available at a spatial resolution of 1 km2. Their spatial distribution is not completely random but structured according to various factors like elevation, slope, parent material, etc. The correlation between the values observed at two distinct locations is known to be a function of their separation distance. This is the key concept of geostatistics, where the spatial correlation is quantified by the variogram and
valorised by estimation methods, like kriging, and simulation methods, like sequential Gaussian simulation (Goovaerts, 1997; Chiles and Delfiner, 2012).
Especially, the simulation of the three textural fractions (sand, loess and clay) is a complex problem since the sum of the three fractions has to be equal to 100 on each grid point and the classification should correspond to the CNSW information. The method of Maximum Bayesian Entropy permits to solve both problems (Christakos, 2000; Bogaert and D'Or, 2002; D'Or, 2003). However, the implementation of this method is prohibitive at the regional scale. Consequently, a more simple method was used, comprising the following steps:
1. Estimation of the regional tendency for each textural fraction using a mobile window mean with a radius of 10 km, at each point of the AARDEWERK database and each grid point.
2. Computation of the residuals as the difference between the AARDEWERK data and the regional tendency.
3. Transformation of the residuals with the normal scores method in order to obtain Gaussian variables (Goovaerts, 1997).
4. Variogram estimation and modelling on the transformed residuals.
5. Independent sequential Gaussian simulations on the residuals for each textural fraction.
6. Inverse normal score transformation of the simulated values.
7. Addition of the regional tendency to the back-transformed simulated values. 8. Affectation of 0 to negative values and of 100 to values higher than 100.
9. Normalisation of the three textural fractions to ensure that the sum is equal to 100. Afterwards, the textural fractions were classified according to the German and FAO classifications to produce textural classes.
Similarly, steps 1 to 7 were used to simulate the total organic content.
To produce precompression stress maps, two strategies may be used. In the first case, the PTFs of Horn and Fleige (2003) are computed at each point where data are available and an interpolation is performed at the nodes of a regular grid laid over the Walloon Region. In the second case, each input variable is interpolated on the regular grid before applying the adequate PTF. This last strategy is chosen since it permits to better take advantage of the spatial structure of the variables (Heuvelink and Pebesma, 1999). It implies to produce a map of each variable for each realization, the number of them being chosen equal to 100. All the results are presented on a grid with a square 100 x 100 m mesh. It comprises 2700 meshes along x-axis and 1700 meshes along y-axis, corresponding to a total value of 4 590 000 meshes, 1 686 282 of them being located within the limits of Wallonia.
When stones are present as indicated by the CNSW texture class G, a surcharge coefficient is applied to the computation of Pc according to Horn and Fleige (2003). Peat and urban zones were discarded as the PTFs are not applicable in these zones. These zones appear in white on the maps.
2.2.
Soils vulnerability
The vulnerability of soils or the risks of compaction are the threat of adverse effects on crop production and on environment caused by inappropriate land management, such as vehicles loads applied in unfavourable conditions, too many livestock for a given field size, … In this
paper, it was estimated that a risk of compaction exists if the vertical stress created by a wheel of agricultural or forest machine was higher than the precompression stress.
Vertical stresses were simulated by using a mechanistic model, based on the Boussinesq equations for stress propagation. It comprised three steps, according to the Terranimo® model (Terramechanical model) (Stettler et al., 2010):
1. estimation of the shape of contact area, considered as a super ellipse, whose parameters are given by Keller et al. (2005);
2. computation of the stress distribution between the soil and the tire. The stress distribution is considered as the product of a power function in the travel direction by an exponential function in the transversal direction. The parameters of these distributions are given by Schjønning et al. (2008);
3. propagation of the vertical stresses in the soil, based on the equations of Boussinesq (1885) and Frölich (1934), modified by Söhne (1957) and parametrised by Keller (2005). The vertical stresses σz were considered at 40 cm depth.
Some hypotheses were used in this procedure. The first one, and probably the strongest, consists in assuming the soil to be homogeneous. This means that the effect of a possible no-compacted layer, such as a plough pan, was not considered. Secondly, the tire was supposed to be static, the transmission of stress due to the vehicle speed would necessitate the consideration of the rheologic behavior of the soil and was not envisaged.
The comparison between and Pc and σz was performed at all points of the map for each
realization and the risk was computed from following equation:
(
)
∑
= > σ = 100 1 k c z k P I R (4) where Ik is an indicator variable: Ik = 1 if σz >Pc; Ik = 0 if σz <Pc.Several scenarios were taken into account, including agricultural tires equipping tractors and harvesters and forest tires equipping forwarders and skidders. In each case, two humidity contents were taken into account: pF 1.8 and pF 2.5. As the compaction increases logarithmically with the number of passages (Brais and Camiré, 1998), the compaction risk created by the passage of one tire was considered as a good indicator of soil vulnerability.
3. Results
3.1.
Measurements analysis
On the experimental sites, as expected, the measurements performed at 40 cm depth revealed significant variability (Table 5). The soil texture variability was characterized by high values of the coefficient of variation (CV) of clay and sand contents in all sites, and high CV of loess content in forest sites. Bulk density (BD) was higher in agricultural soils than in forest soils. Overall, the variability of BD was small, excepted for one forest site (Fauvillers).
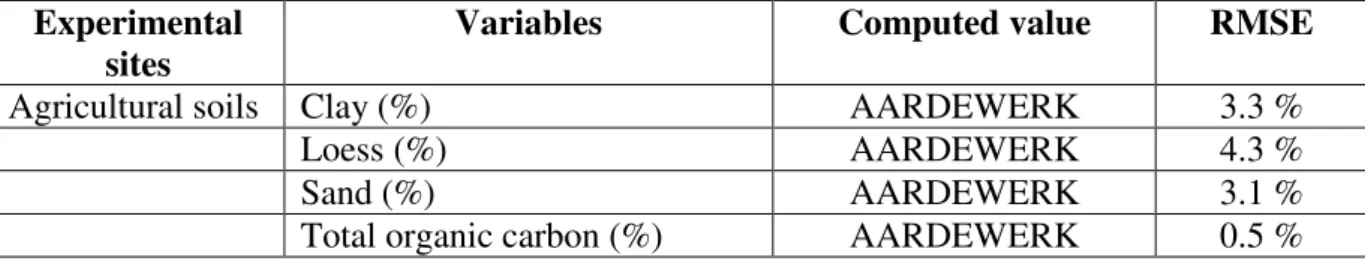
The measured values were compared to the values issued from the databases and computed by the PTFs by using root mean square error (RMSE) (Table 6) which has general expression:
(
)
∑
− = N 2 x xˆ N 1 RMSE (5) where N is the number of datapoints, xˆ and x are the estimated and measured variables respectively.For the two agricultural sites, the correspondence between the measured values of clay, loess and sand and those provided by AARDEWERK was acceptable. However, the measured clay contents were higher of 2 to 5 % than the AARDEWERK values, which conducted to different PTFs choice (respectively ALA1 or L, Table 1). The measured BD was in accordance with the value computed with the PTF of Hollis et al. (2012). The agreement was good between the hydraulic variables, the difference between the measured and computed values being the highest for the available water at pF 1.8. The precompression stress was computed using PTFs 3 and 4, respectively adapted for loess (L) and clay and clayed loess (ALA1). By using PTF 3, the mean computed values of (Pc)pF1.8 and (Pc)pF2.5 were
respectively 115 kPa (class 4 in Table 2) and 144 kPa (class 5 in Table 2). The RMSE were equal to 18 kPa and 38 kPa and the relative errors were 16 % and 26 %, respectively at pF 1.8 and 2.5. By using PTF 4, the computed values of (Pc)pF1.8 and (Pc)pF2.5 were higher than 150
kPa (class 6 in Table 2) which was not in agreement with the measured values. This showed that the use of PTFs for calculating Pc requires the accurate evaluation of the clay content since there is no continuity between PTF 3 and PTF 4 as a function of the clay content. For the two forest sites, CV of the loess and sand were higher than the values obtained for agricultural sites. In the hydraulic variables, the difference between the measured and computed values was the highest for the available water at pF 1.8, as in the agricultural sites. BD was underestimated by the PTFs because of the high values measured at Fauvillers. Concerning the precompression stress, the mean computed values of (Pc)pF1.8 and (Pc)pF2.5
were respectively 54 kPa (class 2 in Table 2) and 69 kPa (class 3 in Table 2), with a RMSE equal to 18 kPa in both cases, corresponding to a relative error of 33 % and 26 % at pF 1.8 and 2.5. Taking into account the presence of coarse fragments in the soil, a surcharge was applied to the precompression stress and the final classes of these forest soils were 3 and 4 respectively at pF 1.8 and 2.5.
For both sites, the error in the estimate of Pc was thus higher at pF 2.5 than 1.8. Overall, the measurements highlights the difficulties encountered in applying FPTs based on statistical regressions to specific situations with high variability. In the present case, where the produced estimates do not differ systematically from observations, it can be deemed that the chosen PTFs are suited. However, it would be interesting to go further in checking their adequacy by collecting measurements in a wider lot of situations.
Table 6. Root Mean Square Error
Experimental sites
Variables Computed value RMSE
Agricultural soils Clay (%) AARDEWERK 3.3 %
Loess (%) AARDEWERK 4.3 %
Sand (%) AARDEWERK 3.1 %
Non-available water HYPRES 2.5 %
Available water – pF 1.8 HYPRES 6.3 %
Air capacity – pF 1.8 HYPRES 1.1 %
Available water – pF 2.5 HYPRES 3.0 %
Air capacity – pF 2.5 HYPRES 3.5 %
Bulk density Hollis et al. (2012) 0.01 Mg/m3
Precompression stress – pF 1.8 Horn and Fleige (2003) 18 kPa Precompression stress – pF 2.5 Horn and Fleige (2003) 38 kPa
Forest soils Clay (%) AARDEWERK 2.7 %
Loess (%) AARDEWERK 9.3 %
Sand (%) AARDEWERK 8.2 %
Total organic carbon (%) AARDEWERK 0.8 %
Non-available water HYPRES 4.4 %
Available water – pF 1.8 HYPRES 8.6 %
Air capacity – pF 1.8 HYPRES 1.2 %
Available water – pF 2.5 HYPRES 2.1 %
Air capacity – pF 2.5 HYPRES 3.6 %
Bulk density Hollis et al. (2012) 0.32 Mg/m3
Precompression stress – pF 1.8 Horn and Fleige (2003) 18 kPa Precompression stress – pF 2.5 Horn and Fleige (2003) 18 kPa
3.2.
Cartography
For the sake of concision, the results focus on several maps: the textural fractions and organic matter content since implementation of the method described in 2.1.8 involves particular complexity, the bulk density which is a sensitive variable, the precompression stress which defines the soil susceptibility to compaction, and finally the risk maps.
3.2.1. Textural data
The variograms of the transformed residuals of the textural fractions (sand, loess, and clay) are presented in Figure 4. The parameters of the adjusted models are given in Table 7. The models are involving a nugget effect and an exponential structure with a range of 5000 m. The relatively large nugget effect (55 to 70% of the total variance) may be explained by the fact that an important part of the spatial structure has already been captured by the moving window average.
The German and FAO texture classes computed on the average fractions over 100 realizations are represented in Figure 5. The main represented soils are loess (L) in the North of the Region and in the central part of the Arden, followed by AL1 and ALA2.
According to the FAO classification, the major part of Wallonia has soils with medium or medium fine texture. With medium texture, the mean value of the SMC at pF 1.8 and 2.5 is respectively equal to 35 and 29 %. With medium fine texture, these characteristic values of SMC are respectively equal to 38 and 32 %.
Figure 4. Variogram of the transformed residuals of the textural fractions ((a) sand; (b)loess; (c)clay). Points: experimental variograms; line: modelled variograms.
Table 7. Modelled variograms with γγγγ(h), the semi-variance, h is the lag, Nug is the nugget effect and Exp, the exponential structure.
Fraction Model
Sand
γ
( )
h =0.5575Nug( )
0 +0.3595Exp(
5000)
Loess
γ
( )
h =0.6624Nug( )
0 +0.3166Exp(
5000)
Figure 5. Maps of the texture classes computed on the average texture fractions over 100 realizations: German classification (above) and FAO classification (below).
3.2.2.
Organic matter content
Modelled variograms used to compute the organic matter content show also a nugget effect and an exponential structure :
( )
h =0.6492Nug( )
0 +0.3784Exp(
3047.8)
γ (5)
where γ(h) is the semi-variance, h is the lag, Nug is the nugget effect and Exp, the exponential structure.
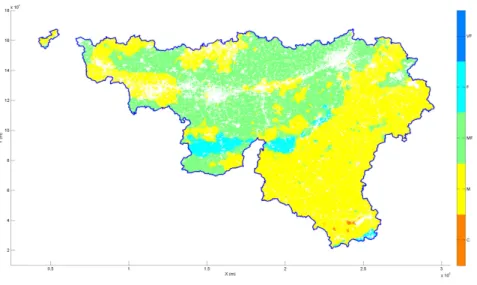
The average organic content over 100 realizations on the whole Region is given in Figure 6. The higher content appears in the central part of the Arden which is mainly occupied by forests.
Figure 6. Map of the average organic content over 100 realizations (Units: %).
3.2.3.
Bulk density
Figure 7 presents the map of bulk density computed by using the equations presented in Table 3. Bulk density range from 0.83 and 1.84 Mg/m³ with 95% comprised between 1.35 and 1.62 Mg/m³. Considering the histogram given in Figure 8, two populations were identified in the subsoil: horizons of cultivated soils with BD around 1.55 Mg/m³ and mineral horizons with BD around 1.35 Mg/m³. Compacted or gleyified subsoil horizons represented only a minor fraction of the soils in Wallonia.
Figure 7. Map of the average bulk density over 100 realizations (Units: g/cm³).
Figure 8. Histogramm of the bulk density.
3.2.4.
Precompression stress
Pc was computed according to flowchart of Figure 1 and descriptive statistics are given in Table 8. Some negative values (less than 1 % of points) appeared in areas of texture G, also characterized by high contents of total organic content (TOC > 1.4 %). These values were simply reset to 0. Very high values (> 300 kPa) were also noticed, they were basically categorized into ALA1. This resulted from the fact that Equation 4 in Table 2 used to calculate Pc for ALA1 class involves an exponential and is therefore particularly sensitive to small changes in the variables.
Table 8. Statistics of computed precompression stress (Q = quantile).
Statistics pF 1.8 pF 2.5
Number of data 1401684 1401684
Mean value (kPa) 103.57 109.68
Standard deviation (kPa) 39.72 39.30
Variation coefficient (%) 38 36
Minimum value (kPa) -235.84 -641.15
Q0.025 (kPa) 45.48 24.36 Q0.050 (kPa) 55.71 40.92 Q0.100 (kPa) 64.32 60.16 Q0.250 (kPa) 73.97 85.90 Q0.500 (kPa) 94.90 109.04 Q0.750 (kPa) 126.60 141.39 Q0.900 (kPa) 142.20 157.06 Q0.950 (kPa) 159.80 166.09 Q0.975(kPa) 212.02 175.17
Maximum value (kPa) 327.89 269.89
To map the precompression stress, the modal class of Pc over the 100 realizations was computed (Figure 9). At each simulation grid node, the modal Pc class is the most frequent class among the 100 realizations. This method was chosen rather the computation of mean and standard deviations in order to reduce the influence of extreme values of Pc.
Figure 9. Maps of the modal class of precompression stress; above, pF 1.8, below, pF 2.5 (1 = very low, 2 = low, 3 = mean, 4 = High; 5 = very high, 6 = extremely high).
Precompression stress varies from very low values (class 1, Pc < 30 kPa) to very high values (class 6, Pc > 150 kPa). At pF 2.5, Pc is higher than 120 kPa and belongs to class 5 or 6 in 64 % of the territory. At pF 1.8, values higher than 120 kPa corresponding to classes 5 and 6 are encountered only on 55 % of the territory. For both values of pF, classes 1 and 2 correspond to very low and low values of Pc. These classes are observed in loess soils without coarse fragments, in the central part of the Arden. This area presents thus high soil compaction susceptibility. In this forest region with medium texture soils, the soil moisture corresponding to pF 1.8 and 2.5 is respectively around 35 and 29 % (Table 4). The soil susceptibility to compaction is thus high when these conditions are encountered, mainly in autumn and winter. As mechanized logging with heavy machines is usually performed in this period, the probability of inducing soil compaction would be high in this region (see point 3.3).
To analyse the uncertainties, firstly, the histograms of the standard deviations of the raw simulated values of Pc computed at each grid node were expressed as a function of the texture classes (Figure 10). The higher values of standard deviations were obtained for pF 2.5 compared to pF 1.8. Especially at pF 2.5, high values were reached for ALA1 area for which PTF 4 was used. In this particular case, it is questionable whether the pedotransfer function is applicable to the soils of Wallonia.
Figure 10. Histograms of standard deviations of Pc, pF 1.8 (left) and 2.5 (right). Color codes: 1= S, 2=LS, 3=L, 4=ALA1, 5=ALA2.
Secondly, the uncertainty at the regional scale was expressed by the classification error probability E, computed at each grid node as:
m
P 1
E= − (6) where Pm is the probability of the modal class.
The maps of Figure 11 show that higher values of E occur at pF 2.5 than at pF 1.8, thus for dryer soils. In other words, when the soil is wet, the uncertainty is smaller and limited to 0.6, excepted in punctual zones and in Gaume (very South part of Wallonia).
Concerning management, four situations may be distinguished (Table 9). With low uncertainty, management rules are needed if Pc is low and unnecessary if Pc is high. At the contrary, in presence of high uncertainty, management rules may be too restrictive if Pc is low and too lax if Pc is high. Taking the central part of Arden as an example, at pF 2.5 (SMC equal to 29 %), the major part of the area belongs to Pc class 1 corresponding to high compaction susceptibility which suggests management tools. However, the probability of error is comprised between 0.5 to 0.8, meaning that management tools would be potentially too restrictive. Considering the same region at pF 1.8 (SMC equal to 35 %), it appears that the region is spread within classes 1 to 3 with a probability of error comprised between 0.4 and 0.5. The confidence in classifying the region in very low to moderate Pc classes is thus better.
Figure 11. Probability of classification error. Above, pF 1.8, below, pF 2.5.
Table 9. Uncertainty and Pc values.
Uncertainty
Low High
Low values of Pc Management rules are needed
Management rules are potentially too restrictive High values of Pc No need of management
rules
Management rules are potentially too lax
3.3.
Soil vulnerability
According to the concept of precompression stress, Pc values can be used as a threshold value to avoid subsoil compaction. The compaction risk was defined as the risk that exists if the
vertical stress created by a wheel of agricultural or forest machine is higher than the precompression stress in the subsoil.
Figure 12 to 15 Erreur ! Source du renvoi introuvable. present the maps of risks of subsoil compaction for the four following scenarios:
1. An agricultural tire equipping a tractor, with a load of 4440 kg at 1 bar
2. An agricultural tire, equipping a harvesting machine, with a load of 6300 kg at 1.2 bar 3. A forest tire equipping a forwarder, with a load of 10000 kg at 3.1 bars
4. A forest tire equipping a grapple skidder, with a load of 5450 kg at 5.5 bars. In the agricultural zones, a mask was put on the non-relevant forest zones and vice versa. To simplify the legibility of the maps, threshold values of the probability risk were fixed: lower than 10 % (green color), higher than 90 % (red color) and comprised between these limits (blue color).
With agricultural scenarios 1 and 2 (Figure 12 and 13Erreur ! Source du renvoi
introuvable.), the risk of exceeding Pc at 90 % is very low, intermediate situations where the
risk is comprised between 10 and 90 % being higher with scenario 2. In further studies, the uncertainty related to the intermediate areas could be reduced by considering a whole vehicle, or successive passages of a given vehicle.
With forest scenarios 3 and 4 (Figure 14 and 15Erreur ! Source du renvoi introuvable.), the risk of exceeding Pc at 90 % is clearly high, especially in the central part of Arden, whatever the pF and the water content. In these zones, it is highly probable that soil stresses caused by heavy machines such as skidders or forwarder will exceed the stability limit and result in further soil compaction.
Figure 12. Maps of risks of subsoil compaction, pF 1.8 (above) and pF 2.5 (below). Scenario 1: tyre equipping a tractor, load = 4440 kg, 1 bar. Green: compaction risk lower than 10 %; red: compaction risk higher than 90 %; blue: intermediate risk.
Figure 13. Maps of risks of subsoil compaction, pF 1.8 (above) and pF 2.5 (below). Scenario 2: tyre equipping a harvesting machine, load = 6300 kg, 1.2 bar. Green: compaction risk lower than 10 %; red: compaction risk higher than 90 %; blue: intermediate risk.
Figure 14. Maps of risks of subsoil compaction, pF 1.8 (above) and pF 2.5 (below). Scenario 3: forest tyre equipping a forwarder, load = 10000 kg, 3.1 bar. Green: compaction risk lower than 10 %; red: compaction risk higher than 90 %; blue: intermediate risk.
Figure 15. Maps of risks of subsoil compaction, pF 1.8 (above) and pF 2.5 (below). Scenario 4: forest tyre equipping grapple skidder, load of 5450 kg, 5.5 bars. Green: compaction risk lower than 10 %; red: compaction risk higher than 90 %; blue: intermediate risk.
4. Discussion
The proposed methodology provides estimates of the modal class of Pc (1 to 6) and the compaction risk at regional scale. As acquiring direct Pc measurements is prohibitive in time and costs, there is a need for a model able to valorise already existing data. Of course, the accuracy of the results depends on the quality of those data. The level of accuracy of the estimations can be discussed at the light of two types of error, namely, random and systematic errors.
The computation of modal class Pc implies the knowledge of several variables provided by databases or PTFs. From the measurements performed in four agricultural and forest sites, it appeared that the used PTFs can produce acceptable values on average but are not reliable for taking into account site-specific variability. This is an upscaling problem consisting in relating small-scale properties measured at the laboratory scale to larger scale represented by the numerical grid of the model (Romano, 2004). For example, measured Pc has a higher variability than Pc modelled by PTFs because it is function of soil tillage systems (i.e. conventional or conservation tillage), cultivation history (i.e. existence of old meadow), and stress history (i.e. over-consolidated zones due to repeated passages of machines) (Hanquet et al., 2004). As a consequence, interpolation of the cartographic results to estimate the precompression stress or the compaction risk at the parcel level cannot be performed as it would lead to random errors.
To analyse the systematic errors, two main problems are identified. Firstly the choice of the PTF for computing Pc may be crucial since, in some cases, the soil’s texture class is located at the frontier between two functions and there exists no continuity between them. Consequently, the accuracy of the texture class is important since it governs the choice of the PTF. Secondly, it appears that the use of PTF 4 (clay and clayed loess) leads to high values of Pc that are not encountered in conditions of Wallonia. The validity of this PFT is thus questionable in Wallonia.
The reliability of the spatial data involved in the PTFs is also concerned. Simple sensitivity analyses show that most of the PTFs used to compute Pc present a high sensitivity versus the bulk density and a low sensitivity to the saturated hydraulic conductivity. Accurate knowledge of BD is thus necessary and it would be important to validate the PTFs of Hollis et al. (2012) at least in forest soils and, if necessary, to propose other PTFs more adapted to the Walloon forest soils. Cohesion and internal friction angle also play an important role in the calculation of FPTs of Pc. Collection of these mechanical variables for the soils of Wallonia would also be helpful.
The uncertainty in the estimation of Pc is given by the classification error probability on its modal class. Overall, the uncertainty is high, which means that management rules may be too restrictive if Pc is low and too lax if Pc is high. In further studies, reduction of the uncertainty could be obtained by more precise information on cohesion, which would restrict the ranges of its variation in the model. The use of complementary information provided by soil surveys such as the drainage capacity information could also be considered.
The compaction risks were defined as the probability that the precompression stress (Pc) is lower than the stress resulting from the passage of a wheel, at 40 cm depth. The calculation of these latter is based on the assumptions that the soil is elastic, homogeneous and isotropic. In
reality, this is not the case and, as an example, the presence of a plough pan in conventional tillage could act as a resistant layer which modifies the stress propagation. Furthermore, the computed stresses are static values although the loads are applied during short duration. In some situations (such as agricultural soils), the uncertainty is high and could be reduced by considering a whole vehicle instead of a wheel or successive passages of a given vehicle.
5. Conclusion
The basis of management tool for assessing soil compaction were developed and applied to Wallonia (Belgium). This tool evaluated the susceptibility of subsoil compaction at a regional scale by estimating the modal class of precompression stress (Pc) on basis of the pedotransfer functions (PTFs) of Horn and Fleige (2003). The uncertainty was quantified by estimating the classification error probability on the modal class. Simulations showed that uncertainty was higher at pF 2.5 than at pF 1.8. Uncertainty was also found higher for clay and clayed loess than for other textural classes of Wallonia. For these soils, the uncertainty could be reduced by establishing a new PTF better adapted to make reliable estimates of Pc. The risk of compaction was evaluated by estimating the probability that vertical stresses in the subsoil exceed Pc. It appeared that compaction risks existed mainly in loamy forest soils with small amount of coarse fragments. These soils are characterized by a relative low bulk density and a relative high content of organic matter. In these situations, the passage of heavy vehicles such as forest logging machines would probably conduct to exceed the soil stability limit and cause long term subsoil compaction.
The developed tool has been designed to be flexible and has the ability to include newly acquired knowledge. It presents the interest of delineating zones according to the uncertainty on Pc. Where the uncertainty is low, the tool could be used as a basis for providing relevant policy measures in order to promote soil-friendly farming and forest practices.
Ackowledgments
This work was funded by the SPW (Service Public de Wallonie), DGARNE (Direction générale opérationnelle de l’Agriculture, des Ressources naturelles et de l’Environnement).
References
- Alonso, E., Gens, A., Josa, A. 1990. A constitutive model for partially saturated soils, Géotechnique 40 (3): 405-490.
- Batey, T., McKenzie, M. 2006. Soil compaction: identification directly in the field. Soil Use and Management 22(2), 123-131.
- Bogaert, P., D’Or, D., 2002. Estimating soil properties from thematic soil maps: the Bayesian Maximum Entropy Approach. Soil Sci. Soc. Am. J., 66(5), 1492-1500.
- Boussinesq, J. 1885. Application des potentiels à l’étude de l’équilibre et du mouvement des solides élastiques. Gauthier-Villars, Paris, 30 pp.
Brais, S., Camiré, C., 1998. Soil compaction induced by careful logging in the claybelt region of northwestern Quebec (Canada). Can. J. Soil Sci. 78, 197-206.
- Casagrande, A., 1936. The determination of preconsolidation load and its practical significance. In: Proceedings of the 1st International Conference on Soil Mechanics and Foundation Engineering, vol. 3, Cambridge, 60–64.
- Chilès, J.-P., Delfiner, P. 2012. Geostatistics : modeling spatial uncertainty. Wiley, Second Edition.
- Christakos, G. 2000. Modern spatiotemporal geostatistics. Oxford University Press, New York.
- COM, 2006. 232 final (http://ec.europa.eu/environment/soil/pdf/com_2006_0232_en.pdf). - CNOS, Carte Numérique d'Occupation des Sols en Wallonie, 2013,
http://cartopro3.wallonie.be/CIGALE/viewer.htm?APPNAME=COSW - CNSW, Carte Numérique des Sols de Wallonie, 2013,
http://cartopro3.wallonie.be/CIGALE/viewer.htm
- Décret relatif au Code forestier wallon, Moniteur Belge du 12.09.2008.
- Dexter, A. 1988. Advances in characterization of soil structure. Soil and Tillage Research 11: 199-238.
- D’Or, D. 2003. Spatial prediction of soil properties, the Bayesian Maximum Entropy Approach. PhD dissertation, Université catholique de Louvain, Faculty of Biological, Agricultural and Environmental Engineering n°28.
- Frey, B., Kremer, J., Rüdt, A., Sciacca, S., Matthies, D., Lüscher P., 2009. Compaction of forest soils with heavy logging machinery affects soil bacterial community structure. European Journal of Soil Biology 45(4), 312-320.
- Fröhlich O.K. 1934. Druckverteilung im Baugrunde. Springer Verlag, Wien, 178 pp. - Greacen, E., Sands, R., 1980. Compaction of Forest soils. A Review. Aust. J. Soil Res. 18,
163-189.
- Goutal, N. 2012. Modifications et restauration de propriétés physiques et chimiques de deux sols forestiers soumis au passage d'un engin d'exploitation. Institut des Sciences et Industries du Vivant et de l’Environnement, Thèse de doctorat, AgroParisTech, 223 p. - Govaerts, P. 1997. Geostatistics for natural resources evaluation, Oxford University Press. - Hakansson, I., Reeder, R.C. 1994. Subsoil Compaction by Vehicles with High Axle Load
Extent, Persistence and Crop Response. Soil and Tillage Research 29, 277-304.
- Hamza, M. A., Anderson, W.K. 2005. Soil compaction in cropping systems - A review of the nature, causes and possible solutions. Soil and Tillage Research 82, 121-145.
- Hanquet, B., Sirjacobs, D., Destain, M.-F., Frankinet, M., & Verbrugge, J.-C. (2004). Analysis of soil variability measured with a soil strength sensor. Precision Agriculture 5(3), 227-246.
- Heuvelink, G., Pebesma, E. 1999. Spatial aggregation and soil process modelling. Geoderma 89, 47-65.
- Hoefer, G. 2010. Subsoil compaction: causes, impact, detection, and prevention. Soil Engineering - Soil Biology 20, 121-145.
- Hollis, J., Hannam, J., Bellamy, P. 2012. Empirically-derived pedotransfer functions for predicting bulk density in European soils. European Journal of Soil Science, 63, 96-109. - Horn, R., Taubner, H., Wuttke, M., Baumgartl, T. 1994. Soil Physical-Properties Related
to Soil-Structure. Soil and Tillage Research 30, 187-216.
- Horn, R, Domzzal, H., Slowinska-Jurkiewicz, A, van Ouwerkerk, C. 1995. Soil compaction processes and their effects on the structure of arable soils and the environment. Soil and Tillage Research 35, 23-36.
- Horn, R., Fleige, H. 2003. A method for assessing the impact of load on mechanical stability and on physical properties of soils. Soil and Tillage Research 73, 89-99.
- Horn, R., Fleige, H. 2009. Risk assessment of subsoil compaction for arable soils in Northwest Germany at farm scale. Soil and Tillage Research 102, 201-208.
- Jarvis, N.J. 2007. A review of non equilibrium water flow and solute transport in soil macropores: principles, controlling factors and consequences for water quality. European Journal of Soil Science 58, 523-546.
- Jones, R., Spoor, G., Thomasson, A.J. 2003. Vulnerability of subsoils in Europe to compaction: a preliminary analysis. Soil and Tillage Research 73, 131-143.
- Keller, T. 2005. A model for the prediction of the contact area and the distribution of vertical stress below agricultural tyres from readily available tyre parameters. Biosystems Engineering 92, 85-96.
- Lebert, M., Horn, L. 1991. A method to predict the mechanical strenght of agricultural soils. Soil and Tillage Research 19, 275-286.
- Lipiec, J., Horn, R., Pietrusiewicz, J., Siczek, A. 2012. Effects of soil compaction on root elongation and anatomy of different cereal plant species. Soil and Tillage Research 121, 74-81.
- Louwagie, G., Gay, S.H., Burrell, A. 2009. Addressing soil degradation in EU agriculture: relevant processes, pratices and policies. Report on the project ‘Sustainable Agriculture and Soil Conservation (SoCo)’.
- Nelson, D., Sommers, L. 1996. Total carbon, organic carbon, and organic matter. In: Methods of Soil Analysis, Part 2, Agronomy, 9, 961-1010. American Society of Agronomy, Inc., Madison, WI.
- Refsgaard, J.C., van der Sluijs,J.P., Højberg,A.L., Vanrolleghem,P.A. 2007. Uncertainty in the environmental modelling process – A framework and guidance. Environmental Modelling & Software 22 (11), 1543–1556.
- Romano, N. 2004. Spatial structure of PTF estimates. In Developments in pedotransfer functions soil hydrology, Pachepsky and Rawls (Eds), Elsevier, ISBN 0 444 51705 7, 295-317.
- Schjønning, P., Lamandé, M., Togersen, F., Arvidsson J., Keller T., 2008. Modelling effects of tyre inflation pressure on the stress distribution near the soil–tyre interface. Biosystems Engineering, 99(1), 119–133.
- Soane, B. D., van Ouwerkerk, C. 1995. Soil compaction problems in World agriculture. In Soil Compaction in Crop Production, Soane and van Ouwerkerke (Eds), Elsevier, ISBN 0-444-88286-3, 1-21.
- Söhne, W. 1957. Fundamentals of pressure distribution and soil compaction under tractor tires. Agricultural Engineering 39, 276-281, 290.
- Spoor, G., Tijkink F., Weisskopf, P. 2003. Subsoil compaction: risk, avoidance, identification and alleviation. Soil and Tillage Research 73, 175-182.
- Stettler M., Keller, T., Schjonning, P., Lamande, M., Lassen, P., Pedersen, J., Weisskopf, P., 2010. TERRANIMO® - A web-based tool for assessment of the risk of soil compaction due to agricultural field traffic. In Proceedings of AgEng 2010, Clermont-Ferrand, Paper 384.
- Troldborg, M., Aalders, I., Towers, W., Hallett, P.D., McKenzie, B.M., Bengough, A.G., Lilly, A., Ball, B.C., Hough, R.L., 2013. Application of Bayesian Belief Networks to quantify and map areas at risk to soil threats: Using soil compaction as an example. Soil and Tillage Research 132, 56-68.
- Van den Akker, J. J. H., 2004. SOCOMO: a soil compaction model to calculate soil stresses and the subsoil carrying capacity. Soil and Tillage Research 79, 113-127.
- Van Orshoven, J., Maes, J., Vereecken, H., Feyen, J., Dudal, R., 1988. A structural database of Belgian soil profile data. Pedologie (Gent) 38, 191-206.
- Wösten, J., Lilly, A., Nemes, A., Le Bas, C. 1999. Development and use of a database of hydraulic properties of European soils. Geoderma 90, 169-185.
- Wösten J.H.M., 2000. The HYPRES database of hydraulic properties of European soils. Advances in Geoecology 32:135-143.