Thorough characterization of a Self-Emulsifying Drug Delivery System with Raman hyperspectral imaging: A case study.
Pierre-Yves Sacréa*, Lauranne Netchacovitcha, Charlotte De Bleyea, Pierre-François Chaveza, Cécile Servaisb, Régis Klinkenbergb, Bruno Streelb, Philippe Huberta, Eric Ziemonsa
a
University of Liege (ULg), Department of Pharmacy, CIRM, Laboratory of Analytical Chemistry, CHU, B36, 4000 Liege, Belgium
b Galephar Research Center M/F, rue du Parc Industriel 39, 6900 Marche en Famenne, Belgium
Abstract
Newly developed drugs often have poor bioavailability due to their poor water solubility (BCS class 2 drugs). It is therefore necessary to develop new strategies to enhance their solubility and their activity, among which, Self-Emulsifying Drug Delivery System (SEDDS). The efficacy of the drugs contained in these preparations is mainly affected by the solid state and the particle size of the active pharmaceutical ingredient (API).
However, it is quite complex, long and expensive to characterize these parameters with classical techniques such as X-Ray powder diffraction, differential scanning calorimetry or hot stage microscopy.
The present article presents, through a case study, the advantages of the Raman hyperspectral imaging in the characterization of such formulations. Indeed, Raman chemical imaging may fully characterize SEDDS with single equipment and operator in a non-destructive way allowing the follow-up of the formulation during stability studies. Raman imaging is therefore a tool of choice in the PAT framework since it increases the knowledge of the formulation and the process.
A quantitative multivariate method using Raman hyperspectral imaging to assay the API in the lipid based formulation has been developed and fully validated following the “total error” approach.
Keywords:
Hyperspectral imaging; Raman spectroscopy; Self-Emulsifying Drug Delivery System; particle size; PAT tool.
*Corresponding Author. Tel.: +32 4 366 4324; Fax: +32 4 366 4317 E-mail address: [email protected]
Address: Laboratory of Analytical Chemistry, CIRM, Department of Pharmacy, University of Liege, 1 Avenue de l’Hôpital, B36, B-4000 Liege, Belgium
1. Introduction
Following the Biopharmaceutical Classification System (BCS), drugs may be characterized according to their membrane permeability and their aqueous solubility (Amidon et al., 1995). Even if the actual tendency is to produce biopharmaceutical active pharmaceutical ingredient (API), the huge majority of new chemical entities (NCE) are little molecules obtained by organic chemistry synthesis. This implies that most NCE show a poor water solubility (Li et al., 2009) and are classified as BCS class 2 (poor solubility and high permeability). However, the main problem with BCS class 2 drugs is that they exhibit relatively poor bioavailability. Several strategies may be used to address this: particle size decrease, polymorphism, amorphous drugs, complexation (with cyclodextrins or surfactants), solid solutions and dispersion, soluble prodrugs and salts (Leuner and Dressman, 2000). Another approach is the use of Self-Emulsifying Drug Delivery System (SEDDS). These liquid or semi-solid formulations are encapsulated into hard or soft capsules and generate an emulsion in the gastrointestinal tract facilitating the absorption of the drug (Mullertz et al., 2010). There exist a large variety of excipients that can be used ranging from non-polar lipids to polar lipids. Pouton et al. (Pouton, 2006) proposed a Lipid Formulation Classification System (LFCS) categorizing the lipid based formulations according to their composition. The LFCS classifies the lipid based formulations as Type I if it is composed exclusively of oils, Type II if it is a mix of oils and water-insoluble surfactants, Type IIIA are the formulations composed of mainly of oils and small proportion of water-soluble surfactant, Type IIIB are composed of a small proportion of oils and a majority of water-soluble surfactants and hydrophilic co-solvents and finally Type IV are composed of a mix of surfactants and co-co-solvents. The studied formulation is categorized as type IV formulation. This type of formulation allows an increased API charge compared to Type I formulations and produces very fine dispersions in an aqueous medium (Mullertz et al., 2010).
The main parameters that influence the activity of such formulations are the solid-state and the particle size of the API. The solid-state is commonly characterized using differential scanning calorimetry (DSC) (Balakrishnan et al., 2009; Craig, 2006; Kang et al., 2012) or X-Ray powder diffraction (XRPD) (Docoslis et al., 2007; Hu et al., 2012; Wei et al., 2012) or vibrational spectroscopy (Milović et al., 2012; Nazzal et al., 2002; Stillhart and Kuentz, 2012). However these techniques are costly and require a highly trained user (for XRPD) and are destructive (for DSC).
Particle size analysis of lipid based formulations is a hard task since particles are formed during the cooling of the melt API/excipients matrix. So, it must be performed on the semi-solid dosage form after manufacturing. Therefore some researchers rather analyze the particle size of the produced emulsion in an aqueous medium (Agarwal et al., 2009; Ali et al., 2008). However, this is not applicable as quality control of a commercial formulation. Microscopic analysis with scanning or transmission electronic microscopes (SEM or TEM) may also be used (Balakrishnan et al., 2009; Yi et al., 2008a, 2008b; Zhang et al., 2012). But once again it is costly, require highly trained users and it can only be used to see very small surfaces making representativity of the sampling a very big issue. Optical hot stage microscopy (possibly with polarized light) may also be used if the particle size is large enough (Bikiaris et al., 2005; Sprunk et al., 2012). But this technique has many drawbacks such as temperature degradation, polymorphism conversion but most of all the melt down of the smallest particles in the matrix making only possible the observation of the biggest particles.
Another technique that can be used to characterize both polymorphic state and particle size of the API is the Raman hyperspectral imaging. This technique combines the information obtained by Raman spectroscopy with spatial information.
Three configurations of Raman hyperspectral imaging systems exist: point mapping, line scanning and global imaging. The point scanning mode is by far the most used configuration. It consists of recording a spectrum at a specific spatial location, then the sample moves, another spectrum is recorded at an adjacent location and so on until the whole mapping area is covered. The line scanning mode records the spectra of a complete line of the sampled area simultaneously which fastens the analysis. Finally, in the global imaging configuration, the whole sample is illuminated and the intensity of a fixed number of wavenumbers is recorded returning a complete image of the sample for each wavenumber. In this case, the spatial resolution is limited by the number of pixels of the detector (Sacré et al., 2014a). In the present study, each imaging system worked in the point mapping mode.
Raman spectroscopy allows to characterize the solid-state of pharmaceutical powders (Brittain, 2009; Simone et al., 2014) but also to obtain quantitative information of an API (Breitkreitz et al., 2013) and because of the low wavelength laser used (visible to NIR light), it may provide high resolution (~1µm) images (Adar et al., 2006).
It is therefore possible with a single technique to obtain both solid-state, quantitative and particle size information of a sample. Raman hyperspectral imaging is surely the technique of choice for the characterization of solid dispersions and among them SEDDS.
In the present study, we developed and validated a quantitative method based on hyperspectral Raman imaging to quantify a BCS 2 API in a lipid based formulation. To the author’s best knowledge, it is the first time that a hyperspectral imaging quantitative method has been fully validated using the “total error” approach.
Moreover, two formulations were produced, one with the API totally dissolved in the matrix and a second one with 70% of the API dissolved in the matrix and 30% added as bulk powder. The second formulation mimics a bad processed medicine and Raman hyperspectral imaging has been used to characterize both formulations.
2. Experimental 2.1. Samples
The studied formulation consists of a BCS 2 API dispersed in a lipid matrix at a concentration of 28% (w/w). The excipient part is composed of lauroyl macrogol-32 glycerides (>50%), hydroxypropyl cellulose, macrogol 20000, sodium starch glycolate and ascorbyl palmitate by order of importance.
The API and excipients were kindly donated by Galephar M/F. 2.1.1. Validation
Calibration and validation samples were prepared at 50, 75, 100, 125 and 150% of the target API concentration. Only the ratio API/excipients was changed keeping the ratio between excipients constant. For each concentration level, three independent series were realized with three replicates per series.
The samples were prepared by dispersing the melt API in the melt excipients. Once dispersed, the mix is cooled to room temperature and three small cylindrical samples (1 cm of diameter and 0.5 cm high) are deposited on a microscope slide constituting a series. Samples were then milled with a Leica EM Rapid milling system equipped with a tungsten carbide miller (Leica Microsystems GmbH, Wetzlar, Germany) to prepare their surface for Raman imaging experiments.
2.1.2. Industrial samples
The validated quantitative method was applied on industrial samples. Three samples per batch and three different batches (517811J, 12F04, 11I19) were analyzed. The semi-solid samples were taken out of the hard capsules and a sagittal cut was performed before milling.
Once mapped, samples were analyzed by HPLC. 2.1.3. Samples for the case study
Two preparations were compared and fully characterized using Raman imaging:
Preparation 1: 100% of the API has been dissolved in the melted excipients. This preparation corresponds to an industrial batch without manufacturing issue.
Preparation 2: 70% of the API has been dissolved in the melted excipients and the remaining 30% were added as crystalline bulk powder to the solidified cooled preparation. This preparation mimics an industrial batch that encountered issues during process.
2.2. Reference method 2.2.1. Chemicals
Methanol HPLC grade was purchased from J.T. Baker (Deventer,Netherlands). Water was purified by a Millipore system (18.2 MΩ/cm resistivity, Milli-Q) before filtration through a 0.22 µm Millipore Millipak®– 40 disposable filter units (MilliporeCorporation, USA).
2.2.2. Instrument and chromatographic conditions
The HPLC experiments were performed on an Alliance 2690 HPLC system (Waters, Milford, USA) coupled to a 2996 PDA detector (Waters). Data acquisition and treatment were realized with the Empower 2.0 software (Waters).
The analysis was carried out with a LiChrospher® 100 RP-8 column (125 × 4 mm, 5 μm; Merck, Darmstad, Germany) kept at 35°C. Mobile phase consisted of a mixture of MeOH and water (80:20, v/v).
The HPLC system was operated at isocratic mode during 8 min at a flow rate of 0.8 mL min-1 and the injected volume was 30 µL. UV detection was performed at 288 nm.
2.2.3. Sample preparation
All dilutions were performed in a mixture of water and MeOH (1:1, v/v) except for the first step performed in 100% MeOH.
Calibration standards were obtained by successive dilutions of a stock solution of 40 mg of API in 100.0 mL MeOH to reach the final concentrations of 40, 60, 80, 100 and 120 µg mL-1. Analysed samples were prepared by diluting 282 mg of semi-solid preparation (~80 mg of API at the 100% level) in 100.0 mL MeOH. This solution is sonicated for 15 minutes at 45°C, cooled to room temperature and then diluted to reach the final concentration of 80 µg mL-1 (at the 100% level).
Samples concentrations are back-calculated using the linear regression model as response function.
2.3. Dissolution studies
Dissolution of the two case study preparations (see 2.1.3.) was performed with a paddle apparatus (European pharmacopoeia apparatus 2). Dissolution profiles were constructed with the mean dissolution values from six dissolution baths for each preparation. Test samples consisted of 675 mg of each preparation. Baths were heated at 37°C, dissolution medium consisted of pH 5.5 phosphate buffer with 3% m/v tween 80 and 0.32% m/v pepsine and the stirring speed was of 100 rpm. Five millilitres aliquots were collected from the 900 mL
dissolution bath after 30, 60, 90, 120, 150 and 180 minutes. These aliquots were then analyzed by HPLC.
2.4. Raman hyperspectral imaging analyses 2.4.1. Quantitative analyses
Raman hyperspectral images were collected with a dispersive Raman spectrometer RamanStation 400F (Perkin Elmer, MA, USA) equipped with a two-dimensional CCD detector (1024 × 256 pixel sensor). The laser excitation wavelength used was 785 nm with a power of 100 mW.
The measured spectral region was 3050-90 cm-1 and the spectral resolution was equal to 2 cm -1
. One accumulation with a 1 second exposure time was performed per sample mapping point. The distance between 2 consecutives mapping measurements was fixed at 200 µm. Background acquisition during mapping was repeated each 20 minutes. The spectra were collected with the Spectrum 6.3.2.0151 (Perkin Elmer) software.
The samples used for the calibration and validation of the quantitative model were mapped over an area of 6 x 6 mm² (squares of 30 x 30 pixels).
Industrial samples were mapped over an area of 7.6 x 5 mm² (rectangles of 38 x 25 pixels). Case study samples were mapped over an area of 12 x 12 mm² (squares of 60 x 60 pixels).
2.4.2. Microscopic analyses
Microscopic imaging analyses of the case study preparations were performed with a Labram HR Evolution (Horiba scientific) equipped with a two-dimensional Newton 970 front-illuminated EMCCD detector (1600 × 200 pixel sensor) (Andor Technology Ltd.), a Leica 50x Fluotar LWD objective and a 785 nm laser with a power of 45mW (XTRA II single frequence diode laser, Toptica Photonics AG).
A 300 gr/mm grating fixed at 1200 cm-1 (464–1853 cm-1) was used to perform the mappings with a single acquisition of 0.1 sec (SWIFT ™ mode). The confocal slit-hole was fixed at 200 µm. A binning factor of 2 and an electron multiplying gain of 150 were applied. The spectra were collected with the LabSpec 6 (Horiba Scientific) software.
One medium resolution mapping of 2500x2500 μm² was performed per preparation with a pixel size of 10x10 μm² (spatial resolution of ~10μm, square mapping of 250 x 250 pixels). Three high resolution mappings of 100x100 μm² were performed per preparation with a pixel size of 0.5x0.5 μm² (resolution of ~1μm, square mapping of 200 x 200 pixels).
2.5. Data processing
Once acquired, the hyperspectral images were unfolded and the spectra were baseline corrected using the Asymmetric Least Squares (AsLS) (Eilers, 2003) algorithm with a λ value of 105 and a p value of 10-3. After baseline correction, cosmic rays have been removed with the algorithm developed by Sabin et al. (Sabin et al., 2012) with a k value of 15.
The region of interest selection performed with the mapping of the case study samples has been performed with the “htmaskingroipoly” function of the Hypertools toolbox (Amigo, 2010; Vidal and Amigo, 2012).
All computations were realized with Matlab R2013a (version 8.1, The Matworks, Natick, MA, USA).
2.5.1. Quantitative model
with the SIMPLS algorithm (de Jong, 1993) using the PLS Toolbox 7.8 (Eigenvector Research, Wenatchee, WA, USA). Several other approaches were envisaged (median spectrum, ten highest correlated to median spectrum …) but these approaches gave worse or comparable results and were then abandoned.
The constituted calibration set was standard normal variate (SNV) and mean center corrected before building the model.
A random sample selection cross-validation was performed (10 splits and 10 iterations) to select the number of latent variables to keep. The best model was obtained keeping 2 latent variables with a root mean squared error of cross-validation (RMSECV) of 2.57 %.
The validation samples mappings were then analyzed with the PLS model and the mean predicted concentration of each map was used to validate the model.
This method has been validated using the “total error” approach in accordance with the validation requirements in the ICH Q2 R1 norm (Hubert et al., 2008, 2007a, 2007b, 2004). The validation of the assay method has been performed between 50-150% of the target value. Validation protocol consisted of one operator, one instrument, three replicates per series and three series. Acceptance limits were set at +/- 10% and the β-expectation tolerance intervals were computed at a probability β of 95%. All validation calculations were performed with E-noval® version 3.0 (Arlenda S.A., Liege, Belgium).
2.5.2. Particle size analysis
Medium and high resolution mappings of case study samples were baseline corrected by AsLS (λ value of 105
analyzed by multivariate curve analysis – alternating least squares (MCR-ALS) (Jaumot et al., 2005) with two components and with a non-negativity constraint on the spectra and concentration resolution.
The resolved concentration map of the API is then binarized and the particles size estimated. The particle size analysis has been performed using Image J version 1.47v (Schneider et al., 2012).
3. Results and discussion
3.1. Quantitative method validation
The quantitative regression PLS model has been fully validated within the +/- 10% acceptance limits. The classical +/- 5% acceptance limits for the assay of pharmaceutical specialties were not achievable because of sampling issues. Indeed, only a small slice of the sample is mapped and the representativity of the sample is directly linked to the homogeneity of it.
Figure 1: Accuracy profile obtained from the PLS regression model. The solid line is the relative bias, the dashed lines are the 95% β-expectation tolerance limits and the dotted lines represent the
Table 1 collects the values of trueness (relative bias), precision (repeatability and intermediate precision) and accuracy (relative β-expectation tolerance limits) obtained during the validation process. These information may be put together in a single image called accuracy profile (Figure 1) demonstrating that 95% of future results will fall within the +/- 10% acceptance limits.
Table 1: Validation criteria of the developed PLS quantitative method.
As one can see, the profile has a small bias but quite large precision values due to the sampling issue. The computed RMSEP value for the validation set was of 2.41%. The accuracy profile demonstrates that the computation of the sole RMSEP does not provide valuable information of the method accuracy (De Bleye et al., 2012).
It is clear that hyperspectral Raman imaging quantitative performances are fairly inferior compared to a classical HPLC method for solid pharmaceutical preparations. But the main advantage of using a validated quantitative model is to obtain reliable quantitative information at the pixel level and therefore more reliable chemical images. Another advantage is the possibility to obtain reliable constitutional homogeneity information with the statistics of the histogram of the pixel concentration values as shown by Breitkreitz et al. (Breitkreitz et al., 2013). Concentration level (% of target value) Relative bias (%) Repeatability (RSD%) Intermediate precision (RSD %) Relative β-expectation tolerance limits (%) Relative expanded uncertainty (%) 50 0.03 2.42 2.87 [-7.69; 7.75] 6.23 75 -1.13 1.88 1.88 [-5.74; 3.48] 3.97 100 1.69 1.99 2.21 [-4.20; 7.58] 4.77 125 1.40 2.41 1.72 [-5.68; 8.47] 5.85 150 0.54 1.82 1.82 [-3.93; 5.00] 3.85
The developed model was applied on real life industrial samples. Results are shown in Table 2. As one can see, the errors (differences between HPLC and PLS predicted values) are well comprised between the acceptance limits. Beside this quantitative analysis, Raman imaging allows also to obtain information regarding the distributional homogeneity of the API among the sample.
Table 2: Results of the assay of industrial samples by both HPLC and the validated PLS
model. Error are expressed as the difference between the PLS and the HPLC assay results.
Figure 2 shows the distribution map of the API in three industrial samples. Both have a correct API predicted content (98.5%, 100.0% and 104.2% for sample A, B and C respectively) but they exhibit different distribution pattern. In order to obtain an objective value regarding this difference of distribution, the Distributional Homogeneity Index (DHI) approach was used (Sacré et al., 2014b). The smaller and close to 1 the DHI value, the more homogeneous the sample. Sample A, B and C returned DHI values of 3.53, 8.87 and 4.51 respectively (the number of simulations was set to 100). This result confirms that sample B is the less homogeneous followed by sample C and sample A. The process should therefore be investigated in order to solve this issue. This might also help choosing the best process
Batch number Sample number HPLC assay relative concentration (%) Predicted PLS relative concentration (%) Error (%) 517811J 1 98,04 99,69 1,65 2 98,52 96,07 -2,45 3 97,05 93,97 -3,08 12F04 1 99,23 95,61 -3,62 2 100,03 95,41 -4,62 3 99,13 96,28 -2,85 11I19 1 98,04 101,80 3,76 2 98,52 104,17 5,65 3 97,05 99,99 2,94
conditions during formulation development. The DHI values may also be used in a design of experiment as response.
a. b. c.
Figure 2:
a. Distribution map of the API obtained applying the developed PLS regression model on an industrial sample (sample A).
b. Distribution map of the API obtained applying the developed PLS regression model on an industrial sample (sample B).
c. Distribution map of the API obtained applying the developed PLS regression model on an industrial sample (sample C).
3.2. Case Study
After developing and validating the quantitative model, hyperspectral imaging was used to fully characterize a SEDDS formulation. To illustrate this case study, two preparations were realized: one with the API fully dissolved in the lipidic matrix (preparation 1) and another with 70% of the API dissolved and 30% added after cooling of the matrix mimicking a problem in the manufacturing process (preparation 2).
Figure 3 shows the dissolution profiles of both preparations. A difference may be seen since the two curves are parallel. The curve of preparation 2 reaching a maximum of 88.3% of API dissolved after 180 minutes while preparation 1 reaches 99.4% at the same time.
Figure 3: Dissolution profiles obtained for the two case study preparations. Each point is the mean value of six dissolution baths.
Based on these results, three critical parameters such as solid-state, concentration and particle size of the API should be checked. Indeed, it is often expected to be amorphous in order to enhance the API dissolution rate. Figure 4a shows the spectra of the three polymorphic forms of the API while Figure 4b shows the spectra extracted from the mapping experiments. As can be seen, the API in both preparations is under its polymorphic 1 (stable) form denoting its crystalline character. It can therefore be concluded that the API is not molecularly dispersed (solid solution) but is present as small crystalline particles dispersed in the excipient matrix. The mean assay values of preparation 1 and 2 are 101.3% and 101.0% respectively. The difference between both preparations is therefore neither at the solid-state nor concentration level.
a. b.
Figure 4:
a. Reference spectra of the different API polymorphic forms.
b. Extracted API spectra from the mapping analysis of preparations 1 and 2.
However, when looking at the constitutional homogeneity, the relative standard deviation among pixels is of 3.3% and 11.9% for preparation 1 and 2 respectively. This difference is clearly seen when looking at the Figure 5a and b. Preparation 1 has a much more homogenous distribution of pixel concentrations while preparation 2 has very concentrated areas and areas with depletion in API.
a. b.
Figure 5: PLS scores for preparation 1 (a) and 2 (b) obtained with macroscopic mapping of the dosage forms.
These results indicate that the major difference between both preparations is situated at the particle size level. Therefore, higher resolution mappings were realized with a confocal microscope to investigate particle sizes up to 1 µm.
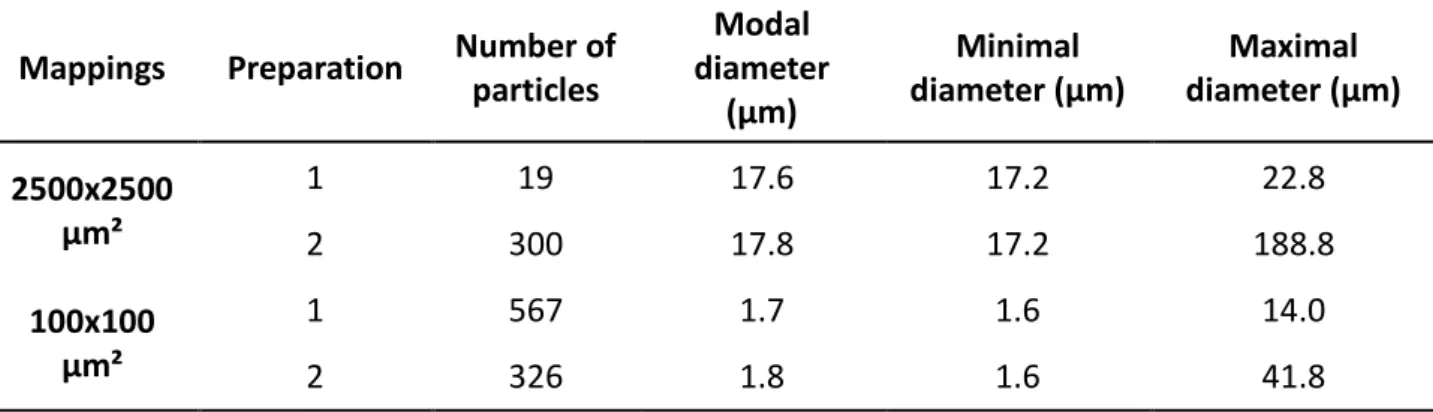
Figures 6 and 7 show the results of the mappings at a medium resolution (pixel size of 10 µm) and high resolution (pixel size of 0.5 µm), respectively. Particles of each mapping have been analyzed and their modal, minimal and maximal diameters of theoretically spherical particles computed. Results are shown in Table 3. Particles of diameter <15 µm and 1.5 µm were discarded from the analysis of the medium and high resolution mappings respectively to only take into account reliable size computations. It may be noticed from Figure 6 that a part of the API is also finely distributed at a sub-micron level.
a. b.
Figure 6: Medium resolution maps of the API obtained by MCR-ALS for the preparation 1 (a) and 2 (b). The pixel size is 10 µm.
a. b. c.
d. e. f.
Figure 7: High resolution maps of the API obtained by MCR-ALS for the preparation 1 (a, b, c) and 2 (d, e, f). The pixel size is 0.5 µm.
Both preparations have approximately the same modal and minimal particle diameter. However, a difference is highlighted in Table 3 regarding the maximal diameter and particularly at the number of particles. Indeed, preparation 1 has a much higher proportion of small particles (567 particles detected in the high resolution mapping versus 19 particles in the medium resolution mapping) than preparation 2 (326 particles detected in the high resolution mapping versus 300 particles in the medium resolution mapping). This confirms that the particle size difference between the two preparations is responsible of the difference in dissolution studies.
Table 3: Number of particles, modal, minimal and maximal diameter of theoretically spherical
particles.
It appears from these results that the control of particle size in the final dosage form could be a good quality control test since it is directly related to the bioavailability of the API and therefore to the activity of the drug.
4. Conclusion
The present article shows for the first time the validation of a quantitative Raman imaging method following the “total error” concept. Due to the sampling representativeness issue, limits of acceptation were set at +/- 10%. The validated quantitative method allowed obtaining reliable quantitative data per pixel and therefore more representative chemical images of the sample.
A case study with the analysis of two preparations (one with the API fully dissolved and another with the API partially dissolved in the lipidic matrix) showed how Raman chemical imaging analysis may help to characterize lipid based formulations of poorly soluble APIs (BCS class 2).
Mappings Preparation Number of particles Modal diameter (µm) Minimal diameter (µm) Maximal diameter (µm) 2500x2500 µm² 1 19 17.6 17.2 22.8 2 300 17.8 17.2 188.8 100x100 µm² 1 567 1.7 1.6 14.0 2 326 1.8 1.6 41.8
Beside these techniques, Raman hyperspectral imaging may be successfully used to fully characterize lipid based formulations. Indeed, with a single equipment, one may obtain quantitative information, know the solid-state form and the particle size distribution of the API in a non-destructive way. This characteristic of Raman spectroscopy is particularly useful for stability studies that can be performed on the same samples all along.
It can therefore be concluded that Raman hyperspectral imaging is the technique of choice for the full characterization of lipid based formulations.
Acknowledgments
A research grant from the Belgium National Fund for Scientific Research (FNRS) to one of us (C. De Bleye) is gratefully acknowledged. Financial supports from the Walloon Region of Belgium are also gratefully acknowledged for the funding of P.-Y. Sacré and L. Netchacovitch with the convention funds of N° 1117469 and N° 1217716 respectively.
References
Adar, F., Lee, E., Mamedov, S., Whitley, A., 2006. Raman Imaging: Defining the Spatial Resolution of the Technology. Spectrosc. Suppl. Raman 38–43.
Agarwal, V., Siddiqui, A., Ali, H., Nazzal, S., 2009. Dissolution and powder flow characterization of solid self-emulsified drug delivery system (SEDDS). Int. J. Pharm. 366, 44–52. doi:10.1016/j.ijpharm.2008.08.046
Ali, H., Nazzal, M., Zaghloul, A.-A.A., Nazzal, S., 2008. Comparison between lipolysis and compendial dissolution as alternative techniques for the in vitro characterization of alpha-tocopherol self-emulsified drug delivery systems (SEDDS). Int. J. Pharm. 352, 104–14. doi:10.1016/j.ijpharm.2007.10.023
Amidon, G., Lennernäs, H., Shah, V., Crison, J., 1995. A theoretical basis for a biopharmaceutic drug classification: the correlation of in vitro drug product dissolution and in vivo bioavailability. Pharm. Res. 12, 413–420.
Amigo, J.M., 2010. Practical issues of hyperspectral imaging analysis of solid dosage forms. Anal Bioanal Chem 398, 93–109. doi:10.1007/s00216-010-3828-z
Balakrishnan, P., Lee, B.-J., Oh, D.H., Kim, J.O., Hong, M.J., Jee, J.-P., Kim, J.A., Yoo, B.K., Woo, J.S., Yong, C.S., Choi, H.-G., 2009. Enhanced oral bioavailability of dexibuprofen by a novel solid Self-emulsifying drug delivery system (SEDDS). Eur. J. Pharm. Biopharm. 72, 539–545. doi:http://dx.doi.org/10.1016/j.ejpb.2009.03.001
Bikiaris, D., Papageorgiou, G.Z., Stergiou, A., Pavlidou, E., Karavas, E., Kanaze, F., Georgarakis, M., 2005. Physicochemical studies on solid dispersions of poorly water-soluble drugs: Evaluation of capabilities and limitations of thermal analysis techniques. Thermochim. Acta 439, 58–67. doi:http://dx.doi.org/10.1016/j.tca.2005.09.011
Breitkreitz, M.C., Sabin, G.P., Polla, G., Poppi, R.J., 2013. Characterization of semi-solid Self-Emulsifying Drug Delivery Systems (SEDDS) of atorvastatin calcium by Raman image spectroscopy and chemometrics. J Pharm Biomed Anal 73, 3–12. doi:10.1016/j.jpba.2012.03.054
Brittain, H., 2009. Vibrational Spectroscopy, in: Brittain, H. (Ed.), Polymorphism in Pharmaceutical Solids. Informa Healthcare, New-York, pp. 347–380.
Craig, D., 2006. Pharmaceutical application of DSC, in: Craig, D., Reading, M. (Eds.), Thermal Analysis of Pharmaceuticals. CRC Press, Boca Raton, pp. 53–96.
De Bleye, C., Chavez, P.F., Mantanus, J., Marini, R., Hubert, P., Rozet, E., Ziemons, E., 2012. Critical review of near-infrared spectroscopic methods validations in pharmaceutical applications. J Pharm Biomed Anal 69, 125–132. doi:10.1016/j.jpba.2012.02.003
De Jong, S., 1993. SIMPLS: An alternative approach to partial least squares regression. Chemom. Intell. Lab. Syst. 18, 251–263. doi:http://dx.doi.org/10.1016/0169-7439(93)85002-X
Docoslis, A., Huszarik, K., Papageorgiou, G., Bikiaris, D., Stergiou, A., Georgarakis, E., 2007. Characterization of the distribution, polymorphism, and stability of nimodipine in its solid dispersions in polyethylene glycol by micro-Raman spectroscopy and powder x-ray diffraction. AAPS J 9, E361–E370. doi:10.1208/aapsj0903043
Eilers, P.H.C., 2003. Parametric Time Warping. Anal Chem 76, 404–411. doi:10.1021/ac034800e
Hu, X., Lin, C., Chen, D., Zhang, J., Liu, Z., Wu, W., Song, H., 2012. Sirolimus solid self-microemulsifying pellets: Formulation development, characterization and bioavailability
evaluation. Int J Pharm 438, 123–133.
doi:http://dx.doi.org/10.1016/j.ijpharm.2012.07.055
Hubert, P., Nguyen-Huu, J.J., Boulanger, B., Chapuzet, E., Chiap, P., Cohen, N., Compagnon, P.A., Dewe, W., Feinberg, M., Lallier, M., Laurentie, M., Mercier, N., Muzard, G., Nivet, C., Valat, L., 2004. Harmonization of strategies for the validation of quantitative analytical procedures. A SFSTP proposal--Part I. J Pharm Biomed Anal 36, 579–586. doi:10.1016/j.jpba.2004.07.027
Hubert, P., Nguyen-Huu, J.J., Boulanger, B., Chapuzet, E., Chiap, P., Cohen, N., Compagnon, P.A., Dewe, W., Feinberg, M., Lallier, M., Laurentie, M., Mercier, N., Muzard, G., Nivet, C., Valat, L., Rozet, E., 2007a. Harmonization of strategies for the validation of quantitative analytical procedures. A SFSTP proposal--part II. J Pharm Biomed Anal 45, 70–81. doi:10.1016/j.jpba.2007.06.013
Hubert, P., Nguyen-Huu, J.J., Boulanger, B., Chapuzet, E., Cohen, N., Compagnon, P.A., Dewe, W., Feinberg, M., Laurentie, M., Mercier, N., Muzard, G., Valat, L., Rozet, E., 2007b. Harmonization of strategies for the validation of quantitative analytical procedures. A SFSTP proposal--part III. J Pharm Biomed Anal 45, 82–96. doi:10.1016/j.jpba.2007.06.032
Hubert, P., Nguyen-Huu, J.J., Boulanger, B., Chapuzet, E., Cohen, N., Compagnon, P.A., Dewe, W., Feinberg, M., Laurentie, M., Mercier, N., Muzard, G., Valat, L., Rozet, E., 2008. Harmonization of strategies for the validation of quantitative analytical procedures: a SFSTP proposal part IV. Examples of application. J Pharm Biomed Anal 48, 760–771. doi:10.1016/j.jpba.2008.07.018
Jaumot, J., Gargallo, R., de Juan, A., Tauler, R., 2005. A graphical user-friendly interface for MCR-ALS: a new tool for multivariate curve resolution in MATLAB. Chemom. Intell. Lab. Syst. 76, 101–110. doi:http://dx.doi.org/10.1016/j.chemolab.2004.12.007
Kang, J.H., Oh, D.H., Oh, Y.-K., Yong, C.S., Choi, H.-G., 2012. Effects of solid carriers on the crystalline properties, dissolution and bioavailability of flurbiprofen in solid self-nanoemulsifying drug delivery system (solid SNEDDS). Eur. J. Pharm. Biopharm. 80, 289–297. doi:http://dx.doi.org/10.1016/j.ejpb.2011.11.005
Leuner, C., Dressman, J., 2000. Improving drug solubility for oral delivery using solid dispersions. Eur. J. Pharm. Biopharm. 50, 47–60. doi:http://dx.doi.org/10.1016/S0939-6411(00)00076-X
Li, P., Hynes, S.R., Haefele, T.F., Pudipeddi, M., Royce, A.E., Serajuddin, A.T.M., 2009. Development of clinical dosage forms for a poorly water-soluble drug II: Formulation and characterization of a novel solid microemulsion preconcentrate system for oral delivery of a poorly water-soluble drug. J Pharm Sci 98, 1750–1764. doi:10.1002/jps.21547
Milović, M., Djuriš, J., Djekić, L., Vasiljević, D., Ibrić, S., 2012. Characterization and evaluation of solid self-microemulsifying drug delivery systems with porous carriers as systems for improved carbamazepine release. Int J Pharm 436, 58–65. doi:http://dx.doi.org/10.1016/j.ijpharm.2012.06.032
Mullertz, A., Ogbonna, A., Ren, S., Rades, T., 2010. New perspectives on lipid and surfactant based drug delivery systems for oral delivery of poorly soluble drugs. J Pharm Pharmacol 62, 1622–1636. doi:10.1111/j.2042-7158.2010.01107.x
Nazzal, S., Smalyukh, I.I., Lavrentovich, O.D., Khan, M.A., 2002. Preparation and in vitro characterization of a eutectic based semisolid self-nanoemulsified drug delivery system (SNEDDS) of ubiquinone: mechanism and progress of emulsion formation. Int J Pharm 235, 247–265. doi:http://dx.doi.org/10.1016/S0378-5173(02)00003-0
Pouton, C.W., 2006. Formulation of poorly water-soluble drugs for oral administration: Physicochemical and physiological issues and the lipid formulation classification system. Eur. J. Pharm. Sci. 29, 278–287. doi:http://dx.doi.org/10.1016/j.ejps.2006.04.016
Sabin, G.P., Souza, A.M. de, Breitkreitz, M.C., Poppi, R.J., 2012. Desenvolvimento de um algoritmo para identificação e correção de spikes em espectroscopia Raman de imagem. Quim. Nova 35, 612–615.
Sacré, P.-Y., De Bleye, C., Chavez, P.-F., Netchacovitch, L., Hubert, P., Ziemons, E., 2014a. Data processing of vibrational chemical imaging for pharmaceutical applications. J. Pharm. Biomed. Anal. 101, 123–140. doi:10.1016/j.jpba.2014.04.012
Sacré, P.-Y., Lebrun, P., Chavez, P.-F., De Bleye, C., Netchacovitch, L., Rozet, E., Klinkenberg, R., Streel, B., Hubert, P., Ziemons, E., 2014b. A new criterion to assess distributional homogeneity in hyperspectral images of solid pharmaceutical dosage forms. Anal. Chim. Acta 818, 7–14. doi:10.1016/j.aca.2014.02.014
Schneider, C.A., Rasband, W.S., Eliceiri, K.W., 2012. NIH Image to ImageJ: 25 years of image analysis. Nat Meth 9, 671–675.
Simone, E., Saleemi, A.N., Nagy, Z.K., 2014. Application of quantitative Raman spectroscopy for the monitoring of polymorphic transformation in crystallization processes using a good calibration practice procedure. Chem. Eng. Res. Des. 92, 594–
Sprunk, A., Strachan, C.J., Graf, A., 2012. Rational formulation development and in vitro assessment of SMEDDS for oral delivery of poorly water soluble drugs. Eur. J. Pharm. Sci. 46, 508–515. doi:http://dx.doi.org/10.1016/j.ejps.2012.04.001
Stillhart, C., Kuentz, M., 2012. Comparison of high-resolution ultrasonic resonator technology and Raman spectroscopy as novel process analytical tools for drug quantification in self-emulsifying drug delivery systems. J. Pharm. Biomed. Anal. 59, 29–37. doi:10.1016/j.jpba.2011.10.018
Vidal, M., Amigo, J.M., 2012. Pre-processing of hyperspectral images. Essential steps before image analysis. Chemom. Intell. Lab. Syst. 117, 138–148. doi:10.1016/j.chemolab.2012.05.009
Wei, Y., Ye, X., Shang, X., Peng, X., Bao, Q., Liu, M., Guo, M., Li, F., 2012. Enhanced oral bioavailability of silybin by a supersaturatable self-emulsifying drug delivery system (S-SEDDS). Colloids Surfaces A Physicochem. Eng. Asp. 396, 22–28. doi:http://dx.doi.org/10.1016/j.colsurfa.2011.12.025
Yi, T., Wan, J., Xu, H., Yang, X., 2008a. Controlled poorly soluble drug release from solid self-microemulsifying formulations with high viscosity hydroxypropylmethylcellulose. Eur. J. Pharm. Sci. 34, 274–280. doi:http://dx.doi.org/10.1016/j.ejps.2008.04.010
Yi, T., Wan, J., Xu, H., Yang, X., 2008b. A new solid self-microemulsifying formulation prepared by spray-drying to improve the oral bioavailability of poorly water soluble
drugs. Eur. J. Pharm. Biopharm. 70, 439–444.
doi:http://dx.doi.org/10.1016/j.ejpb.2008.05.001
Zhang, Y., Wang, R., Wu, J., Shen, Q., 2012. Characterization and evaluation of self-microemulsifying sustained-release pellet formulation of puerarin for oral delivery. Int J Pharm 427, 337–344. doi:http://dx.doi.org/10.1016/j.ijpharm.2012.02.013