UNIVERSITÉ DE MONTRÉAL
STRUCTURAL BEHAVIOUR OF CAST-IN-PLACE AND PRECAST
CONCRETE BARRIERS ANCHORED TO BRIDGE DECK OVERHANGS AND
SUBJECTED TO TRANSVERSE STATIC LOADING
MATTHEW NAMY
DÉPARTEMENT DES GÉNIES CIVIL, GÉOLOGIQUE, ET DES MINES ÉCOLE POLYTECHNIQUE DE MONTRÉAL
MÉMOIRE PRÉSENTÉ EN VUE DE L’OBTENTION DU DIPLÔME DE MAÎTRISE ÈS SCIENCES APPLIQUÉES
(GÉNIE CIVIL) AOÛT 2012
UNIVERSITÉ DE MONTRÉAL
ÉCOLE POLYTECHNIQUE DE MONTRÉAL
Ce mémoire intitulé :
STRUCTURAL BEHAVIOUR OF CAST-IN-PLACE AND PRECAST CONCRETE BARRIERS ANCHORED TO BRIDGE DECK OVERHANGS AND SUBJECTED TO
TRANSVERSE STATIC LOADING
Présenté par : NAMY Matthew
en vue de l’obtention du diplôme de : Maîtrise ès sciences appliquées a été dûment accepté par le jury d’examen constitué de :
M. LÉGER Pierre, Ph. D., président
M. CHARRON Jean-Philippe, Ph. D., membre et directeur de recherche M. MASSICOTTE Bruno, Ph. D., membre et codirecteur de recherche M. MAILHOT Guy, M. Sc., membre
ACKNOWLEDGEMENTS
Throughout my graduate studies I relied on the help and support of my friends, family, and the academic community at Polytechnique Montreal. Without their contribution, I would never have been able to complete my master’s studies.
I would first like to thank my research director, Prof. Jean-Philippe Charron, who supervised each stage of my project in exemplary manner. Prof. Charron’s availability, acute attention to detail, patience, and support, all contributed to the successful completion of my studies. I would also like to thank my co-director, Prof. Bruno Massicotte. In addition to Prof. Massicotte’s personal qualities, his expertise in bridge design and analysis was instrumental during both the experimental and numerical phases of this project. I enjoyed working together with Professor’s Charron and Massicotte, and learned a great deal. I feel very fortunate to have had them as my research directors.
The contribution of the industrial partners, Ciment St. Laurence, Euclid Chemical, the City of Montreal, and Béton Brunet Group, was greatly appreciated. Béton Brunet, in particular, contributed an extensive investment in time, personnel, and energy as they took charge of the production and transportation of all the laboratory specimens. I am very grateful for their help. My research project included an extensive laboratory phase, during which time I relied on the expertise and hard-work of the Polytechnique GRS laboratory team. Lab coordinators, engineers, technicians, and interns all took part in this project. In particular I would like to thank Mr. Cédric Androuët and Mr. Guillaume Cossette each for their substantial contribution to my project. I would also like to thank Joan Hingant for his help as a study abroad student from Strasbourg, France.
There was a great work environment within the Structures Group and I made many friends. As I adapted to graduate studies, Fabien Lagier was always willing to answer my questions and I relied greatly on his advice. Thanks also to Sébastien Delsol who spent many hours helping me in the lab, at Béton Brunet, and with ATENA. Clélia Desmettre was also a great help and friend. Finally, I would like to thank my family. I could always count on their unyielding support and encouragement during my graduate studies.
RÉSUMÉ
Au Canada et aux États-Unis la majorité des nouveaux dispositifs de sécurités des ponts sont faits des parapets de béton coulé en place. Ce genre de parapets répond bien aux critères de performance recherchés pour la sécurité, soit maintenir sur le pont et bien rediriger les véhicules afin d’éviter qu’ils sortent de la chaussée. Cependant, les parapets sont coulés directement sur la dalle déjà durcie, ce qui restreint les déformations dues au retrait et aux variations thermiques. Ceci engendre la formation des fissures au jeune âge qui accélère la dégradation de parapets et diminue leur durabilité. De plus, la construction de parapets coulés en place constitue une étape qui ralentit la mise en service dû aux opérations de pose d’armatures et de mûrissement du béton. Ceci est particulièrement coûteux pour le remplacement de parapets sur les ponts existants. Pour rectifier ces problématiques de durabilité et de vitesse de construction, l’École Polytechnique de Montréal a mis au point des parapets préfabriqués en béton à haute performance renforcé de fibres métalliques (BHPRF). Les parapets préfabriqués ainsi développés permettent d’une part, d’augmenter la qualité de construction et d’éliminer la problématique de durabilité associée à la formation des fissures au jeune âge. D’autre part, les BHPRF utilisés ont une résistance à l’ouverture des fissures améliorée et une microstructure plus dense, ce qui ralentit la pénétration et diffusion des chlorures dans le béton. Enfin, les parapets préfabriqués permettent de réduire le temps d’installation et accélérer la réparation des ponts.
L’obtention d’une performance mécanique adéquate pour le niveau de performance 2 (PL-2) avec des parapets préfabriqués en BHPRF a été démontrée dans des projets antérieurs réalisés à l’École Polytechnique. Cependant, la performance de l’ensemble parapet et dalle de tablier en porte-à-faux n’avait pas été évaluée. Ce projet de recherche a étudié le comportement mécanique de trois ensembles parapet et dalle en porte-à-faux de 6 m de longueur soumis à un chargement statique transversal appliqué sur les parapets visant à reproduire les forces d’impacts de véhicules. Les parapets avaient les configurations suivantes : un parapet continu coulé-en-place typique des constructions faites au Québec, et deux configurations de trois parapets préfabriqués avec niche de liaisonnement avec la dalle coulée en place, une configuration sans liaison entre les parapets et une configuration avec clés de cisaillement entre les parapets. Le comportement de chacune de ces configurations ont été analysés et comparés.
Les résultats ont démontré que les parapets préfabriqués reliés avec une clé de cisaillement ont une rigidité et une résistance équivalente au parapet coulé en place, et dépassent les exigences de conception des normes pour les ponts construits au Canada ou aux États-Unis. Les dalles en porte-à-faux ont toutes eu un comportement semblable pendant les essais avec un réseau de fissures bien réparti. Les résultats des essais ont été reproduits avec des analyses non-linéaires par éléments finis. Une étude paramétrique a ensuite été réalisée pour évaluer les effets d’échelle, pour déterminer les endroits critiques d’impacts, et pour étudier l’effet de certaines modifications de la conception des parapets et de la dalle.
Les études paramétriques ont démontré que pour une longueur de 4 m, longueur attendue pour des parapets préfabriqués industriellement, il y un gain de résistance important pour les deux configurations de parapets préfabriqués (avec et sans clés) par rapport à des parapets préfabriqués de 2 m. Les configurations expérimentales, avec des parapets préfabriqués de 2 m de longueur, étaient aussi pénalisantes pour la performance mécanique de la structure que celle correspondant à un chargement excentré au bord des parapets préfabriqués de 4 m. Le choix de tester des parapets préfabriqués de 2 m était donc conservatrice. La conception de la structure dalle-parapet avec une dalle conçue en BHPRF offre des résultats intéressants. La dalle en BHPRF avec une résistance en flexion équivalente à celle d’une dalle conventionnelle permet une réduction de 50% de la quantité de renforcement transversal, offre un gain de résistance et de rigidité à la structure, et diminue la fissuration pour une même charge appliquée.
Ce mémoire décrit en détail ce projet de recherche : une revue de la littérature pertinente au sujet de recherché, l’étude préliminaire avec analyses par éléments finis pour établir les paramètres du montage expérimental, les plans de conception et de fabrication de chaque spécimen, l’installation et l’assemblage de chaque montage y compris l’instrumentation, les résultats et les analyses de tous les essais, et l’étude finale à l’aide des analyses non linéaires par éléments finis. Le mémoire contient deux articles soumis à des revues avec comité de lecture.
ABSTRACT
In Canada and the United States the majority of new longitudinal bridge barriers are made with cast-in-place concrete barriers. These barriers adequately meet the safety performance criteria to contain and redirect errant vehicles. However, the barriers are cast directly onto the hardened deck and the restrained barrier movements due to shrinkage and thermal effects cause early-age cracking. The early-age cracking accelerates barrier deterioration and decreases their durability. Furthermore, between the rebar placement, formwork assembly, and concrete curing, the installation of cast-in-place barriers is a lengthy process delaying the operational readiness of bridges. The time costs are particularly high during barrier repair and replacement work on existing bridges. In order to resolve these problems, Polytechnique Montreal has been developing a new design of precast bridge barriers made from high-performance steel fibre reinforced concrete (HPFRC). Precasting improves fabrication quality and solves the problem of early-age cracking. In addition, the HPFRC has an increased resistance to crack openings and a denser concrete microstructure, which prevents the penetration and diffusion of harmful chlorides in the concrete. Finally, well-conceived precast barriers reduces installation and repair time of the bridge barriers.
The mechanical performance of the HPFRC precast barriers was shown to exceed performance level 2 (PL-2) design criteria in recent projects carried out at Polytechnique Montreal. However, the overall performance of the precast barriers anchored to bridge deck overhangs was not been evaluated. In this research project, the mechanical behaviour of three different barrier configurations subjected to transverse static loading and anchored to identical 6 m long bridge decks with 1 m overhang lengths was evaluated. The following barrier configurations were considered: a typical cast-in-place barrier used in Quebec, and two arrangements of three precast barriers with a cast-in-place connection to the deck, in one the precast barriers were placed side-by-side independently, and in the other shear keys were added between the adjacent precast barriers. The behaviour of the three bridge decks were then analysed and compared.
The results demonstrated that the precast barriers with shear keys have a strength and rigidity equivalent to the Quebec cast-in-place barrier and exceed the design forces recommended in the Canadian and American bridge codes. The deck overhangs behaved similarly in each test with well distributed flexural cracks. Nonlinear finite element models were able to accurately simulate
each laboratory test and were then used to carry out a parametric study to investigate the effects of barrier length, eccentric edge loading, and design modifications.
The finite element studies demonstrated that precast barriers with 4 m lengths, the expected industrial length of the precast barriers, there is a significant increase in load-carry capacity for the two tested precast barrier configurations. The effect of using 2 m precast barriers was shown to be at least as critical to the structural performance as eccentric loads applied at the edges of 4 m precast barriers. The most promising design modification was changing the ordinary concrete slab design to HPFRC designed with an equivalent flexural resistance. The HPFRC slab allowed a 50% reduction in steel reinforcement, increased the load-carry capacity of the bridge deck, and reduced crack opening widths in the slab overhang for a given load.
This master’s thesis comprehensively details this entire research project. The following sections are presented: a review of the relevant literature, the initial finite element study to determine the appropriate parameters for the laboratory tests, the design and fabrication of the test specimens, the installation and assembly of the test setup including instrumentation, the test results and analysis, and a final study using nonlinear finite element analysis. The master’s thesis contains two articles as they were submitted to peer-review journals.
TABLE OF CONTENTS
ACKNOWLEDGEMENTS ... III RÉSUMÉ ... IV ABSTRACT ... VI TABLE OF CONTENTS ... VIII LIST OF TABLES ... XIII LIST OF FIGURES ... XV LIST OF ABBREVIATIONS AND SYMBOLS ... XX LIST OF ACRONYMS ... XXII LIST OF APPENDICES ... XXIV
CHAPTER 1 INTRODUCTION ... 1
1.1 Problem ... 1
1.2 Objectives ... 3
1.3 Methodology ... 3
1.4 Organization of Master’s Thesis ... 4
CHAPTER 2 LITERARY REVIEW ... 5
2.1 Introduction ... 5
2.2 Bridge Barriers ... 5
2.2.1 Purpose ... 5
2.2.2 Barrier Types ... 6
2.2.3 Considerations ... 11
2.3 Barrier Regulations in North America ... 11
2.3.1 Chronological Development ... 12
2.3.3 Expected Modifications to American and Canadian Codes ... 26
2.3.4 Considerations ... 27
2.4 Precast Concrete Rigid Bridge Barriers ... 28
2.4.1 Connection Types ... 29
2.4.2 Structural Validation Methods ... 36
2.4.3 Analysis Methods ... 40
2.4.4 Considerations ... 45
2.5 Conclusions ... 48
CHAPTER 3 ARTICLE 1: “STRUCTURAL BEHAVIOUR OF CAST-IN-PLACE AND PRECAST CONCRETE BARRIERS SUBJECTED TO TRANSVERSE STATIC LOADING AND ANCHORED TO BRIDGE DECK OVERHANGS.” ... 49
Abstract ... 49
3.1 Introduction ... 49
3.2 Experimental Program ... 51
3.2.1 Design Criteria ... 51
3.2.2 Preliminary Nonlinear Finite Element Evaluation ... 52
3.2.3 Design of Laboratory Specimens ... 53
3.2.4 Experimental Conditions ... 54
3.2.5 Experimental Setup ... 55
3.3 Results and Analysis ... 56
3.3.1 Strength, Failure, and Ductility ... 56
3.3.2 Slab Barrier Interaction ... 57
3.3.3 Cracking Pattern ... 58
3.4 Discussion ... 62
3.5 Conclusions ... 64
3.6 References ... 66
CHAPTER 4 ARTICLE 2: “NUMERICAL STUDY OF CAST-IN-PLACE AND PRECAST CONCRETE BARRIERS FOR BRIDGE DECKS.” ... 68
Abstract ... 68
4.1 Introduction ... 68
4.2 Research Significance ... 69
4.3 Experimental Program ... 70
4.4 Numerical Modeling ... 71
4.4.1 3D Finite Element Analysis Program ... 71
4.4.2 3D Models ... 72
4.4.3 Model Input Properties ... 73
4.4.4 Model Validation ... 74
4.5 Results and Discussions of Numerical Studies ... 76
4.5.1 Precast Barrier Fibre Orientation ... 76
4.5.2 Effect of the Precast Barrier Length ... 78
4.5.3 Eccentric Load Application ... 79
4.5.4 HPFRC Slab Overhang Behaviour ... 81
4.6 Conclusion ... 83
4.7 References ... 85
CHAPTER 5 COMPLIMENTARY INFORMATION AND GENERAL DISCUSSION ... 87
5.1 Preliminary Finite Element Evaluation ... 87
5.2 Design of Experimental Specimens ... 91
5.2.2 Slab Design ... 92
5.2.3 Barrier Designs ... 96
5.2.4 Loading Plate ... 97
5.2.5 Concrete Composition ... 98
5.3 Fabrication of Experimental Specimens... 99
5.3.1 Support Block ... 99
5.3.2 Slab Fabrication ... 101
5.3.3 Cast-in-Place Barrier, MTQ Type 201 ... 105
5.3.4 Precast Barriers ... 108
5.3.5 Specimen Properties ... 111
5.4 Experimental Setup and Procedure ... 112
5.4.1 Laboratory Configuration ... 112
5.4.2 Installation and Assembly ... 117
5.4.3 Instrumentation ... 123
5.4.4 Load Application ... 127
5.5 Mortar Injection Study ... 127
5.5.1 Injection Method ... 127
5.5.2 Mortar Mix Fresh State Properties ... 128
5.5.3 Final Verification – FRM Injection and Mechanical Properties ... 130
5.6 Complimentary Experimental Results ... 132
5.6.1 Barrier Longitudinal Strain ... 132
5.6.2 Relative Barrier Displacement (Precast Barriers) ... 135
5.6.3 Slab Overhang Transverse Strain ... 138
5.7.1 Model Information ... 141
5.8 Complimentary Parametric Studies ... 149
5.8.1 Loading Effect ... 149
5.8.2 Modified Precast Barrier Reinforcement Detail ... 150
5.8.3 Modified Anchor Reinforcement Detail... 152
5.9 General Discussion ... 153
CHAPTER 6 CONCLUSION AND RECOMENDATIONS ... 157
6.1 Reminder of Research Objectives ... 157
6.2 Conclusions ... 157
6.3 Recommendations ... 158
BIBLIOGRAPHY ... 161
LIST OF TABLES
Table 2-1: Barrier Crash Testing Equivalencies (FHWA Memo 1996) ... 15
Table 2-2: Test Levels (MASH 2009) ... 17
Table 2-3: Vehicle Gross Static Mass Upper and Lower Limits (MASH 2009) ... 17
Table 2-4: Occupant Compartment Intrusion Ratings (MASH 2009) ... 19
Table 2-5: OIV and Ride down Acceleration (MASH 2009) ... 20
Table 2-6: Equivalent Static Impact Loads (CSA 2006) ... 25
Table 2-7: Precast Barriers with Bolt-Down Anchor Connection ... 31
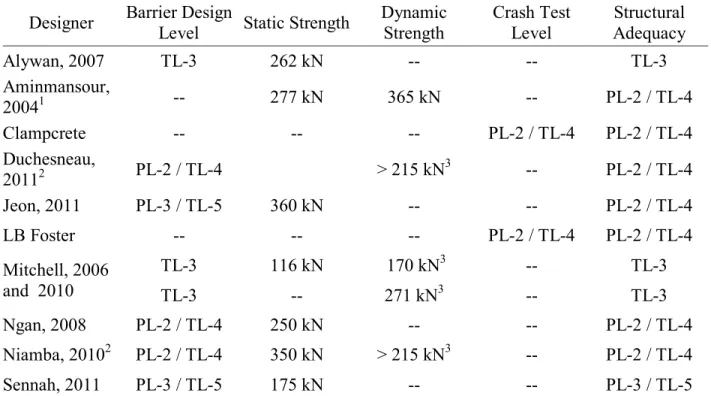
Table 2-8: Precast Barrier Structural Adequacy Evaluation ... 37
Table 2-9: Barrier Design Technique (MASH 2009 Paraphrased) ... 37
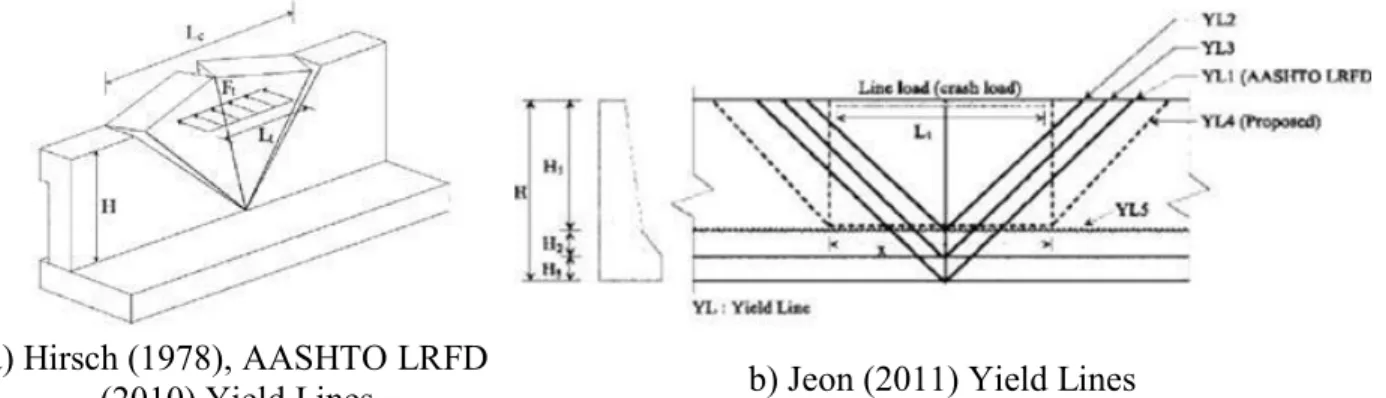
Table 2-10: Yield Line Analysis Jeon (2011) ... 42
Table 3-1: AASHTO 2010 and CSA 2006 Design Criteria for TL-4/PL-2 Barriers ... 51
Table 3-2: Laboratory Test Configurations ... 52
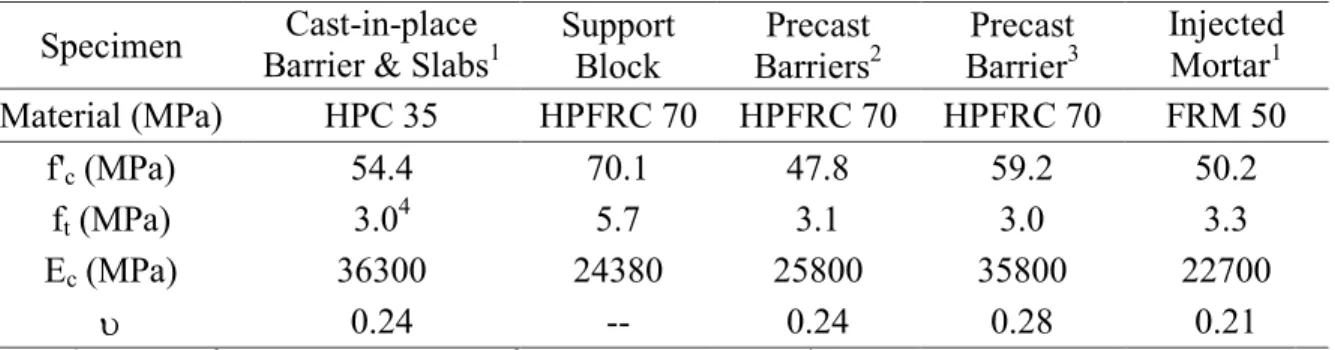
Table 3-3: Specimen Concrete Mechanical Properties ... 55
Table 3-4: Experimental Results Summary... 57
Table 3-5: Fabrication Problems and Consequences ... 61
Table 4-1: Laboratory Test Configurations ... 70
Table 4-2: Finite Element Properties... 73
Table 4-3: ATENA Fracture-Plastic Cementitious Material Properties ... 74
Table 5-1: Initial Parametric Study and Findings ... 89
Table 5-2: Slab Overhang Design Summary ... 94
Table 5-3: Loading Plate Mechanical Properties ... 98
Table 5-4: Concrete Composition* ... 99
Table 5-6: FRM Mix Designs ... 130
Table 5-7: FRM Mix Compressive Strength ... 131
Table 5-8: Barrier Maximal Longitudinal Strain at Given Load ... 133
Table 5-9: ATENA Material Formulations ... 142
Table 5-10: Mesh Dimensions ... 142
Table 5-11: Gap Element Contacts ... 144
Table 5-12: Test Configuration 1 Model, Pre-Loading Steps ... 145
Table 5-13: Test Configurations 2 and 3 Models, Pre-Loading Steps ... 145
Table 5-14: Anchor Reinforcement Study, Slab Shear Cracking and Anchor Stress Development ... 153
LIST OF FIGURES
Figure 2-1: Permanent Barrier Types (Photos from TAC ATC 2010) ... 7
Figure 2-2: Concrete Barriers Used in the United States (NCHRP 554) ... 7
Figure 2-3: Concrete Barrier Safety Shapes (McDevitt 2000) ... 8
Figure 2-4: Typical Impact Response with Safety Shape (TAC ATC 2010) ... 9
Figure 2-5: Concrete Barrier Single Slope Shapes (TAC ATC 2010) ... 10
Figure 2-6: Failed Crash Test (TAC ATC 2010) ... 13
Figure 2-7: Standard Crash Test Vehicle Types (TAC ATC 2010) ... 18
Figure 2-8: Impact Severity (TAC ATC 2010) ... 18
Figure 2-9: Exit Box Criterion (MASH 2009) ... 21
Figure 2-10: AASHTO LRFD (2010) Design Forces and Barrier Types ... 23
Figure 2-11: Application of Impact Design Loads (CSA 2006) ... 25
Figure 2-12: Bolt-Down Anchor Connections (Mitchell 2010) ... 31
Figure 2-13: Injected Recess Connection ... 32
Figure 2-14: Precast Barrier Jeon (2011) ... 33
Figure 2-15: Dowell Bar and Recess Reinforcement (Aminmansour, 2004) ... 33
Figure 2-16: Aminmansour (2004) Static Test Results ... 34
Figure 2-17: Longitudinal Connections, Mechanical Shear Keys ... 35
Figure 2-18: Longitudinal Connections, Shear and Moment ... 35
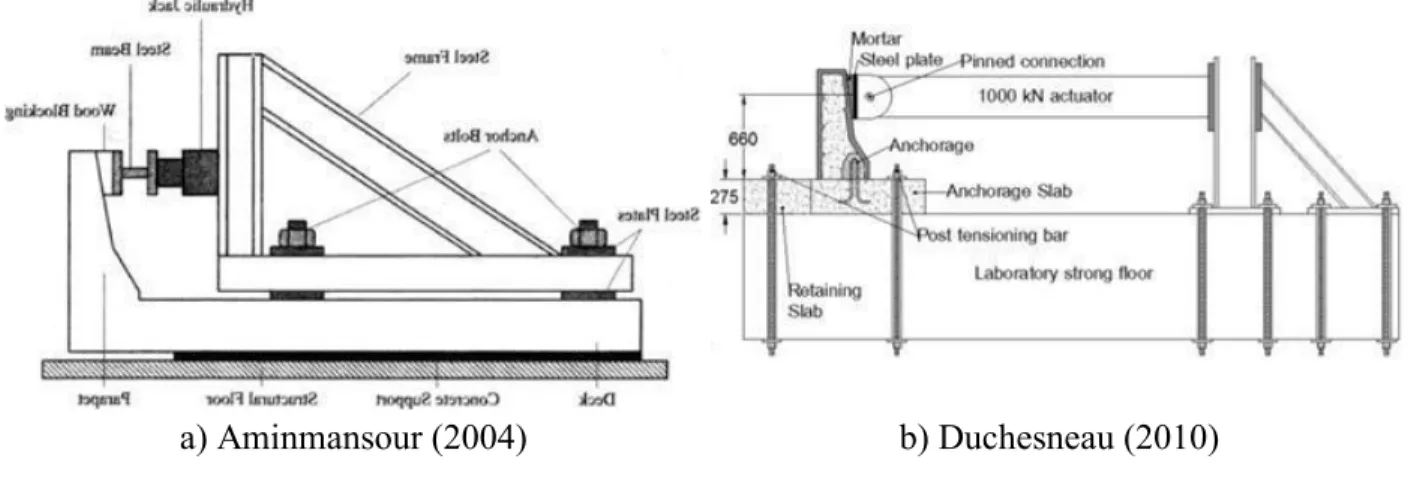
Figure 2-19: Static Test Setups ... 38
Figure 2-20: Pendulum Test ... 39
Figure 2-21: Dynamic Test Setup Niamba (2009) and Duchesneau (2010) ... 40
Figure 2-22: Yield Lines for Rigid Concrete Barriers ... 41
Figure 2-24: Strut-and-Tie Model (Aminmansour 2004) ... 44
Figure 2-25: Aminmansour (2004) Strut-and-Tie Model Series II Precast Barriers ... 45
Figure 2-26: Aminmansour (2004) Improved Barrier-Deck Connection Detail ... 45
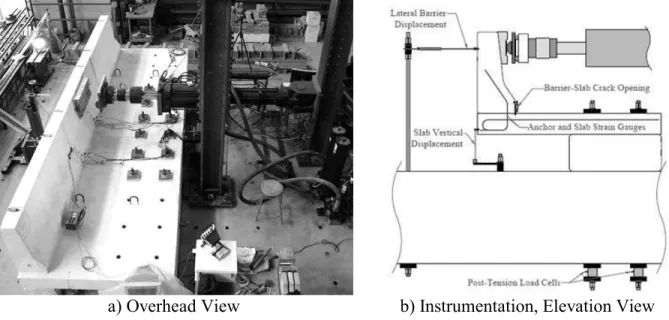
Figure 3-1: Experimental Setup ... 53
Figure 3-2: Barrier Sections ... 54
Figure 3-3: Lateral Barrier and Vertical Slab Displacements ... 57
Figure 3-4: Barrier-Slab Interface Crack Opening Width ... 58
Figure 3-5: Structural Damage at 250 kN and Ultimate Load ... 60
Figure 3-6: Slab Transverse Reinforcement and Anchor Bar Strain... 61
Figure 3-7: Lateral Barrier Displacement, Experimental and NLFE Models ... 62
Figure 4-1: Experimental Setup ... 71
Figure 4-2: Barrier Configurations ... 71
Figure 4-3: Numerical Model, Test Configuration 3 Precast Barriers with Connections ... 73
Figure 4-4: Measured Material Tensile Behaviour ... 74
Figure 4-5: Experimental and Numerical Results ... 75
Figure 4-6: Experimental and Numerical Cracking Pattern at Ultimate ... 75
Figure 4-7: Shear Crack Development Experimental Observations ... 77
Figure 4-8: Fibre Orientation, Configuration 3 ... 77
Figure 4-9: Barrier Length, Configurations 2 and 3 ... 79
Figure 4-10: Eccentric Load, Configurations 2 and 3 ... 80
Figure 4-11: Eccentric Load Failure, Configuration 2 ... 80
Figure 4-12: RC and HPFRC Slab Design ... 81
Figure 4-13: HPFRC Slab, Configuration 1 ... 82
Figure 5-1: Simplified Finite Element Model for Lab Configuration Study ... 88
Figure 5-2: Local Shear Failure in Slab Overhang... 94
Figure 5-3: Strut-and-Tie Model of Slab at Disturbed Load Transfer Region ... 95
Figure 5-4: Final Slab Design Lab Trial ... 96
Figure 5-5: Shear Key ... 97
Figure 5-6: Loading Plate Design ... 98
Figure 5-7: Block Formwork ... 100
Figure 5-8: Block and Steel Bracing for Post-Tensioning Ducts ... 101
Figure 5-9: Slab Reinforcement and Anchor Support ... 103
Figure 5-10: Truck Assess for Slab Casting ... 103
Figure 5-11: Exposed Aggregate Surface on Slabs ... 104
Figure 5-12: Formwork Assembly and Fixation, Cast-in-place Barrier ... 106
Figure 5-13: Barrier Pour with Industrial Pump ... 107
Figure 5-14: Barrier As-Built Section ... 107
Figure 5-15: Barrier Joint Spill and Curvature ... 107
Figure 5-16: Precast Barrier Pour Preparation ... 108
Figure 5-17: Precast Barrier Fabrication ... 109
Figure 5-18: Precast Barriers Before and After Patch Up ... 111
Figure 5-19: Preliminary Loading Problems ... 114
Figure 5-20: Loading Modification ... 114
Figure 5-21: Counter Weight System ... 115
Figure 5-22: Load Application Detail ... 116
Figure 5-23: Final Laboratory Configuration ... 117
Figure 5-25: Post Tensioning Equipment ... 119
Figure 5-26: Mortar Bed for Precast Barriers ... 120
Figure 5-27: Mortar Injection Feed (left) and Joint Sealing (right) ... 121
Figure 5-28: Temporary Vertical Restraint of Barriers ... 122
Figure 5-29: Ends of Hollow Recess after Injection ... 122
Figure 5-30: Joint Blowout and Shear Key ... 123
Figure 5-31: Barrier Lateral and Slab Vertical Displacement Sensors ... 126
Figure 5-32: Barrier and Slab Crack Opening and Relative Uplift Sensors ... 126
Figure 5-33: Barrier Longitudinal Deformation Sensors ... 126
Figure 5-34: Mortar Injection, Pump Access and Air Outlet from Duchesneau (2010) ... 128
Figure 5-35: Model Injection ... 131
Figure 5-36: Applied Load vs. Barrier Longitudinal Strain ... 132
Figure 5-37: Barrier Longitudinal Strain vs. Barrier Lateral Displacement ... 135
Figure 5-38: Applied Load vs. Barrier Longitudinal Strain ... 135
Figure 5-39: Instrumentation Location for Barrier Edges for Relative Lateral Displacements ... 136
Figure 5-40: Barrier-to-Barrier Joints at 400 kN for Test 3 ... 136
Figure 5-41: Relative Displacement Between Loaded and External Barriers... 137
Figure 5-42: Test Configuration 2 Relative Barrier Displacement at 200 kN Applied Load ... 137
Figure 5-43: Slab Overhang Instrumentation ... 139
Figure 5-44: Slab Overhang Compressive Strain ... 139
Figure 5-45: Structure Damage at 150 kN ... 140
Figure 5-46: Test Configurations 2 and 3 Models Surface Mesh ... 142
Figure 5-47: Load Application ... 144
Figure 5-49: Test Configuration 1 Results ... 147
Figure 5-50: Test Configuration 2 Results ... 148
Figure 5-51: Test Configuration 3 Results ... 149
Figure 5-52: Load Effect Study, Test Configurations 1, 2, and 3 ... 150
Figure 5-53: Barrier Reinforcement Detail ... 151
Figure 5-54: Barrier Reinforcement Study, Test Configuration 3 ... 151
Figure 5-55: Anchor Design, Development, and Shear Cracking ... 152
LIST OF ABBREVIATIONS AND SYMBOLS
Abbreviations/Symbols (Greek):
Strain
f Fracture strain
Coefficient of friction
br Material bearing strength reduction coefficient
c Concrete strength reduction coefficient
s Steel strength reduction coefficient
Poissons ratio
Abbreviations/Symbols (Latin):
App Approximately
Br Bearing strength in terms of force
c/c Center-to-center
E Young’s modulus
ºC Degrees Celsius
fy Steel yield stress
f’c Concrete compressive strength in terms of stress
f’t Concrete tensile strength in terms of stress
GF Fracture Energy
h Drop height
Hz Hertz
kN Kilonewton
lbf Pound-force
Lc Critical yield line length
m Metre
m Mass
MPa Megapascal
o/c On-center spacing
PL-# Performance Level - # (i.e. 2) psi Pound-force per square inch
QC Québec
Rw Barrier ultimate strength
TL-# Test Level - # (i.e. 4)
v Velocity
Vol Volume
w0 Critical crack opening width where tensile stresses no longer transfer across the
LIST OF ACRONYMS
AADT Average Annual Daily Traffic
AASHTO American Association of State and Highway Transportation Officials ACI American Concrete Institute
ASCE American Society of Civil Engineers
ASTM American Society for Testing and Materials
BHPRF Béton haute performance renforcé de fibres métalliques BEI Barrier Exposure Index
CHBDC Canadian Highway Bridge Design Code CDPBS Connection Details for Precast Bridge Systems CSA Canadian Standards Associations
DOT Department of Transportation (preceded by state initials) EHFG Euclid High-Flow Grout
FHWA (United States Department of Transportations’) Federal Highway Administration FRC Fibre Reinforced Concrete
FRM Fibre Reinforced Mortar
GM General Motors
HPC High Performance Concrete
HPFRC High Performance Fibre Reinforced Concrete HRB Highway Research Board
HTCS High Tension Cable System IS Impact Severity (kJ)
LRFD Load Resistance Factored Design
MASH Manual for Assessing Safety Hardware MSL Multiple Service Level
MTQ Québec Ministry of Transportation / Ministère des Transports du Québec NCHRP National Cooperative Highway Research Program
NHS (United States) National Highway System NLFE Nonlinear Finite Element (method/analysis) OHBDC Ontario Highway Bridge Design Code OIV Occupant Impact Velocity (m/s) PCI Precast Concrete Institute
PL Performance Level
PVC PolyVinyl Chloride RDG Roadside Design Guide SUT Single-Unit Truck
TAC/ATC Transportation Association of Canada/Association des Transports du Canada
TL Test Level
TRB Transportation Research Board
UHPFRC Ultra-high performance fibre reinforced concrete U.S.(A.) United States (of America)
LIST OF APPENDICES
APPENDIX A DESIGN DRAWINGS, AS-BUILT DRAWINGS, AND REINFORCEMENT SCHEDULES ... 167 APPENDIX B INSTRUMENTATION ... 177 APPENDIX C SLAB OVERHANG DESIGN ... 183 APPENDIX D SPECIMEN FABRICATION LOG ... 188 APPENDIX E FRM OPTIMIZATION STUDIES ... 197
CHAPTER 1
INTRODUCTION
1.1 Problem
Throughout the United States (U.S.) and Canada, the overwhelming majority of longitudinal bridge barriers are made using reinforced concrete cast-in-place safety shaped barriers (NCHRP 574, TAC ATC 2010). The bridge barriers are meant to force errant vehicles to remain on the roadway and their two primary functions are (MASH 2009, CSA 2006):
1. To contain the vehicle on the bridge;
2. To safely redirect the vehicle back onto the roadway or bring the vehicle to a stop within an acceptable distance.
Crash testing and field experiences have demonstrated that the commonly used Jersey and F shaped safety barriers adequately meet these mechanical demands. However, in aggressive environments, they often deteriorate prematurely and require expensive repair or replacement work to maintain their structural integrity (Haluk & Attanayaka, 2004). The deterioration is due to a combination of several factors. Often there is the formation of early-age vertical cracks on the barriers, as the deck slab fully restrains the barrier movements caused by concrete shrinkage and thermal dilations (Cusson & Repette, 2000). The barriers are also often exposed to severe environmental conditions, and in colder climates they must resist freeze-thaw cycles and the chlorides present in de-icing salts. The early-age cracks are aesthetically unpleasant, but more importantly they give an immediate opening for chlorides to quickly penetrate into the concrete matrix through capillary suction and absorption (Conciatori 2005). The corrosion of the reinforcing steel reduces the structural capacity, while the pressure induced by the rust growth causes concrete spalling, delamination, and pop-out. The use of epoxy-coated reinforcement has shown premature degradation. In areas with more extreme winter climates, such as Canada, the United States, and Northern Europe, these processes can lead to premature degradation of the barriers, and necessitate expensive bridge barrier repairs and replacement (Haluk & Attanayaka, 2004).
Since 2007, Polytechnique Montréal has been developing precast high performance steel fibre reinforced concrete (HPFRC) bridge barriers as a solution to the above durability issues. The
currently in use. Precasting provides a higher standard of fabrication quality associated with industrialized manufacturing, and will allow the precast barriers to reach their steady-state volume at the precast plant without restraint. The HPFRC material has exceptional durability and mechanical properties. The HPFRC matrix microstructure is much denser than ordinary concrete and the steel fibres limit crack opening widths (Rossi et al, 1987). These properties prevent the penetration and movement of chlorides into the HPFRC, and provide a high resistance to chloride induced degradation. From a mechanical perspective, the steel fibres give the concrete an improved resistance to crack openings and increased fracture energy. The improved mechanical properties of the concrete allow the removal of up to 60% of the traditional reinforcement while maintaining an equivalent mechanical strength (Niamba 2009, Duchesneau 2010), thereby reducing the potential of damage due to steel corrosion. The HPFRC precast barriers will improve the barriers resistance to degradation by eliminating early-age cracking, by slowing the speed of water and chloride ingress into the concrete matrix, and by reducing the potential for corrosion.
The improved durability of the precast barriers provides a strong incentive for their use, and the reduced construction time associated with their installation provides another. Cast-in-place concrete barriers are typically poured in alternating sequences, to reduce early-age cracking and to incorporate bridge expansion joints (TAC ATC 2011, Bisonnette and Morin 2000). For a standard single-span 30 m bridge, it is estimated that the sequenced construction (rebar cage assembly, formwork assembly, casting and curing) requires at least 18 days. However, the precast barrier systems designed at the Polytechnique Montréal (Niamba 2009, Duchesneau 2010) only require an estimated 4 days for installation (Charron et al, 2011), and the FHWA Connection Details for Precast Bridge Systems Report (CDPBS 2009) estimates a precast barrier installation time of 1 to 2 days. The faster installation (or repair) time of precast concrete barriers is a significant financial benefit, particularly in urban areas where construction costs associated with traffic delays and hazards can reach up to 30% of the total project costs (Duchesneau et al. 2011). Two precast barrier configurations designed according to Canadian Standards Association Highway Bridge Design Code (CSA 2006) performance level 2 (PL-2) requirements, equivalent to AASHTO test level 4 (TL-4), have been tested and analysed at Polytechnique Montréal (Niamba 2009, Duchesneau 2010). The experimental programs evaluated the static and dynamic performance of the barriers alone in order to demonstrate that the barrier and connection strength
met the needs of a PL-2 / TL-4 barrier. However, the mechanical behaviour of the precast barriers and slab at a realistic scale and with representative boundary conditions is necessary to evaluate the precast barrier designs as they will be used on highway bridges. The precast barriers do not have the same longitudinal continuity or connection detail as their cast-in-place counterparts, and there is a risk that the load transfer mechanics between the precast barrier and the deck slab could negatively impact the behaviour of the bridge deck, particularly the overhang portion of the bridge. In order to adequately assess the performance of the precast barriers, the mechanical behaviour of the reference MTQ Type 201 cast-in-place barrier must be evaluated as well.
1.2 Objectives
The experimental study described in this master’s thesis is meant to establish the performance of the precast barriers developed by Duchesneau (2010) in realistic bridge conditions. The experimental study will evaluate and compare the structural behaviour of 6 m long bridge decks with 1 m overhangs during the static loading of the bridge barriers to simulate the transverse impact forces from vehicles.
Three different barrier configurations will be tested. Test Configuration 1 will test a continuous cast-in-place MTQ Type 201 F shaped barrier and establish the reference bridge deck behaviour. Test Configuration 2 will test the precast barriers developed by Duchesneau (2010) as they were designed. Test Configuration 3 will test the same precast barriers with the addition of shear connections between barriers. The design of a simple and effective shear connection between precast barriers compatible with the precast barriers developed by Duchesneau (2010) will be necessary for Test Configuration 3. Once the experimental tests will be completed and analysed a finite element study will be carried out to broaden the experimental findings and optimize the precast barrier design.
The performance of the reference cast-in-place barrier configuration will be compared with that of the precast barrier configurations to determine their structural adequacy for use on highway bridges, evaluate the impact of using precast barriers on the durability of the bridge slab overhang, and to optimize the precast barrier design for industrial use.
In Phase I, an appropriate setup for the experimental tests was designed. An initial qualitative finite element analysis study was carried out in order to establish the necessary bridge deck length, overhang width, and overhang support conditions. The finite element study also identified important performance indicators for instrumentation during experimental testing. Once the general parameters of the laboratory tests were established, the design of each laboratory specimen, load application details, and instrumentation plans could be finalized.
In Phase II, the fabrication, installation, experimental testing, and data analysis for the three different test configurations was performed.
In Phase III, a quantitative finite element evaluation was performed. First, the test configurations were accurately simulated. The validated numerical models were then used to correct fabrication errors and to evaluate key design parameters as a means to optimize the final design of the precast barriers.
The results from Phases II and III were used to provide recommendations for the final design of the precast barriers to be used on actual bridges.
1.4 Organization of Master’s Thesis
This Master’s Thesis is divided into five Chapters. Chapter 1 introduces the research topic, problem statement, objectives, methodology, and report organization. Chapter 2 provides a non-exhaustive review of the relevant literature. Chapter 3 consists of a stand-alone article on the results and analysis of the experimental portion of this project (Phases I and II) submitted for publication in the ASCE Journal for Bridge Engineering. Chapter 4 consists of a stand-alone article on the results and analysis of the numerical portion of this project (Phase III) submitted for publication in the ACI Structure Journal. Chapter 5 consists of complimentary information to both Chapter 3 and Chapter 4 that could not be presented in the articles. Chapter 6 concludes this research report by highlighting the important findings and observations and providing future recommendations concerning the project. Following the conclusion, five Appendices have been attached to comprehensively detail the design & as-built drawings (APPENDIX A), the instrumentation plans (APPENDIX B), the slab overhang design (APPENDIX C), the specimen fabrication (APPENDIX D), and the injected mortar optimization study (APPENDIX E).
CHAPTER 2
LITERARY REVIEW
2.1 Introduction
The safety and efficacy of highway bridge barriers has greatly improved since the advent of the automobile. The continued evolution in barrier technologies, barrier evaluations, and barrier design requirements and/or guidelines throughout North America are the driving force behind these improvements.
The first part of this non-exhaustive literary review covers traditional barrier designs, the development of barrier regulations in the United States (U.S.) and Canada, and the most current governing regulations. The second part of the review of the literature is on the proposed designs of precast concrete rigid bridge barriers with an emphasis on the connection details, structural testing, and design methods developed for the precast barrier designs.
2.2 Bridge Barriers
2.2.1 Purpose
Bridge barriers make up a primary safety feature of the bridge railing system. The barriers are installed on the edge of the roadway surface and should contain vehicles within the bridge. The Canadian Highway Bridge Design Code (CSA-S6 2006) stipulates that traffic barriers:
Shall be provided on both sides of highway bridges to delineate the superstructure edge and to reduce the consequences of vehicles leaving the roadway. The barrier adequacy in reducing the consequences of vehicles leaving the roadway shall be determined from crash tests.
The CSA (2006) underlying barrier design and evaluation theory originates from the American Association of State Highway and Transportation Officials (AASHTO) Guide Specifications for Bridge Railings 1989 and the AASHTO LRFD Bridge Design Specifications 2004. The AASHTO LRFD (2004) further clarifies that the primary purposes of the barriers are to contain the vehicle and either redirect it safely back into the roadway or bring it to a controlled stop.
2.2.2 Barrier Types
Several types of barriers have been designed and constructed to meet the demands of the evolving vehicle fleet and to take advantage of newer technologies. The barriers are all intended to contain and redirect vehicles and to protect vehicle occupants and bystanders. However, their proper design depends largely on the geographic and demographic environment in which they will be used. Longitudinal barriers are broadly categorized as flexible, rigid, or semi-rigid (MASH 2009).
The flexible barriers are often preassembled and simply placed on the roadway surface with a pinned or bolted connection (Oregon Precast Barrier, Texas Cross-Bolt Precast Barrier, Washington State Precast Barrier). The flexible barriers are subject to large displacements up to 2.5 m during heavy impacts (TAC ATC 2010), and are most often used for temporary installations or in areas of low speed traffic without heavy trucks. The large displacement limits the usage of flexible barriers to areas with sufficient room.
Semi-rigid barriers are most-often permanently fixed to the roadway, and typically consist of high tension cable systems (HTCS), or weak-post W-beam guardrail systems. The HTCS are cheaper to install than more rigid steel guardrails and concrete barriers, and they have been shown to successfully contain and redirect vehicles during heavy impacts (Medina 2006, WSDOT 2009). However, they require too much space for deflections to be practically used on most bridges and are perceived by the public as less secure than more rigid barriers (TAC ATC 2010). Semi-rigid barriers are most often used as medium barriers to prevent cross-traffic accidents, or on low-speed, low-use bridges and roadways.
In spite of certain advantages of the flexible and semi-rigid barriers – cheaper installation, greater dissipation of impact energy, more aesthetically pleasing designs – rigid barriers are most compatible with bridge structures and better suited to resist heavy impacts. Rigid barriers are almost exclusively used on highway bridges throughout North America (TAC ATC 2010). Rigid barriers are fixed permanently to the roadway structure and experience only very small amounts of lateral deflection during vehicle impacts. The most commonly used rigid barriers are cast-in-place concrete, metal post-and-beam, or a combination of the two (Figure 2-1).
a) Rigid Concrete Barrier b) Metal Post-and-Beam Barrier c) Combination Barrier Figure 2-1: Permanent Barrier Types (Photos from TAC ATC 2010)
Although both concrete and post-and-beam barrier designs have been successfully crash tested and approved for use throughout North America, a survey of state DOT’s in the United States determined that concrete barriers account for over 75% of the longitudinal barrier inventory and that 44% of states do not use metal post-and-beam type barriers at all (NCHRP 574). The concrete barriers have likely gained the market since they have much lower maintenance costs (Mak 1990), and the increased flexibility of the metal barriers was not shown to improve occupant safety during impacts (NCHRP 289).
The rigid concrete barriers have been in use since the 1940’s (NCHRP 244) and they have undergone extensive research and development. The safety shaped Jersey and F barriers have come to dominate the American market (Figure 2-2) and accounted for 68% of concrete barriers in use within the US as of 2006 (NCHRP 554). Their structural adequacy and vehicle impact interaction have consistently shown satisfactory performance during full-scale crash tests (Buth 1990, FHWA Bridge Rail Guide 2005).
2.2.2.1 Safety Shaped Concrete Barriers
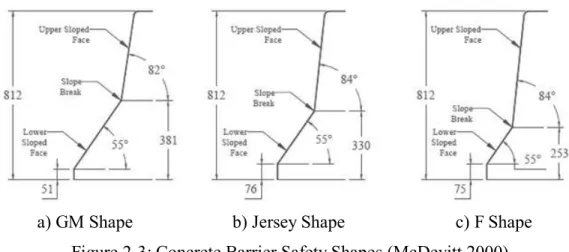
Research and development into rigid concrete barrier safety shapes began in the 1950’s at General Motors’ (GM) proving grounds in Milford Michigan (Mak et al. 1990) where the first safety shaped GM barrier was developed. The New Jersey Department of Transportation was also developing concrete safety shapes around this time and created the Jersey shaped barrier in 1959 (Kozel 2004). In an effort to improve the vehicle stability after impacts with Jersey shapes, a numerical parametric study with six different barrier shapes labelled A-F was performed. The F shaped barrier demonstrated the most improvement in the parametric study, as well as in subsequent crash testing, and has since been incorporated onto North American bridge and roadways (McDevitt 2000). The geometry of the GM, Jersey, and F shaped concrete barriers are shown in Figure 2-3.
a) GM Shape b) Jersey Shape c) F Shape
Figure 2-3: Concrete Barrier Safety Shapes (McDevitt 2000)
The safety shapes were designed to minimize damage to vehicles during impacts, and the vehicle impact behaviour with concrete safety shaped barriers is described by McDevitt (2000). During the more common shallow angle impacts with passenger vehicles, the front tires will most often simply ride up the lower sloped face and redirect the vehicle back onto the roadway with minimal damage. For more severe angle impacts there is a multi-stage response. The vehicle bumper will hit and ride up the upper sloped face of the barrier providing an initial uplift and redirection, and almost immediately after, as the vehicle begins to re-align itself parallel to the barrier, the wheel will then come into contact with lower sloped face of the barrier creating additional (and substantially more) vehicle lift. The multi-stage impact behaviour is shown Figure 2-4. The upward lift during impact lowers the friction between the vehicle and roadway and therefore
reduces the energy necessary to redirect the vehicle. However, the lift also decreases the vehicle stability and in certain instances can lead to vehicle rollover when returning to the roadway. The impact behaviour of heavy trucks is substantially different. A heavy truck will roll towards and over the barrier until the underside of the carriage slides along the top of the barrier, preventing the roll to continue as the truck is redirected back onto the roadway (Figure 2-4).
a) Passenger Vehicle Impact b) Single Unit Truck Impact Figure 2-4: Typical Impact Response with Safety Shape (TAC ATC 2010)
For passenger vehicle impacts the key design parameters are the angles of the two sloped faces and the height of the slope break from the road surface. The shallower the slope angle, the easier for the vehicle to roll up the barrier. The higher the slope break the longer the vehicle will ride up the lower sloped face. Shallower angles and higher slope breaks both generate more vehicle lift and roll during impacts (Mak 1990, McDevitt 2000). As can be seen in Figure 2-3, the slope angles of the three shapes are very similar but the slope break has been consistently lowered as the safety shaped barriers have been improved. The slope break of the GM barrier was too high and their use was discontinued due to vehicle instability during crash tests (McDevitt 2000). For impacts with heavy trucks the key design parameter is the barrier height. The truck carriage must come into contact with the barrier at a high enough point to prevent the truck from rolling over. The minimum height of the barriers is therefore an important design parameter and is specified in the North American codes depending on the expected level and speed of truck traffic.
optimized safety shape will provide enough lift to reduce vehicle contact with the roadway and lower vehicle accelerations without causing the vehicle to rollover. Full-scale crash tests and numerical simulations (Buth 1990, McDevitt 2000) have demonstrated that both the Jersey and F shaped barriers adequately contain and redirect vehicles. The F shape has a slope break 77 mm lower than the Jersey shape, and has been shown to be less likely to cause vehicle rollover (Buth 1990, McDevitt 2000). However, the F shape was designed only after Jersey shaped barriers had already been installed in many regions throughout North America, and since the advantages of the F shape have not been unanimously demonstrated (Mak 1990) and the in-service performance of Jersey shaped barriers has been adequate, the Jersey barrier remains the dominant safety shaped barrier on bridges and roadways throughout North America.
2.2.2.2 Single Slope
Single slope barriers are another rigid barrier system currently in use in North America. These barriers come in two variations with either a vertical front face or a constant-sloped front face with an angle very similar to the upper sloped face of the safety shaped barriers (Figure 2-5). The single slope barriers present significant savings in terms of bridge and roadway maintenance. As opposed to safety shaped barriers, the geometry of the single slope barriers is not affected by the pavement overlay thickness. As long as the minimum barrier height is maintained new pavement can be poured directly on top of the existing roadway surface. For safety shapes however, the existing overlay must be ground down before refinishing, an expensive and time consuming process (Mak 1990). The single slope barriers also decrease the lift forces during impacts and therefore have a much lower risk of vehicle rollover.
b) Vertical Face c) Constant Slope
The 32 in. (812 mm) vertical face barrier was crash-tested by Buth et al. (1990) with a small vehicle, pickup truck, and single unit truck (SUT). The barrier successfully contained and redirected each vehicle, but the lateral accelerations recorded were significantly higher than those of the safety shaped barriers. For instance, the lateral acceleration recorded with the SUT impact test was 4.6 g and 2.5 g for the vertical face and F shape barriers respectively (Buth 1990). Essentially the vertical face barrier simply redirects the vehicle back away from the barrier; therefore the kinetic crash energy is absorbed primarily by vehicle crush during impact. The result is a more stable vehicle, but greater lateral accelerations associated with increased risk of occupant injury.
The constant slope barrier was therefore developed to combine the advantages of safety shaped and vertical face barriers. Mak et al. (1994) crash tested a 32 in. (812 mm) constant slope barrier with a 79 slope face with a pickup truck and SUT. The constant slope barrier demonstrated improved vehicle stability, and lateral accelerations comparable to Jersey shaped barriers. Despite the potential economic gains of using a constant slope barrier, their use represented a very small amount of the concrete barriers in use throughout the US in 2006 (Figure 2-2).
2.2.3 Considerations
The constant-sloped barriers seem to strike a good balance between minimizing vehicle accelerations and maintaining vehicle post-impact stability, and the financial savings are also considerable since the pavement overlay thickness does not affect the barrier-vehicle impact behaviour (Mak 1994). The F shaped concrete barrier is the current standard in Quebec, CA, however consideration should be given to moving towards the use of constant slope barriers.
2.3 Barrier Regulations in North America
As personal vehicles and heavy truck traffic have increased in use throughout North America, it became necessary to standardize the design and evaluation of bridge and traffic barriers. In the U.S. there are several agencies that contribute to the development and oversight of codes governing the highway system. The combined and connected publications from the Federal Highway Administration (FHWA), the AASHTO, the Transportation Research Board (TRB), the Highway Research Board (HRB), and the National Cooperative Highway Research Program (NCHRP) have created a convoluted series of regulatory documents and jurisdictional authority.
The following section of the literary review is an attempt to trace the development of barrier design recommendations and crash testing standards in the U.S. and Canada.
2.3.1 Chronological Development
Due to the complicated nature of vehicle barrier impacts, crash testing has been used as a barrier design and development tool since the 1930’s. In the initial crash tests, vehicles were simply rolled down hills into barriers; there were neither standardized impact procedures nor evaluation criteria (FHWA Presentation 2009). In the 1950’s and 1960’s the personal use of automobiles became increasingly common and more extensive resources were devoted to the development of barriers. In the U.S. the first crash testing procedural guidelines were published in 1962 in HRB Circular 482. The one page document recommended using an 1819 kg sedan with an impact velocity of 97 km/h and at 7° and 25° impact angles. The idea was to reproduce the worst
practical conditions with impact tests. Circular 482 was followed up with NCHRP Report 154. A
16 page document published in 1974 that added the small vehicle (1023 kg) crash test, and proposed evaluation criteria for the first time. NCHRP 154 also considered other components of railing systems, such as terminals, transition barriers, and crash cushions. The crash testing guidelines were modified again in 1978 when the TRB published Circular 191 to address certain flaws in NCRHP 154.
Throughout this time the American and Canadian regulatory agencies did not require crash testing for the design of bridge and roadway barriers. The design of the barriers was based on static design methods, past experience, and engineering judgment (TAC ATC 2010). In 1980 another more complete set of crash testing guidelines was published in NCHRP Report 230. NCHRP Report 230 “Recommended Procedures for the Safety Performance Evaluation of Highway Safety Appurtenances,” was a 36 page document that updated crash testing procedures and evaluations. The report added large buses and heavy trucks into the crash test vehicle matrix, and implicitly introduced the concept of different barrier performance levels. The crash tests were evaluated on the barrier structural adequacy, occupant risk, and vehicle trajectory after collision. The NCHRP 230 report became the primary full scale vehicle crash test reference in the U.S. and Canada (MASH 2009, TAC ATC 2010). Crash tests throughout the late 1970’s and early 1980’s demonstrated that several of the highway and bridge barriers designed with static methods were structurally inadequate as shown in Figure 2-6, and several dramatically failed the NCHRP 230
crash tests (FHWA Memo 1996). As a result, the regulating agencies began implementing crash test requirements for the design and use of barriers. The FHWA first issued a policy memorandum in 1986 stating that bridge barriers on the U.S. National Highway System (NHS) had to be proven crashworthy according to the NCHRP 230 criteria. The FHWA memo contained a list of 22 barrier designs that were already considered crashworthy based on existing crash test data (these designs included both Jersey and F shape concrete barriers). The AASHTO Guide Specifications for Bridge Barriers published in 1989 also required for bridge barriers to be crash tested.
Figure 2-6: Failed Crash Test (TAC ATC 2010)
The Guide Specifications (1989) explicitly detailed the crash testing vehicle matrix and used the barrier multiple performance level concept. The multiple performance level concept was first formally introduced in NCHRP Report 239 (1981). The idea being that different site conditions – posted speed-limit, heavy truck traffic composition, barrier exposure index – merit different levels of barrier performance. Three different barrier performance level testing criteria were listed, and were different although generally compatible with the crash test matrix specified in the NCHRP 230, where the multiple performance level concept was implicitly present with the required (Level 2) and recommended supplementary crash tests (Levels 1 and 3). The AASHTO Guide Specification (1989) then provided a series of selection tables to determine the barrier performance level necessary for a given bridge. The selection tables were calculated with the cost-benefit analysis program called BCAP. The idea was to select the barrier performance level that provides an appropriate level of security with the least total cost, considering the costs of
The AASHTO Guide Specifications (1989) also introduced the hierarchy concept that bridge anchors and decks should be designed to resist the ultimate moment, shear, and punching loads that can be transferred from the barrier. In other words, the barriers should fail before either the anchors or bridge deck. Static loads and loading conditions – height and surface – were specified for each barrier performance level to design the barrier anchors and bridge decks to resist the ultimate barrier capacity.
The Ontario Highway Bridge Design Code (OHBDC 1991) incorporated most of the recommendations from the AASHTO Guide Specifications (1989) and was the first Canadian regulatory authority to require crash testing and introduce the multiple performance level concept. The OHBDC also used BCAP to create selection tables for the barrier performance level, and included design loads for the anchor and bridge deck design. These concepts were endorsed nationally throughout Canada with the release of the Canadian Highway Bridge Design Code in 2000.
Modifications to the passenger vehicle fleet and more extensive experience with crash testing lead to the publication NCHRP Report 350 in 1993 as the successor to NCHRP 230. The new 64 page report used metric units for the first time and replaced the 1819 kg sedan with a 2000 kg pickup truck as the standard test vehicle. NCHRP 350 also endorsed the multiple performance level concept, but defined them in terms of barrier crash test levels (TL). NCHRP 350 categorized 6 different test levels for barrier classification.
In 1994 AASHTO also published the LRFD Bridge Design Specifications 1st Edition as an
alternative to the AASHTO Standard Specifications for Highway Bridges. In the AASHTO LRFD (1994) the barrier performance level concept was continued, however the vehicle crash test matrix differed from both the Guide Specifications (1989) and NCHRP 350 (1993). In order to limit confusion regarding the different crash testing specifications listed in the various research reports and regulatory documents, the FHWA, the ultimate authority on the NHS, issued a memorandum in 1996 to clarify its position on crashworthy barriers and formally define compatibility between the different documents (Table 2-1). The FHWA 1996 memorandum stated that:
As of august 16, 1998 all new barriers installed on the NHS had to be successfully crash tested to the NCHRP 350 criteria. Minimal TL rating for the NHS would be TL-3.
Barriers successfully meeting the NCHRP 230 criteria are considered adequate and do not need to be crash tested again with NCHRP 350 requirements.
The FHWA strongly recommended that AASHTO adopt the NCHRP 350 crash testing criteria and test levels.
The FHWA published a list of 68 barrier designs accepted as crashworthy and their respective TL.
Table 2-1: Barrier Crash Testing Equivalencies (FHWA Memo 1996) Bridge Railing Testing Criteria Acceptance Equivalencies
NCHRP Report 350 TL-1 TL-3 TL-3 TL-4 TL-5 TL-6
NCHRP Report 230 -- MSL-1,-2 -- MSL-3 -- --
AASHTO Guide Specs 1989 -- PL-1 -- PL-2 PL-3 --
AASHTO LRFD Specs 1993 -- PL-1 -- PL-2 PL-3 --
AASHTO followed the FHWA recommendation, and in the 2nd Edition of the AASHTO LRFD (1998) six barrier crash test levels as defined in the NCHRP 350 were specified. The 1998 LRFD no longer provided selection tables to select the necessary barrier test level, but indicated a general guide and left the test level selection up to the bridge governing authority.
The codes in the U.S. and Canada have continued to develop with emerging technologies and increased crash test data. However, no major innovations have developed in regards to bridge barrier design and evaluation since the 1990’s. In 2009 the Manual for Assessing Safety Hardware (MASH 2009) was published by AASHTO to succeed NCHRP Report 350. The MASH (2009) document updated the crash tests vehicles to better represent the traffic fleet, added more objective crash test evaluation criteria, and addressed some flaws noted in the NCHRP 350. The AASHTO LRFD 5th Edition and the AASHTO Roadside Design Guide were
published in 2010 and 2011 respectively and are the most recent American publications on the design of bridge barriers. In Canada, a more recent bridge design code was published by CSA in 2006, however there were no notable changes in the approach to bridge barrier design and evaluation from the 2000 edition.
(2005), with approved barriers of different type and TL. Barriers approved for use in the U.S. are considered acceptable in Canada for the equivalent PL as defined by the FHWA in Table 2-1.
2.3.2 Governing Codes
2.3.2.1 Manual for Assessing Safety Hardware (MASH) 2009
The MASH (2009) is based on the same worst practical conditions philosophy as the initial crash test document, HRB Circular 482. The idea is to create crash testing criteria that simulate extreme impact conditions that may occur over the lifetime of a barrier system. For instance, the small vehicle is representative of the 2nd percentile lightest and the pickup truck is representative of the
90th percentile heaviest passenger vehicle. The impact speed, 100 km/h, and impact angle, 25°,
together approximate the 92.5th percentile of off-road impacts on high speed roadways.
Considering these crash test parameters together, the crash tests simulate extreme impacts for the lightest and heaviest passenger vehicles on the roadway. In addition, strategic critical impact
points are identified for each barrier type and configuration to test the weakest portion of the
barriers or areas of particular impact hazards. The critical impact points identified for rigid concrete barriers are at barrier joints and transitions between the rigid concrete barrier and potentially more flexible roadway barriers. Consideration is still given for practicality; the crash test criteria must allow for barrier types that are financially feasible.
The MASH (2009) maintained the 6 TL’s from the NCHRP Report 350, and the test level vehicle types and speed requirements are shown in Table 2-2. TL’s 1-3 modify impact speed criteria, and TL’s 4-6 vehicle type criteria. General descriptions of the test vehicle types and weights are listed in Table 2-3, and photos of the standard test vehicles are shown in Figure 2-7.
Table 2-2: Test Levels (MASH 2009) Test
Level Designation and Type Test Vehicle Speed km/h (mph) Angle (degrees) Test Conditions 1 1100C (Passenger Car) 2270P (Pickup Truck) 50 (31) 50 (31) 25 25 2 1100C (Passenger Car) 2270P (Pickup Truck) 70 (44) 70 (44) 25 25 3 1100C (Passenger Car) 2270P (Pickup Truck) 100 (62) 100 (62) 25 25
4 1100C (Passenger Car) 2270P (Pickup Truck) 10000S (Single-Unit Truck) 100 (62) 100 (62) 90 (56) 25 25 15 5 1100C (Passenger Car) 2270P (Pickup Truck)
36000V (Tractor-Van Trailer) 100 (62) 100 (62) 80 (50) 25 25 15 6 1100C (Passenger Car) 2270P (Pickup Truck)
36000T (Tractor-Tank Trailer) 100 (62) 100 (62) 80 (50) 25 25 15 Table 2-3: Vehicle Gross Static Mass Upper and Lower Limits (MASH 2009) Test Vehicle Designation and
Type Target Vehicle Weight, kg (lb.) Acceptable Variation, kg (lb.)
1100C (Passenger Car) 1 100 (2 420) ± 25 (55)
1500A (Passenger Car) 1 500 (3 300) ± 100 (220)
2270P (Pickup Truck) 2 270 (5 000) ± 50 (110)
10000S (Single-Unit Truck) 10 000 ( 22000) ± 300 (660) 36000V (Tractor-Van Trailer) 36 000 (79 300) ± 500 (1 100) 36000T (Tractor-Tank Trailer) 36 000 (79 300) ± 500 (1 100)
a) 1100C Passenger Car b) 2270P Pickup Truck
c) 10000S Single-Unit Truck d) 36000V Tractor-Van Trailer Figure 2-7: Standard Crash Test Vehicle Types (TAC ATC 2010)
A notable change in the crash test matrix between the MASH (2009) and NCHRP 350 (1993) is the SUT test for TL-4. In Report 350, the SUT had a specified weight and impact speed of only 8000 kg and 80 km/h. The modification was necessary because the TL-4 test in Report 350 had a lesser impact severity (IS), a measure of impact energy, than its TL-3 test. The MASH has fixed this logical incoherence (Figure 2-8). The IS for TL-3 has also been increased from the NCHRP Report 350.
The evaluation criteria in the MASH (2009) have become more precisely defined and quantifiable. Like the NCHRP Reports 230 and 350 (1980, 1993), three criteria are used to assess a full scale impact:
1. Structural Adequacy 2. Occupant Risk
3. Post-impact Trajectory
The barrier structural adequacy refers to the containment and redirection of the crash test vehicle. The primary function of a barrier is to maintain a vehicle on the roadway. The vehicle should also remain stable and return to the roadway with a maximum of 75° pitch and roll angles. Heavy trucks may rollover on their side during a successful crash test. The reason for this discrepancy is that crash data does not indicate the strong causal link between rollover and fatality for heavy trucks as it does for passenger vehicles.
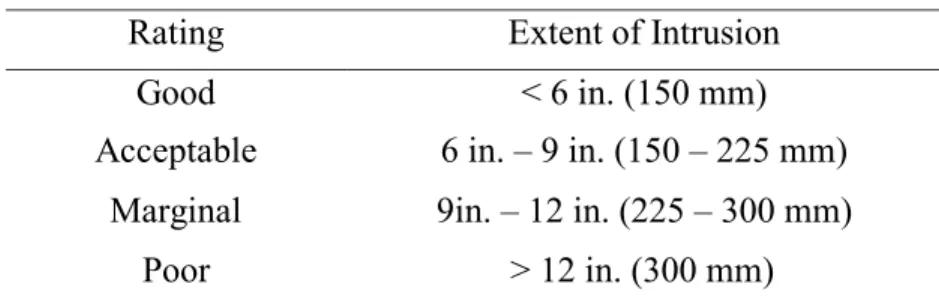
The occupant risk is considered in terms of penetration or excessive deformation of the vehicle occupant compartment, and the theoretical occupant impact velocity (OIV) and subsequent ride down acceleration. The theory is based on two concepts. The first is that penetration of barrier components into the vehicle can often prove fatal during high speed accidents and must be avoided at all costs. Likewise, if the occupant compartment deforms too severely during impact there is a much higher risk of fatalities. The extent of allowable intrusion is shown in Table 2-4, however specific limits are also provided for certain high risk components, such as the roof, windshield, and windows.
Table 2-4: Occupant Compartment Intrusion Ratings (MASH 2009)
Rating Extent of Intrusion
Good < 6 in. (150 mm)
Acceptable 6 in. – 9 in. (150 – 225 mm) Marginal 9in. – 12 in. (225 – 300 mm)
Poor > 12 in. (300 mm)
The second concept is the theoretical limits of OIV and vehicle ride down accelerations. This was introduced in NCHRP Report 230 (1980) and has been shown to be a relatively good measure of
impact risk. The idea is that the occupant will have an initial impact within the occupant compartment during impact, and then go through ride down accelerations. If the OIV and ride down accelerations are below a certain threshold criteria, the occupants are less likely to be critically injured. The OIV is simply the integral of the horizontal (x) and longitudinal (y) accelerations from the beginning of vehicle impact until occupant impact at time t*. And the ride down is the greatest average vehicle acceleration in the x and y directions after time t*. The acceleration is averaged over a 0.01 s time interval because accelerations that are less than 0.007 s in length are typically not injurious to occupants. Time of occupant impact, t*, is found by taking the double integral of the lateral and longitudinal accelerations and finding the smallest time for either the lateral movement to reach 0.6 m or the longitudinal movement to reach 0.3 m. The MASH (2009) provides a maximum threshold and recommended limit for both the OIV and ride down acceleration (Table 2-5). The vertical accelerations are not considered because passenger vehicles must always remain upright and therefore vertical accelerations are seen as less critical.
Table 2-5: OIV and Ride down Acceleration (MASH 2009) Occupant Impact Velocity, m/s (ft/s)
Component Preferred Maximum
Longitudinal, Lateral 9.1 (30) 12.2 (40)
Occupant Ride down Acceleration, G
Component Preferred Maximum
Longitudinal, Lateral 15 20.5
The post-impact trajectory is an effort to minimize the risks of a subsequent collision between the impacting vehicle and other vehicles or objects on the roadway. Ideally, the impacting vehicle will not rebound into adjacent or opposing lanes of traffic. MASH (2009) has adopted the exit
box criterion directly from European norms. The idea is that when the crash test vehicles remain
within a conceptual exit box after barrier impact, then they are unlikely to pose a high risk of secondary collisions during actual accidents. The exit box dimensions are based off of the vehicle type and geometry (length and width). The concept and dimensions are shown in Figure 2-9.