POLYTECHNIQUE MONTRÉAL
affiliée à l’Université de MontréalDevelopment of a New Building Integrated PV-Thermal Solar Module
AUSTIN SAMSON MYLES
Département de génie métallurgique
Thèse présentée en vue de l’obtention du diplôme de Philosophiae Doctor Génie métallurgique
Août 2019
POLYTECHNIQUE MONTRÉAL
affiliée à l’Université de MontréalCette thèse intitulée :
Development of a New Building Integrated PV-Thermal Solar Module
présentée par Austin Samson MYLES
en vue de l’obtention du diplôme de Philosophiae Doctor a été dûment acceptée par le jury d’examen constitué de :
Sylvain TURENNE, président
Oumarou SAVADOGO, membre et directeur de recherche Mureithi NJUKI, membre
DEDICATION
My humble effort I dedicate to my late parents who provided me good basic education, values and upbringing in difficult times to achieve success in life. I am fulfilling their dreams to go for higher education.
ACKNOWLEDGEMENTS
Firstly, I would like to express my sincere gratitude to my advisor Prof. Oumarou Savadogo for his continuous support and motivation during my Ph.D. study and related research. His guidance was invaluable for my research, fabrication, BIPV-T prototype testing, and authoring this thesis. I could not have imagined having a better advisor and mentor for my Ph.D. study. Prof. Savadogo made himself available even on weekends and holidays for any clarifications I needed.
I am also very grateful to Prof. Sylvain Turenne, Professor, Polytechnic Montreal, President of Jury; Kamal Haddad, Ph.D., Professor, ETS, External Member of Jury; and Jean Koclas, Professor, Polytechnic Montreal, Member of Jury for their constructive advice, insightful discussions and suggestions during my pre-doctoral presentation.
I would like to express my special appreciation to Mr. Ajoy Das, Owner of the Centennial Group of companies, for sponsoring my PhD study at Polytechnic, and providing the photovoltaic panels for fabricating the BIPV-T module and the outdoor testing equipment. He also paid for the fabrication and any required travel.
Besides my advisor and sponsor, I would like to thank my fellow colleagues Daniel Kalufya Mukalayi, Pengyu Chen, Ulrich Compaore, Fabrice Kabore and Diego Garcia who helped me to set up the outdoor test facility and test the BIPV-T prototype on many sunny days. My gratitude to my newest colleague Mina Dadvand for making a 3D autocad drawing for my project.
My sincere thanks also go to Kentaro, Research Associate in my department, for helping me procure raw material, software, and other equipment. I also thank him for getting approval for suitable indoor laboratory space and outdoor sunny space for testing.
I also thank Ms. Veronique Delisle, Research Officer at Canmet Energy, Varennes, for providing me support in using TRNSYS software and sending me clarifications when required.
I will forever be thankful to my former colleague Prakash Magal from Bangalore India who helped me fabricate my second working model – the improved BIPV-T module.
RÉSUMÉ
Les caractéristiques des modules solaires PV sont déterminées dans les conditions normales d’essai (STC) avec une température ambiante de 25°C. Toutefois, dans les conditions de fonctionnement, la température normale d’opération de la cellule (NOCT) est généralement supérieure de 20°C au-dessus de cette température ambiante. Ceci fait que dans les conditions réelles le module délivre une puissance inférieure à sa valeur nominale. Cette diminution est généralement de - 0,4% par °C au-dessus des conditions STC. Dans les climats chauds, les températures des cellules solaires sont encore plus élevées, réduisant ainsi plus significativement l’énergie électrique de sortie des modules PV.
Lorsqu’un module photovoltaïque est en contact direct avec le toit ou le mur d’un bâtiment, le refroidissement naturel par son revêtement arrière est impossible; ce qui engendre une augmentation de sa température. Dans ce cas, lorsque la température ambiante est de 25°C, la température d’opération de la cellule est de 45°C (NOCT) et le fait que les cellules soient en contact direct avec le toit ou le mur fait de plus augmenter leur température de 18°C. Ainsi la température totale de la cellule est : 45 +18 = 63°C. Dans les climats plus chauds, la température de la cellule sera encore plus élevée, réduisant sensiblement la puissance de sortie.
Dans le passé, les chercheurs ont essayé de nombreuses matrices différentes pour refroidir les modules PV. Malheureusement, chacune de ces configurations provoque des températures non uniformes par cellule à travers le module PV, ce qui permet d’obtenir moins d’avantages sur la performance du module. Comme l’eau traverse le tuyau de refroidissement, il ramasse la chaleur cellule par cellule. Par conséquent, la température des cellules près de l’entrée est inférieure à celle des cellules près de la sortie du tuyau.de refroidissement. La répartition précise de la chaleur dépend de la configuration du tuyau de refroidissement. Des températures plus élevées à une cellule conduisent à la fois à une diminution de la tension à la cellule et à une augmentation beaucoup plus faible du courant généré à cette cellule. Ceci est dȗ au fait que toutes les cellules sont connectées en série; et de ce fait, la cellule ayant la température la plus basse détermine le courant de sortie final du module. Cela réduit donc l’efficacité énergétique de l’ensemble du module solaire. Le nouveau concept de refroidissement discuté ici vise à maximiser la puissance de sortie d’un panneau PV en refroidissant uniformément les cellules. La chaleur extraite sous forme d’eau
chaude est limitée au refroidissement par passage unique dans chaque cellule solaire, car la recirculation augmentera la température des cellules solaires.
Le concept de photovoltaïque intégré au bâtiment (BIPV-T) thermique (PV-T) n’est pas nouveau, mais ces dernières années ses applications pratiques deviennent populaires. Les modules cristallins demeurent la technologie photovoltaïque dominante, représentant plus de 90% de la production et de l’utilisation dans le monde entier. Malgré une augmentation massive de la capacité de production, les prix des modules photovoltaïques pour les consommateurs demeurent élevés. De plus, au cours des 40 dernières années, l’efficacité commerciale des cellules photovoltaïques cristallines les plus largement produites a augmenté à un rythme lent, passant de 13% en 1979 à 22% en 2018, soit seulement 0,23% par an. Au cours des 10 dernières années, même avec le meilleur effort de l’industrie photovoltaïque, l’efficacité des cellules polycristallines a augmenté seulement de 4%.
Une exigence essentielle pour l’efficacité PV est que les cellules dans un module se comportent uniformément. L’industrie photovoltaïque passe par de grandes longueurs pour assurer ceci:
1. Premièrement, les cellules solaires sont triées pour collecter ceux générant la même sortie de courant dans des conditions normales d’essai;
2. en outre, après que les cellules sont connectées en série pour un module, elles sont testées pour l’uniformité utilisant une machine d’électro-luminescence en forçant le courant nominal par le circuit. Toutes les cellules dépareillées, qui peuvent être dues à des fissures ou à une mauvaise soudure, sont fixées avant que les cellules solaires soient stratifiées au verre trempé;
3. Enfin, un autre test d’électro-luminescence est effectué après laminage.
Une telle validation stricte est exigée pour assurer le fonctionnement approprié de champ puisque les cellules solaires défectueuses générant le courant le plus bas peuvent surchauffer et délaminer en absorbant le courant généré par d’autres cellules dans un module ou dans un champs de modules connectés en série. Ces types de défaillance dans un système installé sont très coûteux à remplacer ou à réparer.
La température est un autre facteur impactant l’efficacité du PV. Il est bien connu que la puissance de sortie des modules PV diminue de façon spectaculaire à mesure que sa température augmente.
Les modules solaires évalués à 25°C fonctionnent à des températures beaucoup plus élevées dans les conditions réelles du terrain; par conséquent, il y a une baisse substantielle de la puissance de sortie @-0,46%/K (fiche technique du module SolarTech)
De nombreux établissements d’enseignement et industries ont conçu des configurations de circuits de refroidissement de l’eau pour les modules photovoltaïques pour augmenter l’efficacité par unité de surface du module. Cependant, ces conceptions entrainent des variations de température à travers un module PV induisant ainsi des performances inégales pour les cellules. Plus précisément, dans les systèmes BIPV-T réels, comme l’eau traverse le module solaire dans les configurations existantes de tuyaux d’eau froide, il capte la chaleur. Les cellules ne sont pas refroidies uniformément.
Par conséquent, les cellules solaires près de l’entrée sont les plus froides, tandis que celles près de la sortie ont une température plus élevée. Les cellules plus chaudes perdent de la tension de façon significative et génèrent ont une très faible augmentation de leur courant. Comme les cellules sont connectées en série dans un module, la tension d’un module est limitée par le nombre de cellules à la température la plus élevée, réduisant ainsi l’efficacité globale du module et la puissance dans la plage de 8 -20% en fonction de la valeur de la température ambiante. Ceci indique qu’il est très important de refroidir le module PV efficacement pour garder ses performances. Pour surmonter ce problème, cette étudie suggère un nouveau circuit de refroidissement de l’eau pour les modules BIPV-T pour assurer un refroidissement individuel uniforme de toutes les cellules solaires dans un module.
Les objectifs de cette étude sont les suivants:
• Développer un nouveau module BIPV-T dans lequel chaque cellule d’un module PV est refroidie uniformément;
• Effectuer des études de simulation sur l’efficacité thermique et électrique d’un tel module BIPV-T;
• Concevoir et fabriquer un prototype du module BIPV-T qui respecte les normes de l’industrie photovoltaïque;
Ce travail de recherche développe le concept et la fabrication d’un prototype d’un nouveau module solaire photovoltaïque-thermique (BIPV-T) intégré au bâtiment (collecteur). Le concept propose le refroidissement uniforme individuel de chaque cellule solaire dans un module avec de l’eau pour améliorer les performances des modules photovoltaïques (PV). Une étude de simulation a été réalisée à l’aide du logiciel TRNSYS qui montre une amélioration jusqu’à 11% par rapport au module sans refroidissement et une amélioration de plus de 4% des performances si des cellules individuelles pouvaient être refroidies uniformément par rapport à un refroidissement non uniforme. Sur la base de l’analyse de nos résultats de simulation, un nouveau concept de fabrication de tuyauterie de refroidissement (échangeur de chaleur) est proposé. Ceci améliorera la performance par rapport au refroidissement en série des modules BIPV-T utilisé conventionnellement. Cela contribuera à ouvrir une nouvelle conception de la technologie photovoltaïque basée sur le module BIPV-T proposé.
Un module photovoltaïque-thermique pour l’intégration du bâtiment BIPV-T a été conçu avec un nouveau circuit de refroidissement pour un refroidissement uniforme des cellules solaires. L’analyse TRNSYS révèle un gain de 4,35% d’amélioration de l’efficacité par rapport au module sans refroidissement et jusqu’à 10,58% d’amélioration de l’efficacité électrique du module PV si refroidi uniformément. Le nouveau module BIPV-T a fourni une efficacité thermique supplémentaire de 48,3% en collectant de la chaleur de l’eau de refroidissement.
Dans cette étude, la conception, la fabrication et le test du modèle réel d’un module photovoltaïque de 140 W, 36 cellules avec un nouveau circuit de refroidissement de tuyau sont discutés. L’évaluation des performances du module a l’intérieur et a l’extérieur est presentée. Les essais à l’intérieur ont montré une uniformité de température de 2,1°C tandis que les performances à l’extérieure ont, montré une uniformité de 6 à 8°C due au refroidissement des cellules solaires individuelles. Une amélioration de plus de 4% dans les performances électriques du module PV a été observée. Un second prototype amélioré a obtenu une uniformité de 1.3°C même dans les essais extérieurs.
Une étude complémentaire de ce travail indique une amélioration de la conception de la nouvelle configuration des tuyaux de refroidissement pour le module BIPV-T. L’idée est de réduire sa hauteur et d’améliorer le transfert de chaleur entre les cellules solaires et le tuyau d’eau de refroidissement. Le nouveau design de refroidissement de l’eau est basé sur le refroidissement
indépendant des cellules solaires individuelles dans un module PV. Un modèle BIPV-T utilisant quatre cellules solaires à haut rendement a été fabriqué et testé à l’extérieur en plein soleil naturel. Même l’efficacité des cellules solaires commerciales les plus efficaces utilisées pour ce modèle diminue à des conditions de fonctionnement élevées. Le résultat montre une amélioration de 8.8% de la puissance de sortie par rapport à la puissance observée dans l’état de stagnation et l’efficacité électrique a augmenté de 0,92% lorsqu’il est refroidi par circulation d’eau. L’efficacité thermique supplémentaire de 57,4% a été obtenue en gain de chaleur par l’eau de refroidissement. L’amélioration de la conception de la nouvelle configuration de tuyauterie de refroidissement réduit le coût par un facteur de six, ce qui le rend attrayant pour la production commerciale.
ABSTRACT
This research work develops the concept and a prototype of a novel Building-Integrated Photovoltaic-Thermal (BIPV-T) solar module (collector). The concept proposes water cooling individual solar cells in a module uniformly to improve performance of photovoltaic (PV) modules. A simulation study was conducted using TRNSYS software that shows upto 11% improvement over module without cooling and 4.3% improvement in performance if individual cells could be cooled uniformly. Based on the analysis of our simulation results, a novel concept of a cooling pipe layout (heat exchanger) is proposed. This will improve the performance over conventionally used series cooling of solar cells in BIPV-T modules. This will help to open a new design of photovoltaic technology based on the proposed BIPV-T module.
A photovoltaic-thermal module for building integration BIPV-T was design with a novel cooling pipe circuit for uniform cooling of solar cells. The TRNSYS analysis reveals upto 4.35% efficiency improvement over module without cooling and upto 10.58% improvement in PV module electrical efficiency if cooled uniformly. The new BIPV-T module delivered additional 48.3% thermal efficiency by collecting heat in cooling water.
In this study design, fabrication and testing of actual field model of a 140W, 36 cell photovoltaic module with novel cooling pipe circuit is discussed and performance evaluated in indoor and outdoor condition has been presented. The indoor testing showed 2.1°C temperature uniformity while outdoor performance shows 6 to 8°C uniformity in cooling of individual solar cells. An improvement upto 5.7% in electrical performance of PV module was observed. Further improved second prototype achieved 1.3°C uniformity even in outdoor testing.
A subsequent study discusses an improvement in design of novel cooling pipe configuration for BIPV-T module. The idea is to reduce its height and improve heat transfer between the solar cells and the cooling water pipe. The novel water-cooling design is based on independent cooling of individual solar cells in a PV module. A BIPV-T model using four high efficiency solar cells was fabricated and tested outdoor in natural sunlight. Even the efficiency of the most efficient commercial solar cells used for this model drops at elevated operating conditions. The result shows 8.8% improvement in power output over power observed in stagnation condition and electrical efficiency increased by 0.92% when cooled by water circulation. Additional thermal efficiency
upto 57.4% was through heat gain in cooling water. The improvement in design of novel cooling pipe configuration reduces the cost by a factor of six, making it attractive for commercial production.
TABLE OF CONTENTS
DEDICATION ... iii
ACKNOWLEDGEMENTS ... iv
RÉSUMÉ ... v
ABSTRACT ... x
TABLE OF CONTENTS ... xii
LIST OF TABLES ... xv
LIST OF FIGURES ... xvii
LIST OF SYMBOLS AND ABBREVIATIONS... xxiii
LIST OF APPENDICES ... xxvii
CHAPTER 1 INTRODUCTION ... 1
CHAPTER 2 REVIEW OF LITERATURE ... 4
2.1 Water based cooling system design for PV-T and BIPV-T photovoltaic modules ... 4
2.2 Shortcomings in cooling configurations in photovoltaic modules ... 33
2.3 Conclusion ... 53
CHAPTER 3 OBJECTIVES AND THESIS ORGANIZATION ... 54
3.1 Thesis Objectives ... 54
3.2 Methodology ... 55
3.3 Thesis Organization ... 57
CHAPTER 4 ARTICLE 1: CONCEPT AND SIMULATION STUDY OF A NOVEL BUILDING INTEGRATED PHOTOVOLTAIC THERMAL (BIPV-T) SOLAR MODULE .... 59
4.1 Abstract ... 60
4.2 Introduction ... 60
4.3 BIPV-T Module Energy Balance Using Simulation Model and Experimental Input Parameters ... 61
4.4 TRNSYS Analysis... 65
4.4.1 Conventional BIPV-T Cooling Circuit Analysis ... 65
4.4.2 Concept and New Design of Cooling Water Circuit ... 70
4.5 Conclusion ... 74
4.6 References ... 75
CHAPTER 5 ARTICLE 2: DEVELOPMENT OF A NEW BUILDING INTEGRATED PV-THERMAL SOLAR MODULE ... 77
5.1 Abstract ... 78
5.2 Introduction ... 78
5.2.1 Classical considerations of thermal performance of BIPV-T module ... 80
5.3 Experimental procedure ... 83
5.3.1 BIPV-T module fabrication. ... 83
5.4 Outdoor Testing in Natural Sunlight ... 88
5.4.1 Test Set Up ... 88
5.4.2 Methodology ... 91
5.4.3 Measured and Derived Data ... 92
5.5 Temperature Uniformity Testing of Novel Cooling Pipe Configuration for BIPV-T Module ... 98
5.5.1 Indoor testing by circulating preheated water ... 98
5.5.2 Testing of uniformity in cooling of BIPV-T module in outdoor in sunlight ... 101
5.5.3 Graphical performance of temperature uniformity of 36 cells in a BIPVT module with novel cooling circuit ... 106
5.6 Improvement in Design of Novel BIPV-T Cooling Pipe ... 108
5.7 Results & Discussion ... 115
5.7.2 Second improved BIPV-T with novel cooling pipe configuration ... 117
5.8 Conclusion ... 118
5.8.1 First BIPV-T prototype with novel cooling pipe configuration ... 118
5.8.2 Second improved BIPV-T with novel cooling pipe configuration ... 119
5.9 References ... 119
CHAPTER 6 GENERAL DISCUSSION ... 122
CHAPTER 7 CONCLUSION AND RECOMMENDATIONS ... 124
7.1 Conclusion ... 124
7.2 Recommendations ... 125
LIST OF TABLES
Table 2-1 Nominal operating cell temperature (NOCT) for a residential roof installation [1] ... 5
Table 2-2 Variation of INOCT with standoff height. The standoff height is measured from the roof to the module frame [2] ... 6
Table 2-3 Comparison of current temperature coefficients for three different modules measured at NIST and SNL [7] ... 11
Table 2-4 Comparison of voltage temperature coefficients for three different modules measured at NIST and SNL [7] ... 11
Table 2-5 Thermal Efficiency of PV-Twin [8] ... 12
Table 2-6 Electrical Performance of PV-Twin [8] ... 12
Table 2-7 Test results of DualSun PV-T module [23] ... 30
Table 2-8: Electrical and Thermal performance [24] ... 32
Table 2-9 PV-T Solar Collector Characteristics [32] ... 44
Table 2-10 Summary of review of BIPV-T and PV-T modules and cooling pipe matrix ... 52
Table 4.1 Input parameters for simulation using TRNSYS software ... 64
Table 4.2 Performance of PV module at varying cooling water flow rates. The cooling is based on flowing cooling water over nine cells in a row versus individual solar cells using at 800W/m2 & 20°C ambient. ... 71
Table 4.3 Electrical & thermal efficiency of BIPV-T module for cooling by passing water over nine cells in a row versus individual cell cooling. ... 72
Table 5.1 Specification of BIPV-T Module Fabricated ... 87
Table 5.2 Outdoor test data of BIPV-T module in natural sunlight and analysis ... 94
Table 5.3 Derived results of outdoor test of BIPV-T module in natural sunlight and analysis ... 95
Table 5.4 Experimental results of the cell temperature of indoor testing of BIPV-T module with novel cooling pipe circuit at high cooling water flow rate ... 99
Table 5.5 Experimental results of the cell temperature of indoor testing of BIPV-T module with novel cooling pipe circuit at low cooling water flow rate ... 100 Table 5.6 Experimental outdoor data of BIPV-T module output, module temperature and
temperature uniformity tests without cooling ... 102 Table 5.7 BIPVT module electrical performance with 74.2 lit/hr cooling water circulation ... 103 Table 5.8 BIPVT Module Electrical Performance with 120.64 lit/hr cooling water circulation . 104 Table 5.9 Normalized of the MPP current in A/Wm2 of irradiance, MPP short circuit current/ Wm2 of irradiance and the MPP POWER/ Wm2 of irradiance are shown. ... 105 Table 5.10 Outdoor Performance of BIPV-T Module with Improvements in Cooling Pipe
Fabrication Methodology ... 111 Table 5.11 Outdoor performance of BIPV-T before incorporating cooling pipe and insulation . 112 Table 5.12 Solar Cell temperature uniformity in BIPV-T module at various flow rates and weather
conditions ... 114 Table 7-1 Electrical performance of graded solar cells (Ref.: Tongwei Solar Datasheet 2017) .. 130 Table 7-2 Solar cells grading and equivalent temperature manufactured by TW Solar ... 131
LIST OF FIGURES
Figure 2-1 Schematic representation of the thermal model [3] ... 7
Figure 2-2 The Combi-panel (a) Cross Section (b) Cooling Pipe Layout [4] ... 8
Figure 2-3 Cross section of the Combi panel. The material layers in the Combi-panel are indicated, as well as the temperatures and the various heat fluxes. The dashed line shows the temperature distribution over the surface of the panel [4] ... 8
Figure 2-4 Types of water PV-T collectors [6] ... 10
Figure 2-5 Alternative PV-T/dual design modes, used to determine the optimum arrangement of the water and the air heat exchanger [9] ... 13
Figure 2-6 BIPV-T thermal efficiency for varying collector material [10] ... 14
Figure 2-7 BIPV-T thermal efficiency for varying PV absorber conductivities [10] ... 15
Figure 2-8 Simplified diagram of new PV-T collector with: 1-Tempered glass; 2- Photovoltaic cells; 3-Tedlar; 4-The absorber; 5-Exit of the coolant; 6-Entry of the coolant; 7-Insulation. [11] ... 16
Figure 2-9 Main features of a flat-plate PV-T Collector [12] ... 17
Figure 2-10 Cross-section of some common PV-T water collector designs [12] ... 17
Figure 2-11 Thermal and electrical performance measurements of a typical glazed PV-T collector with c-Si as cell technology (a) and CdTe technology (b) [13] ... 18
Figure 2-12 Schematic direct flow PV-T ... 19
Figure 2-13 Schematic parallel flow PV-T diagram [14] ... 19
Figure 2-14 Schematic split flow PV-T diagram [14] ... 19
Figure 2-15 Electrical power production by the cost-effective PV-T module prototype and the same PV module under real environmental conditions [15] ... 20
Figure 2-16 Thermal and electrical efficiency curves of a typical PV–T collector for two different bonding methods [16] ... 21
Figure 2-18 Comparison of conventional photovoltaic panel temperature with the temperature of
the panel in the combined system [17] ... 23
Figure 2-19 Comparison of conventional photovoltaic panel electrical efficiency with the electrical efficiency of the combined system. [17] ... 23
Figure 2-20 Instantaneous efficiency curve for PowerTherm hybrid collector [18] ... 24
Figure 2-21 (a) PowerVolt and (b) PowerTherm PV-T collectors from Solimpiks [19] ... 25
Figure 2-22 Performance of PV-T module [20] ... 26
Figure 2-23 Spacing of risers of BIPV-T, at R=6 m2K/W [21] ... 27
Figure 2-24 PV cells temperature & efficiency without cooling [21] ... 27
Figure 2-25 BIPV-T Absorber pipe bond at R= 6 m2K/W [21] ... 28
Figure 2-26 Field Test Thermal Performance [21] ... 28
Figure 2-27 Test points for a liquid heater based on collector aperture area. [22] ... 29
Figure 2-28 Actual split flow absorber design [24] ... 32
Figure 2-29 Thin aluminum foil is placed on all copper tubes [24] ... 32
Figure 2-30 PV cell matrix arrangement and water circulation in PV-T module on the right and insulated back on the left [25] ... 34
Figure 2-31 SunDrum solar PV-T system thermal data [25] ... 34
Figure 2-32 (a) Infrared image of the PV-T collector with a fluid temperature of 55°C and an ambient temperature of 25°C (no solar irradiance). (b) PV-T collectors in real operation conditions and equivalent PV modules without heat exchanger, i.e. without cooling [26] ... 35
Figure 2-33 Thermography stagnation front side of DuelSun PV-T module [27] ... 36
Figure 2-34 Thermography stagnation back side of DuelSun PV-T module [27] ... 37
Figure 2-35 Temperature field: (a) Computational fluid dynamics (b) Infra-red measure [28] .... 38
Figure 2-36 Test at a minor-fault condition-Output characteristics and thermography [29] ... 39
Figure 2-38 Spiral flow design [30] ... 40
Figure 2-39 Oscillatory flow design [30] ... 41
Figure 2-40 Serpentine flow design [30] ... 41
Figure 2-41 Parallel-serpentine flow design [30] ... 41
Figure 2-42 Web flow design [30] ... 41
Figure 2-43 Modified serpentine-parallel flow design [30] ... 42
Figure 2-44 Flow rates configuration of various absorber collectors [30] ... 42
Figure 2-45 Section of cooling system [31] ... 42
Figure 2-46 (a) Captured image on the front surface of PV module, (b) Captured image on the back surface of PV module with disconnected water pump. [31] ... 43
Figure 2-47 Captured image on the back surface of PV module with connected water pump. [31] ... 43
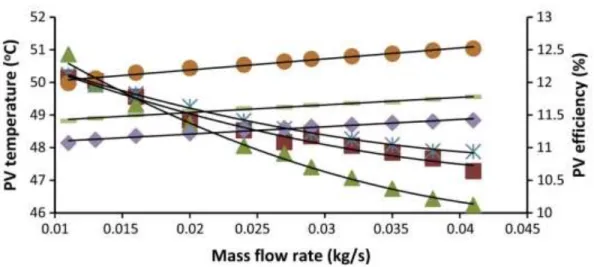
Figure 2-48 Changes in PV efficiency with the mean PV temperature of the PV-T absorber collector under 800 W/m2 of solar radiation. [32] ... 45
Figure 2-49 Combined power output of an uncovered serpentine PV-T collector [33] ... 46
Figure 2-50 Combined power output of a header riser PV-T collector [33] ... 46
Figure 2-51 Temperature comparison of temperature distribution for serpentine (left) and header riser (Right) uncovered absorbers at inlet temperature [33] ... 46
Figure 2-52 (a) PV panel and (b) PV-T collector. Temperature by thermal imaging camera [34] 47 Figure 2-53 Cross section of the PV-T solar Collector: (a) Traditional PV-T; (b) New PV-T. PET polyethylene terephthalate, EVA ethylene-vinyl acetate copolymer [35] ... 48
Figure 2-54 Effect of water mass in tank on the performance of PV-T collectors in simulation: (a) New PV-T; (b) Traditional PV-T [35] ... 49
Figure 2-55 Infrared thermographic image of the glass cover of the new PV-T (°C) [35] ... 49
Figure 2-56 Mono, Poly and Thin film crystalline Solar Cell efficiencies since 1977 [36] ... 51
Figure 4-2 Simulation results for 9 series connected Solar Cells in a 140W module at varying flow rates for 800W/m2 Solar Radiation, 20°C ambient temperature. ... 68 Figure 4-3 Simulation results of individual wattage of nine series connected Solar Cells at varying
cooling water flow rates for 800W/m2 solar radiation and 20°C ambient temperature ... 69 Figure 4-4 Individual Cell Cooling of 9 series cells using novel water cooling pipe layout. ... 70 Figure 4-5 Design of a 36 cell BIPV-T solar module with a novel cooling pipe layout. This
individual cooling system has never been developed before and it better perfornace than previous cooling system are not individually cooled. ... 73 Figure 5-1 Individual PV cell water cooling sketch (a) for 36 cell modules (b) for 60 and 72 cell
modules (only two rows are shown for explanation for new concept) ... 84 Figure 5-2 Conventional water cooling pipe design for (a) for 36 cell modules (b) for 60 and 72
cell modules (only two row are shown for explanation))... 85 Figure 5-3 Novel cooling pipe and attachment details at the back of PV module. It is well described
below. ... 86 Figure 5-4 Rear Denim Insulation, Back and Front of BIPV-T Module with Novel Cooling Pipe ... 87 Figure 5-5 Test set-up for performance evaluation ... 90 Figure 5-6 Outdoor Test Setup showing BIPV-T Module ... 91 Figure 5-7 Measuring Temperature of Individual Solar Cells using Infra-red Temperature Meter ... 91 Figure 5-8 Cooling water flow rate vs. Cell temperature and BIPV-T efficiency ... 96 Figure 5-9 Thermal efficiency vs. Thermal loss coefficient (Tm – Ta)/G ... 97
Figure 5-10 Indoor testing of novel water-cooling pipe configuration for temperature uniformity ... 98 Figure 5-11 Vertical column-wise temperature variation in solar cells for BIPV-T module in indoor
Figure 5-12 Horizontal row-wise temperature variation with solar cell number for BIPV-T module
in indoor testing (for 36 cell module) ... 101
Figure 5-13 BIPV-T module outdoor electrical performance in stagnation state (without water cooling) ... 102
Figure 5-14 Experimental results of BIPV-T module electrical performance at low water cooling rate (74.2 litres/hour) ... 103
Figure 5-15 Experimental BIPVT module electrical performance at high cooling water circulation rate (120.64 litres/hour) ... 104
Figure 5-16 Vertical column-wise temperature of solar cells at various flow rates in BIPVT module ... 106
Figure 5-17 Vertical column-wise temperature differential of solar cells at various flow rates in BIPVT module ... 106
Figure 5-18 Horizontal row-wise temperature of solar cells at various flow rates in BIPVT module ... 107
Figure 5-19 Horizontal row-wise temperature differential of solar cells at various flow rates in BIPVT module ... 107
Figure 5-20 View of novel cooling pipe configuration attached to copper plate ... 108
Figure 5-21 Picture of front and back of BIPV-T module model ... 109
Figure 5-22 Set-up for outdoor testing of small BIPV-T module ... 110
Figure 5-23 Voltage, current & power curve of BIPV=T in Natural Sunlight without cooling .. 113
Figure 5-24 BIPV-T Performance at Varying Cooling Flow Rates ... 113
Figure 5-25 Thermal and electrical efficiencies versus Thermal loss coefficient [(Tm – Ta)/G, K.m2/W] ... 114
Figure 5-26 Electrical performance of BIPV-T module at various cooling-water flow rates ... 115
Figure 7-1 Solar cells testing and sorting based on ampere output ... 132
Figure 7-3 Electro-luminescence tester ... 133 Figure 7-4: Bad solar module ... 133 Figure 7-5 Good solar module ... 133 Figure 7-6 Thermography by Drone for large photovoltaic installation ... 134
LIST OF SYMBOLS AND ABBREVIATIONS
β - [degrees] The slope of the collector surface. η - [0..1] Efficiency.
θ - [degrees] The angle of incidence. ρ - [0..1] The ground reflectance.
τα - [0..1] The transmittance-absorptance product for the solar collector. ε - [0..1] The emissivity of the top surface of the collector (PV surface). σ - [constant] The Stefan-Boltzmann constant.
λ- [m] The thickness of the absorber plate.
Area - [m2] The area (top) of the solar collector; this can be either gross area or net area but
should be consistent with the provided loss coefficients and PV power conversion coefficients.
b0 - [-] The incidence angle modifier multiplier.
Cp - [kJ/kg.K] The specific heat of the fluid flowing through the PV-T collector.
CB - [kJ/hr.K] The conductance between the absorber plate and the bonded tube.
Dtube - [m] The diameter of the tubes.
FR - [-] The collector heat removal factor.
G - [kJ/hr.m2] The total horizontal solar radiation.
Gb - [kJ/hr.m2] The beam solar radiation.
Gd - [kJ/hr.m2] The ground reflected solar radiation.
Gref – The solar radiation at reference condition (1000W/m2 for PV cells and modules).
Gt - [kJ/hr.m2] The total solar radiation (beam + diffuse) incident upon the collector surface.
hfluid - [-] The internal fluid heat transfer coefficient.
hinner - [kJ/hr.m2.K] The heat transfer coefficient from the back of the collector to the air.
houter - [kJ/hr.m2.K] The heat transfer coefficient from the top of the collector (PV surface) to the ambient air.
hrad - [kJ/hr.m2.K] The radiative heat transfer coefficient from the top of the collector (PV
surface) to the sky.
IAM - [-] The incidence angle modifier.
K - [kJ/hr.m.K] The thermal conductivity of the plate material.
Kτα – Incidence angle modifier coefficient.
L - [m] The length of the collector along the flow direction.
m - [kg/hr] The flow rate of fluid through the solar collector.
Ntubes - [-] The number of identical tubes carrying fluid through the collector. Power - [kJ/hr] The rate at which electrical energy is produced by the PV cells.
Qloss,top,conv - [kJ/hr] The rate at which energy is lost to the ambient through convection off the top of the collector.
Qloss,top,rad - [kJ/hr] The rate at which energy is lost to the sky through radiation off the top of the collector.
Qloss,back - [kJ/hr] The rate at which energy is lost to the ambient through the back of the collector.
Qfluid - [kJ/hr] The rate at which energy is added to the flow stream by the collector, this term includes the energy that is also lost from the fluid stream through the back of the collector.
Qabsorbed - [kJ/hr] The net rate at which energy is absorbed by the collector plate (does not include PV power production).
Qu - [kJ/hr] The rate at which energy is added to the flow stream by the collector.
q’fin - [kJ/hr.m] The heat transfer to the fin base per unit length of collector.
q’fluid - [kJ/hr.m] The heat transfer to the fluid stream per unit length of collector.
q’u - [kJ/hr.m] The heat transfer to the fluid stream per unit length of collector.
Rt - [h.m2.K/kJ] The resistance to heat transfer from the PV cells to the absorber plate.
Rb - [h.m2.K/kJ] The resistance to heat transfer from the absorber through the back of the collector.
R1 - [h.m2.K/kJ] The resistance to heat transfer provided by the material between the PV cells and the absorber.
R2 - [h.m2.K/kJ] The resistance to heat transfer provided by the material between the absorber plate and the back surface of the collector.
S - [kJ/hr] The net absorbed solar radiation (total absorbed PV power production).
Tabs - [°C] The absorber plate temperature.
Tamb - [°C] The ambient temperature for convective losses from the top surface.
Tback - [°C] The environment temperature for convective losses from the bottom surface.
Tfluid - [°C] The bulk temperature of the fluid flowing through the solar collector.
Tfluid,in - [°C] The temperature of the fluid flowing into the solar collector.
Tfluid,out - [°C] The temperature of the fluid flowing out of the solar collector.
Tfluid - [°C] The local fluid temperature.
TPV - [°C] The PV cell temperature.
Tsky - [°C] The sky temperature for long-wave radiation calculations. 𝑇̅ - [°C] The mean temperature.
W - [m] The width (x-direction) between adjacent fluid tubes in the collector.
Width - [m] The width of the collector.
XCell Temp - [1/°C] The multiplier for the PV cell efficiency as a function of the cell temperature.
XNS - [-] The multiplier to account for collectors connected in series (thermally).
XRadiation - [h.m2/kJ] The multiplier for the PV cell efficiency as a function of the incident radiation.
Y - [-] A variable indicating the direction of flow through the collector (y=L is the collector
outlet). Subscripts: B - beam radiation D - diffuse radiation G - ground diffuse G - radiation
H - total horizontal
N - normal incidence
nominal - refers to the reference conditions
PV - photovoltaic
S - sky diffuse
Ttotal - (beam + diffuse)
Abbreviations:
ASHRAE American Society of Heating, Refrigerating and Air-Conditioning Engineers BIPV Building-integrated photovoltaics
BIPV-T Building-integrated photovoltaics with thermal energy recovery IEC International Electrotechnical Commission
I-V Current-Voltage
NIST National Institute of Standards and Technology NOCT Normal Operating Cell Temperature
INOCT Installed Normal Operating Cell Temperature pc-Si Polycrystalline silicon
I-V Current-Voltage PV Photovoltaic
PV-T Photovoltaic with thermal energy recovery SNL Sandia National Laboratories
STC Standard Testing Condition
TESS Thermal Energy System Specialists TRNSYS Transient System Simulation Program
LIST OF APPENDICES
APPENDIX A SORTING OF SOLAR CELLS ... 130 APPENDIX B ELECTRO-LUMINESCENCE (EL) TESTER ... 133 APPENDIX C DRONES FOR DETECTING DEFECTIVE SOLAR MODULES ... 134
CHAPTER 1
INTRODUCTION
Solar energy can be converted through two technologies. The thermal conversion which allows solar heat to thermal energy. The photovoltaic (PV) technology which permits the direct conversion of solar light to electricity. The thermal conversion consists of solar collector, solar water heater and thermal heat exchangers. The thermal efficiency
𝜂TH= 𝑚̇𝐶𝑝(𝑇o− 𝑇i) 𝐺𝑇𝐴𝑐 (1)
Where, 𝐺𝑇 is the global irradiance on a collector aperture kW/m2 or kJ/(h·m²), 𝑚̇ is mass flow rate of fluid in lit/hr, Cp is specific heat of water 1calories/gram/°C or 4.1813 kJ/(kg.K), 𝑇o is the outlet temperature of fluid in °C or K, Ti is the inlet temperature of fluid in °C or K and 𝐴𝑐 is solar
collector area in m2.
The PV conversion is the utilisation of semiconductor based on p-n junction. The efficiency of PV module is given as
𝜂PV=
𝐼𝑉 𝐺𝑇𝐴𝑐
(2)
Where, I is the output current, V the output voltage and Ac is the aperture area of the solar module. The PV system is very sensitive to the temperature. Its performance decreases when temperature increases. This decrease of the performance is related to the production of heat. Accordingly, the PV module production can be significantly affected by the ambient temperature where it is installed.
With the significant progress in the utilization of PV modules worldwide, the installation capacity will rise from 3 GWp in 2010 to 22 GWp in 2020. It is, therefore, important to develop
1. Cooling system to decrease panel operating temperature.
2. To recover heat from PV module for some uses for example domestic hot water supply. PV modules are rated under Standard Test Conditions (STC) with an ambient 25°C solar cell temperature. In operating conditions however, the Normal Operating Cell Temperature (NOCT) is usually greater than 20°C above this ambient temperature so that the module delivers a lower power
than its rating – usually ~0.4% per °C above STC. In hot climates, solar cell temperatures are even higher, thereby decreasing the output electrical energy of PV modules further.
When a PV module is flush with the roof or wall of a building, its natural cooling from back of PV module is impeded, raising the temperature further: when the ambient temperature is 25°C, the solar cell temperature will increase to 45°C (NOCT) + 18°C = 63°C. In warmer climates, the cell temperature will be even higher, reducing the power output substantially.
In the past, researchers have tried many different matrixes for cooling PV modules. Unfortunately, each of these configurations causes non-uniform cell temperatures across the module thereby achieving less benefit. As the water traverses the cooling pipe, it picks up heat; consequently, the temperature of cells near the inlet is lower than that of cells near the exit of the pipe. The precise heat distribution depends on the cooling pipe configuration. Higher temperatures at a cell lead both to a decrease in voltage at the cell and a much smaller increase in the current generated at that cell; since all cells are connected in series the cell at the lowest temperature determines the final output current for the module. This consequently reduces the power efficiency of the entire solar module. The concept of Building-Integrated Photovoltaics-Thermal (BIPV-T) and Photovoltaic-Thermal (PV-T) is not new [1], but in recent years its practical applications are becoming popular. Crystalline modules remain to be the dominant PV technology, accounting for over 90% of the worldwide production and usage. Despite a massive increase in production capacity, prices of photovoltaic modules for consumers remain high. Moreover, in the last 40 years, the commercial efficiency of most widely produced crystalline PV cells has increased at a slow pace from 13% in 1979 to 22% in 2018, a mere 0.23% per year.
A critical requirement for PV efficiency is that cells in a module behave uniformly. The PV industry goes through great lengths to ensure this:
1. Firstly, solar cells are sorted to collect those generating the same current output under standard test conditions.
2. Furthermore, after the cells are connected in series for a module, they are tested for uniformity using an electro-luminescence machine by forcing rated current through the circuit. Any mismatched cells, which may be due to cracks or poor soldering, are fixed before the solar cells are laminated to the tempered glass.
3. Finally, another electro-luminescence test is performed after lamination.
Such stringent validation is required to ensure proper field operation since faulty solar cells generating the lowest current can overheat and delaminate by absorbing the current generated by other cells in a module or in an array of series-connected modules. Such kinds of failure in an installed system are very expensive to replace or repair.
Temperature is another factor impacting PV efficiency. It is well known that the power output of PV modules decreases dramatically as its temperature rises. Solar modules rated at 25°C operate at much higher temperatures in actual field conditions; consequently, there is a substantial drop in power output @-0.46%/K (SolarTech Module datasheet).
Numerous educational institutions and industries have designed configurations of water-cooling circuits for PV modules to increase efficiency per unit area of module. However, these designs result in temperature variations across a PV module thereby inducing uneven cell performance. Specifically, in the actual BIPV-T systems, as the water traverses the solar module in existing cool-water-pipe configurations, it picks up heat. The cells are not cooled uniformly. Consequently, solar cells near the inlet are the coolest, while those near the outlet have a higher temperature. Warmer cells lose voltage dramatically and generate little high current; but since cells are connected in series in a module, its voltage is limited by the number of cells at the highest temperature, thereby reducing the overall module efficiency and power in the range of 8-20% depending of the value of the ambient temperature. This indicates it is very important to cool the PV module efficiently to keep its performances. To overcome this problem, this study investigates a new water-cooling circuit for BIPV-T modules to ensure uniform cooling of all solar cells in a module.
The objectives of this study are to:
• Develop a new BIPV-T module in which each cell of a PV module is cooled uniformly; • Conduct simulation studies on the thermal and electrical efficiency of a such BIPV-T
module;
• Design and fabricate a prototype of the BIPV-T module which respects the PV industry norms;
CHAPTER 2
REVIEW OF LITERATURE
The review of literature covers the following aspects of this project:1. Water based cooling system design for PV-T and BIPV-T photovoltaic modules. 2. Short comings in cooling configurations in photovoltaic modules.
2.1 Water based cooling system design for PV-T and BIPV-T
photovoltaic modules
In this section various water-based cooling systems for PV-T and BIPV-T modules studied and analysed have been discussed since 1987. Some of the findings in these studies became the starting point of our BIPV-T project. In Section 2 of review shortcomings in various designs studied have been discussed.
Stultz [1] of Jet Propulsion Laboratory California Institute of Technology, Pasadena, California performed a study on photovoltaic modules on behalf of the Department of Energy, USA. The study included a temperature profile of photovoltaic modules in natural sunlight. It reported an operating temperature of 61.6°C for insulated roof-integrated photovoltaic modules. When cooled with water circulation, the photovoltaic module exhibited an increase in module efficiency. The Table 2-1 shows temperature rise ΔNOCT over normal operating cell temperature (NOCT) for roof installation of PV module in different mounting options. The insulated roof installation is similar to performance for BIPV mounting. This is a compelling situation for need to design a Building Integrated PV-Thermal (BIPV-T) module with cooling system to reduce the temperature. The photovoltaic-thermal (PV-T) module using Spectrolab module was tested on a hot summer day having 35℃ ambient. The module efficiency increased by approximately 0.83% an increase of 16% from uncooled module by circulating cool water at 23℃.
Table 2-1 Nominal operating cell temperature (NOCT) for a residential roof installation [1]
Case No. Configuration NOCT (°C) ΔNOCT* (°C)
Lincoln Laboratory Mounting
1 Module at center of roof (No flow beneath module)
55.5 9.5
2 Module at east/west edge of roof (Permits east-west air flow)
49.9 3.9
Modified Configuration
3 Sides closed, top/bottom edges open (Permits flow bottom to top)
50.8 4.8
4 All edges open (Permits flow in all directions) 49.4 3.4 Shingle Type Mounting (Hard mounted to roof)
5 Roof uninsulated 58.0 12.0
6 Roof insulated 61.5 15.5
*NOCT of this module is 46°C for the normal field installation.
This study was conducted to improve performance of PV module only and no thermal gain in heated water was measured. Therefore, this study lacks study on overall efficiency improvement by collecting warm water. However, it gives very important data showing increase in NOCT if PV modules are installed on roof top particularly an insulated roof.
Martin K. Fuentes [2] of Sandia National Laboratories, USA, published a report for roof-integrated photovoltaic modules. He reported astonishing findings, that Installed Nominal Operating Cell Temperature (INOCT) for a roof-integrated module (direct mounting without any gap) to be 17 to 20°C above Nominal Operating Cell Temperature (NOCT) measured at 800W/m2 solar intensity, 20°C ambient temperature and wind speed of 1m/second. The Table 2-2 shows installed operating temperature with zero gap between roof and back of PV panel as 66 to 68°C, whereas NOCT was measured between 48 to 49°C. This means power output of a Building-Integrated PV (BIPV) module rated at 25°C will drop substantially depending on its temperature derating factor.
Table 2-2 Variation of INOCT with standoff height. The standoff height is measured from the roof to the module frame [2]
Standoff height, inches (mm) INOCT (°C) INOCT – NOCT (°C)
0.0"* (0.00 mm) 68.1 20.0 0.0" (0.00 mm) 65.8 17.0 1.0" (25.40 mm) 59.8 11.0 3.0" (76.20 mm) 51.2 2.0 6.0" (152.40 mm) 48.1 -1.0 9.0" (228.60 mm) 46.1 -3.0
*Insulation was placed under the modules to simulate a worst-case situation.
This study too supports the need to use a cooling system for BIPV modules when flushed with the roof. This is the first time the effect of gap between roof and back of PV module on operating temperature was presented. It’s a very useful tool in designing a roof integrated PV system. This information is very useful in understanding the installed normal operating cell temperature (INOCT) which is applicable for BIPV modules.
M. Bakker, el al., published an internal study [3] on dual flow photovoltaic/thermal combi panel. They used a unique design of a hybrid photovoltaic thermal collector. As shown in Figure 2-1, they created a glass-topped enclosure for a photovoltaic laminate (an unframed solar panel) with a 2 mm gap around the laminate, creating a shell which acts as a heat exchanger into a cooling liquid. The panel is divided into three segments; for each segment a system of heat balance equation is solved.
The study concluded that despite its excellent thermal performance, the dual flow concept remained very heavy and fragile due to the large amounts of glass required, reducing its viability for large-scale applications. A modified concept with only one channel below the PV laminate, possibly in the form of a channel sheet, would greatly simplify the construction, yet retain a very high thermal efficiency.
Figure 2-1 Schematic representation of the thermal model [3]
Though PV-T modules with additional glass (glazing) proposed here will increase thermal performance by reducing losses, it is not recommended. If the cooling system stops on a hot sunny day, the temperature will rise above 130℃ which will melt the encapsulation material such as ethylene vinyl acetate (EVA).
Zondag H. A., et al., [4] built a 3D dynamic model and steady-state 1D, 2D and 3D models. A prototype combi module (PV-T) was also built Figure 2-2. The performance of the prototype was found close to the data generated by the model. The 1D model was found to be several times faster to obtain the results than 2D and 3D models; however, 2D and 3D models would be useful in more complicated combi panel designs. The cross-section of cooling pipe attached to module and heat flow is shown in Figure 2-2 (a) and (b). The Figure 2-3 shows heat flow from cooling water tube to solar cells.
(b)
Figure 2-2 The Combi-panel (a) Cross Section (b) Cooling Pipe Layout [4]
Figure 2-3 Cross section of the Combi panel. The material layers in the Combi-panel are indicated, as well as the temperatures and the various heat fluxes. The dashed line shows the temperature distribution over the surface of the panel [4]
The study claims 5% accuracy between experimental and modeling results. While thermal efficiency of 33% was obtained, the electrical efficiency of 6.7% was reported. However, this study has been conducted only for spiral flow cooling pipe configuration. This configuration will cause
every solar cell within a module to operate at different temperature causing mismatching. I do not recommend using this cooling circuit configuration.
Miroslav Bosanac, et al., [5] concluded that with the current technologies, the PV-T combination has a lower efficiency than two separate systems.
The survey conducted with various architects and several shortcomings were listed as follows: • In colder climate building requires heating in winter when solar gain is lowest.
• The module temperature must be higher than indoor air temperature leading to module temperature to operate at higher temperatures.
• Heat exchanger is necessary for antifreeze fluid that requires even higher module temperature for space heating.
• The PV-T module can get very hot due to back insulation that can cause damage if cooling fluid circulation fails.
• The fabrication of PV-T module is more complex than making PV and thermal collectors separately.
However, PV-T offers many advantages for which more R & D work is needed.
• The area occupied by PV-T modules is smaller for combined heat and electricity generation. • The economics of combined energy gain for PV-T module and systems will be better than
using two separate units for electricity and heat production.
• Installed look of PV-T integrated in the building will have better looks than using PV and thermal systems separately.
• The PV-T modules will have saving in installation costs as compared to separate PV and thermal collectors. This may be important point in commercialization.
• Direct use of low temperature produced by PV-T modules for swimming pools and for other uses in combination with heat pumps will have more acceptability.
This study is very well done, listing advantages and disadvantages of PV-T modules. One of the major missing advantage is using BIPV-T modules as building material for roof and façade. This application will offset cost of replacing roofing and façade material such as shingle and glass. The
other advantage of his design is that both air and water is heated while cooling the solar cells. The disadvantage of this design is that air will have much poor heat transfer to cool the PV-T module. In addition, flow path of both water and air is from one end to other that will cause cells to operate at different temperatures as the water and air pick up heat from cells along the cooling path. Charalambous, P.G., et al., [6] covered-flat-plate and concentrating water-based PV-T collectors. They discuss results on analytical and numerical models, and on simulation and experimental work and qualitative evaluation of thermal and electrical output of the flat-plate-based PV-T collector (Figure 2-4). Various parameters such whether the PV-T collector is covered or uncovered, mass flow rate, tube spacing, tube diameter, fin thickness and configuration designs are evaluated. The study suggests that uncovered PV-T produces the largest combined thermal and electrical energy. The paper concludes that PV-T efficiency and cost-effectiveness must be improved for their utilization.
Figure 2-4 Types of water PV-T collectors [6]
I agree that unglazed PV-T modules will have best combination of electrical and thermal energy. By placing a glass on top of PV-T module will increase the output temperature of cooling fluid but will cause the PV efficiency to fall. Accordingly, PV-T modules should not be used as solar thermal collectors. It can damage PV module due to overheating with time.
Fanney, et al., [7] describe the apparatus used to collect the experimental data, test procedure utilized and resulting parameters of three different solar modules. The measurements were done in two different laboratories with different climatic conditions, (Table 2-3 and Table 2-4). The
magnitude of current and voltage temperature coefficients between the two laboratories varied as much as 17% though impact of these on predicted performance through simulation was minimal, less than 2%. The study is based on an annual performance of solar modules instead of peak power at standard test condition (STC) of 1000W/m2, 25°C cell temperature and 1.5 air mass.
Table 2-3 Comparison of current temperature coefficients for three different modules measured at NIST and SNL [7] Mono Crystalline Mono Crystalline Silicon Film Silicon Film Triple Junction Triple Junction Short Circuit, A Peak Current, A Short Circuit, A Peak Current, A Short Circuit, A Peak Current, A NIST* 0.001753 -0.001543 0.004680 0.001600 0.005610 0.007350 SNL** 0.001496 -0.001722 0.004781 0.002000 0.006584 0.007498 *National Institute of Standards and Technology, **Sandia National Laboratories
Table 2-4 Comparison of voltage temperature coefficients for three different modules measured at NIST and SNL [7] Mono Crystalline Mono Crystalline Silicon Film Silicon Film Triple Junction Triple Junction Open Circuit, V Peak Voltage, V Open Circuit, V Peak Voltage, V Open Circuit, V Peak Voltage, V NIST* -0.152386 -0.153578 -0.12995 -0.13039 -0.0931 -0.04773 SNL** -0.1735 -0.1756 -0.1412 -0.1401 -0.1037 -0.05074
In recent years many software have been developed to predict the annual performance based of module performance at STC. While this study is good to compare annual energy production of solar modules, it cannot replace the need of the determination of modules performance at STC. Effectively, sun simulator used for testing of module at STC during production is fast and solar industry measured 100% of solar modules for quality control and grading of modules.
Ivan Katic [8] tested a PV-T module called PV-Twin (brand name) for performance evaluation. In this study a 230W photovoltaic panel with serpentine tube on copper was used as cooling from the rear. The PV-Twin module was insulated from the back and was cooled with water circulation. The testing was done in accordance with EN12975 standard. At 40°C mean temperature of cooling water the thermal efficiency of 54% was achieved whereas for 80°C mean temperature, the thermal efficiency dropped down to only 19% as shown in Table 2-5. The PV module delivered 146.3W at a 77°C module temperature as shown in Table 2-6. The calculated efficiency was only 8.99%, which was attributed to a partial defect in one of the quadrants. Nevertheless, the combined PV and thermal efficiency exceeds well beyond the efficiency of PV module if used alone.
Table 2-5 Thermal Efficiency of PV-Twin [8]
Tm≈ Data 1 Data 2 Data 3 Data 4
°C Tred η Tred η Tred η Tred η
40 0.0105 0.54 0.0097 0.53 0.0088 0.54 0.0091 0.54 60 0.0333 0.36 0.0285 0.37 0.0338 0.34 0.0379 0.34
80 0.0564 0.19 0.0472 0.25 - - - -
Note: Tred = (Tm – Ta)/G is the difference between mean water temperature and the ambient temperature divided by solar radiation and Tm is the mean temperature of inlet and outlet
temperature of cooling water.
Table 2-6 Electrical Performance of PV-Twin [8]
Data corrected to STC Measured values
Im0 A Um0 V Ppk W Isc0 A Uoc0 V Ipmax A Upmax V Pmax W Isc A Uoc V Rp kOhm Rs Ohm FF T °C E W/m2 7.00 32.8 229.6 8.17 44.6 5.85 25.0 146.3 6.83 34 >0.21 1.6 0.63 77.0 835 Where, Imo is current, Umo is voltage, Ppk is peak wattage Isc0 is short circuit current, Uoc0 is open circuit voltage at STC. Ipmax is current, Upmax is voltage, Pmax is power, Isc is short circuit current, Uoc is open circuit voltage, Rp is shunt resistance, Rs is series resistance, FF is fill factor, T is module temperature at E=835W/m2 radiation. PV-Twin is a brand name of PV-T module. It uses a serpentine attached to copper plate to cool the PV module from back. This is an example of PV module being misused primarily to extract heat by sacrificing electrical efficiency. The initial electrical efficiency based on testing STC was
14.11% (for 1.627m2 area for 230W PV module) which dropped down in PV-T mode to 8.99% a loss of electrical 5.12%. The thermal efficiency at mean temperature of 60°C obtained is 36% hence PV-Twin is assumed as satisfactory. The lower performance of electrical efficiency is attributed to defect in PV module rather than non-uniform cooling. In is anticipated that the long run solar cells in this PV-Twin will fail.
Y. Tripanagnostopoulos proposed three different methods for placing a water heat exchanger inside air channel (Figure 2-5). The purpose of Mode A, Mode B and Mode C was to study a design of PV-T module where thermal heat could be collected in the form of warm air as well as warm water. He concluded that placing the exchanger at the rear surface of module as shown in Mode A, performed the best for the combined water and air heat extraction from the PV module. According to the author, the design is cost effective for operation in low temperatures.
Figure 2-5 Alternative PV-T/dual design modes, used to determine the optimum arrangement of the water and the air heat exchanger [9]
All three Mode A, Mode B and Mode C are sharing the heat collection through air and water flow for cooling the module. It is obvious all three PV-T design cooling fluid flows from one end to the other of PV-T module which will cause temperature of cells at inlet to be lower than at outlet. The mismatching of cell output will still occur.
Anderson T., et al., [10], in their paper conducted a theoretical analysis of a novel Building-Integrated Photovoltaic/Thermal (BIPV-T) collector through the use of modified Hottel-Whillier model. They discussed how key design parameters influence the performance of BIPV-T collector. They concluded that thermal efficiency of BIPV-T made very little difference for the material used for constructing the BIPV-T collector as seen in Figure 2-6. The (Tin-Ta)/Gʺ is called inlet
parameter where Tin is inlet temperature in °C of cooling water, Ta is ambient temperature in °C
and Gʺ is solar radiation intensity in W/m2. This implies that cheaper material like steel could be
used for reducing the costs. They further concluded that good thermal contact between photovoltaic cells and the absorber plate is important and suggested use of thermally conductive adhesive to improve thermal contact. The Figure 2-6 shows performance of the BIPV-T for absorber based on stainless steel(304), steel(5% Cr), aluminum, copper which thermal conductivity is 24, 40, 240 and 400W/m.K. The Figure 2-7 shows the thermal efficiencies for varying absorber sheet conductivities of 45, 90, 135 and 180W/m.K used at the back of PV module for heat transfer.
Figure 2-7 BIPV-T thermal efficiency for varying PV absorber conductivities [10]
This study needs to be verified by making an actual prototype with different material and testing. The thermally conductive adhesive with conductivity ranging from 45 to 180W/mK to glue absorber at the back of PV module is not readily available. However, this study is based on serpentine water cooling tube attached to absorber plate and is focused on improving thermal performance. The serpentine cooling pipe the cooling water goes over all solar cells in a module that will cause non uniform cooling of solar cells and loss in electrical efficiency. The actual testing of product is required to prove the technical and economic viability of proposed design.
Touafek, et al., [11] fabricated a water-cooled PV-T collector using a galvanized channel at the back of PV module for water circulation as shown in Figure 2-8. For this design, they reported thermal efficiencies ranging between 50% and 80% depending on the time of the day. They achieved a 3°C temperature rise for inlet water temperature of 34°C and outlet water temperature of 37°C in ambient temperature of 33°C. They did not report the efficiency of the PV cell or module.
Figure 2-8 Simplified diagram of new PV-T collector with: 1-Tempered glass; 2- Photovoltaic cells; 3-Tedlar; 4-The absorber; 5-Exit of the coolant; 6-Entry of the coolant; 7-Insulation. [11] This article does not mention electrical output or efficiency of PV-T collector tested. The cooling flow is one end to other where solar cell temperature from one end to other will vary causing mismatching. The cooling water chamber below the module is impractical as weight of PV module will increase substantially on roof top. Moreover, the chamber has to be made really strong to hold weight of water.
T.T. Chow [12] reviewed the trend of development of photovoltaic-thermal technology. He covered the work done in recent years. The main feature of any PV-T design is shown in Figure 2-9. He concluded that different designs whose cross-sections are shown in Figure 2-10 suit different geographical locations needs. In colder climates PV-T systems are useful for electricity and year-round space heating, whereas locations with generous sunshine areas can use electricity and preheated water year around. He mentioned further that very few PV-T systems were commercially available at the time. The reliability and cost of commercial-available PV-T systems need to be addressed in cooperation between institutions and manufacturers to make significant contributions in the market.
Figure 2-9 Main features of a flat-plate PV-T Collector [12]
Figure 2-10 Cross-section of some common PV-T water collector designs [12]
The review of various flat plate PV-T collector designs and flow path show movement of cooling water from one end to other end of PV-T collectors. Similar to other designs the solar cells near the entry will remain cooler than at exit where water is warmer. All these designs will cause non-uniform cooling of solar cells resulting in mismatch.
Hofmann, et al., [13] proposed standardization of measurements of a PV-T collector and different measurement procedures. The paper illustrates indoor testing methods for PV-T collectors as seen in Figure 2-11(a) and (b). The author proposed performance of both Electrical and Thermal efficiency with respect to thermal loss coefficient (Tm-Tamb)/G. The mean temperature of inlet and
outlet temperatures is denoted as Tm in K and ambient temperature is denoted as Tamb in K and
(a) (b)
Figure 2-11 Thermal and electrical performance measurements of a typical glazed PV-T collector with c-Si as cell technology (a) and CdTe technology (b) [13]
Since PV-T and BIPV-T modules did not have an exclusive standard for testing, the proposed testing method is a good step forward [13]. However, the method described is for indoor testing using a sun simulator where atmospheric conditions and various parameters can be controlled and maintained through out the test. This method is good if performance of PV-T and BIPV-T modules are to be compared. It is impossible to achieve exact solar spectrum with sun simulator. This method required steady state sun simulator which is extremely expensive.
Sopian, et al., [14] conducted theoretical analysis of three PV-T water cooling circuit layout. They concluded that a Split flow PV-T collector design shown in Figure 2-14 has better performance compared to Direct flow and Parallel flow shown in Figure 2-12 and Figure 2-13. They reported a thermal efficiency of up to 51.8% but did not report the electrical efficiency of PV cells.
Figure 2-12 Schematic direct flow PV-T diagram [14]
Figure 2-13 Schematic parallel flow PV-T diagram [14]
The three designs analysed were based on thermal performance of PV-T modules. In all three cases the cooling water enters at first cell and exits after flowing over many cells to collect heat. It clearly shows, all solar cells along the flow path will have non-uniform temperature that will cause electrical mismatching. Moreover, solar cells on either side of junction box shown in black at the top are not even cooled and will operate at higher temperature. These designs will have maximum electrical mismatch between the first cell which receives the coldest water for cooling to last cell where the warm water exists. All cooling pipe configurations are commonly used in solar thermal collectors. The primary aim is to recover heat and increase overall efficiency of PV-T module. They have not address the important issue of mismatching which is important for PV modules. López, et al., [15] developed an innovative low-cost prototype of a PV-T module using pipes of a floor heating system filled with a special brine to cool the PV cells. The comparative performance of PV-T versus identical uncooled PV module of 130W is shown in Figure 2-15. The daylong testing from 8:30PM to 7PM on a clear sunny day showed 200 litres cold water temperature increased from 20°C to 24°C. A 6% increase in the electrical output in watt-hour was achieved though it is not as high as expected.
Figure 2-15 Electrical power production by the cost-effective PV-T module prototype and the same PV module under real environmental conditions [15]
![Table 2-2 Variation of INOCT with standoff height. The standoff height is measured from the roof to the module frame [2]](https://thumb-eu.123doks.com/thumbv2/123doknet/2341287.33901/33.918.96.822.178.453/table-variation-inoct-standoff-height-standoff-height-measured.webp)
![Figure 2-5 Alternative PV-T/dual design modes, used to determine the optimum arrangement of the water and the air heat exchanger [9]](https://thumb-eu.123doks.com/thumbv2/123doknet/2341287.33901/40.918.248.669.474.842/figure-alternative-design-modes-determine-optimum-arrangement-exchanger.webp)
![Figure 2-11 Thermal and electrical performance measurements of a typical glazed PV-T collector with c-Si as cell technology (a) and CdTe technology (b) [13]](https://thumb-eu.123doks.com/thumbv2/123doknet/2341287.33901/45.918.122.798.112.473/figure-thermal-electrical-performance-measurements-collector-technology-technology.webp)
![Figure 2-16 Thermal and electrical efficiency curves of a typical PV–T collector for two different bonding methods [16]](https://thumb-eu.123doks.com/thumbv2/123doknet/2341287.33901/48.918.273.641.583.916/figure-thermal-electrical-efficiency-typical-collector-different-bonding.webp)
![Figure 2-17 Representation of the front and rear side of the developed PV-T absorber [16]](https://thumb-eu.123doks.com/thumbv2/123doknet/2341287.33901/49.918.268.650.113.455/figure-representation-rear-developed-pv-t-absorber.webp)
![Figure 2-18 Comparison of conventional photovoltaic panel temperature with the temperature of the panel in the combined system [17]](https://thumb-eu.123doks.com/thumbv2/123doknet/2341287.33901/50.918.223.695.105.395/figure-comparison-conventional-photovoltaic-panel-temperature-temperature-combined.webp)
![Figure 2-27 Test points for a liquid heater based on collector aperture area. [22]](https://thumb-eu.123doks.com/thumbv2/123doknet/2341287.33901/56.918.252.665.744.1015/figure-test-points-liquid-heater-based-collector-aperture.webp)
![Figure 2-49 Combined power output of an uncovered serpentine PV-T collector [33]](https://thumb-eu.123doks.com/thumbv2/123doknet/2341287.33901/73.918.405.794.111.400/figure-combined-power-output-uncovered-serpentine-pv-collector.webp)
![Figure 2-54 Effect of water mass in tank on the performance of PV-T collectors in simulation: (a) New PV-T; (b) Traditional PV-T [35]](https://thumb-eu.123doks.com/thumbv2/123doknet/2341287.33901/76.918.132.807.204.426/figure-effect-water-tank-performance-collectors-simulation-traditional.webp)