HAL Id: hal-00329287
https://hal.archives-ouvertes.fr/hal-00329287
Submitted on 1 Jan 2003
HAL is a multi-disciplinary open access
archive for the deposit and dissemination of
sci-entific research documents, whether they are
pub-lished or not. The documents may come from
teaching and research institutions in France or
abroad, or from public or private research centers.
L’archive ouverte pluridisciplinaire HAL, est
destinée au dépôt et à la diffusion de documents
scientifiques de niveau recherche, publiés ou non,
émanant des établissements d’enseignement et de
recherche français ou étrangers, des laboratoires
publics ou privés.
Cusp structures: combining multi-spacecraft
observations with ground-based observations
K. J. Trattner, S. A. Fuselier, T. K. Yeoman, A. Korth, M. Fraenz, C.
Mouikis, H. Kucharek, L. M. Kistler, C. P. Escoubet, H. R’ Eme, et al.
To cite this version:
K. J. Trattner, S. A. Fuselier, T. K. Yeoman, A. Korth, M. Fraenz, et al.. Cusp structures:
combin-ing multi-spacecraft observations with ground-based observations. Annales Geophysicae, European
Geosciences Union, 2003, 21 (10), pp.2031-2041. �hal-00329287�
Annales
Geophysicae
Cusp structures: combining multi-spacecraft observations with
ground-based observations
K. J. Trattner1, 3, S. A. Fuselier1, T. K. Yeoman2, A. Korth3, M. Fraenz3, C. Mouikis4, H. Kucharek4, L. M. Kistler4,
C. P. Escoubet5, H. R`eme6, I. Dandouras6, J. A. Sauvaud6, J. M. Bosqued6, B. Klecker7, C. Carlson8, T. Phan8, J. P. McFadden8, E. Amata9, and L. Eliasson10
1Lockheed-Martin Advanced Technology Center, Palo Alto, California, USA 2Department of Physics and Astronomy, University of Leicester, UK 3Max-Planck-Institut f¨ur Aeronomie, Katlenburg-Lindau, Germany
4Institute for Study of Earth, Oceans and Space, University of New Hampshire, Durham, USA 5Space Science Deptment of ESA. ESTEC, Noordwijk, The Netherlands
6CESR, Toulouse, France
7Max-Planck-Institut f¨ur Extraterrestrische Physik, Garching, Germany 8University of California, Berkeley, CA, USA
9IFSI, Rome, Italy 10IRF, Kiruna, Sweden
Received: 29 November 2002 – Revised: 17 March 2003 – Accepted: 8 April 2003
Abstract. Recent simultaneous observations of cusp
struc-tures with Polar, FAST and Interball revealed remarkably similar features at spacecraft crossing the cusp. Such stable cusp structures could be observed up to several hours only during stable solar wind conditions. Their similarities led to the conclusion that for such conditions large-scale cusp struc-tures are spatial strucstruc-tures related to a global ionospheric convection pattern and not the result of temporal variations in reconnection parameters.
With the launch of the Cluster fleet we are now able to observe precipitating ion structures in the cusp with three spacecraft and identical instrumentation. The orbit config-uration of the Cluster spacecraft allows for delay times be-tween spacecraft of about 45 min in crossing the cusp. The compact configuration of three spacecraft at about the same altitude allows for the analysis of cusp structures in great de-tail and during changing solar wind conditions. Cluster ob-servations on 25 July 2001 are combined with SuperDARN radar observations that are used to derive a convection pattern in the ionosphere. We found that large-scale cusp structures for this Cluster cusp crossing are in agreement with struc-tures in the convection pattern and conclude that major cusp structures can be consistent with a spatial phenomenon.
Key words. Magnetospheric physics (energetic particles,
precipitating, magnetopause, cusp arid and boundary layers; solar wind-magnetosphere interactions)
Correspondence to: K. J. Trattner
(trattner@mail.spasci.com)
1 Introduction
Convincing evidence about magnetic reconnection between the interplanetary magnetic field (IMF) and the geomagnetic field has been accumulated with the observation of magne-tosheath ions in the boundary layer inside the magnetopause (e.g. Paschmann et al., 1979; Sonnerup et al., 1981) and precipitating ions in the cusp (e.g. Reiff et al., 1977; Es-coubet et al., 1997). The incoming magnetosheath distribu-tion is truncated as it crosses the magnetopause and only a limited part of the initial magnetosheath distribution is trans-mitted across the magnetopause. This truncated distribution has a characteristic D-shaped distribution that has been pre-dicted by Cowley (1982) and observed by, for example, Fuse-lier et al. (1991, 2000). Once reconnection occurred at the magnetopause, magnetosheath ions will stream continuously from the magnetosheath into the magnetosphere (e.g. Lock-wood and Smith, 1993, 1994; Onsager et al., 1993). Be-cause of the convection of the newly-opened magnetic field lines with the solar wind, spectra observed by a satellite in the cusp will have distinctive ion energy dispersions. Their appearance at an observing satellite will also depend on the satellite trajectory with respect to the convection direction. Rosenbauer et al. (1975) predicted that for reconnection of the geomagnetic field with a southward directed IMF, pre-cipitating ions observed at low altitudes in the cusp should exhibit a velocity filter effect with lower energy ions con-vecting further poleward. Such a dispersion was indeed ob-served by Shelley et al. (1976). Newell and Meng (1995)
pointed out that such a decline of the average ion energy in the cusp with increasing latitude also includes additional ef-fects. Plasma crossing the magnetopause close to the recon-nection site experiences an acceleration which progressively declines as magnetic field lines convect to higher latitudes away from the merging point. As the magnetic field lines straighten out, they continue to convect poleward because the field lines are embedded in the solar wind flow, and ion acceleration decreases and turns into deceleration poleward of the cusp. In addition, with increasing latitude the mag-netosheath velocity is increasingly directed away from the magnetosphere, causing fewer ions with progressively lower energy to make it down to the Earth’s ionosphere (Newell and Meng, 1991). Over the last two decades there has been a debate as to whether dayside reconnection is quasi-steady or transient (e.g. Newell and Sibeck, 1993; Lockwood et al., 1994 and the references therein). A smooth and continuous latitude dispersion in the cusp should be expected for a steady rate of reconnection at the magnetopause. However, satellite observations from this region show that the energy of precip-itating ions is rarely smooth and continuous with increasing latitude but show complicated structures with variations in flux levels and sudden changes in the energy of the precip-itating ions (e.g. Newell and Meng, 1991; Escoubet et al., 1992).
The existence of these steps in the ion energy dispersion, also known as “stepped” or “staircase” cusp ion signatures, has been predicted by Cowley et al. (1991) and Smith et al. (1992), based on a model by Cowley and Lockwood (1992) of how ionospheric convection is excited. In this pulsating cusp model (see also Lockwood and Smith, 1989; 1990), the cusp precipitation between the steps is the result of pulses of enhanced magnetopause reconnection. Steps are the result of changes in the reconnection rate at the magne-topause that creates neighbouring flux tubes in the cusp with different time histories since reconnection (e.g. Lockwood and Smith, 1994). A significant characteristic of temporal steps is their convection with the open magnetic field lines under the joint action of magnetic tension and shocked solar wind flow. This creates an ever-changing structural profile of precipitating cusp ions.
Satellites crossing the boundary between a newly-opened flux tube and an older (but still open) one would encounter a step-down in the ion energy dispersion, while satellites cross-ing from an older flux tube into a nearby opened one would see a step-up ion energy signature. The type of cusp structure encounter by a satellite in the cusp also depends, therefore, on the satellite velocity relative to the convection velocity of the cusp structure. In general, fast moving low-altitude satel-lites (e.g. FAST) will overtake cusp structures, moving from a newer flux tube to an older one, and encounter step-down structures in the ion energy dispersion. In turn, a slow mov-ing high-altitude satellite (e.g. Polar) will be overtaken by convecting cusp structures and, therefore, encounter step-up ion energy dispersions.
The pulsating cusp model was further supported by com-bining satellite observations with ground-based observations
from the EISCAT radar (see Lockwood, 1995; Lockwood et al., 1995; Neudegg et al., 1999; Milan et al., 2000; McWilliams et al., 2001). Convecting flux tubes caused by reconnection pulses would move along the convection flow. Therefore, the observation of flow across a step in the cusp ion energy dispersion revealed the temporal nature of cusp structures. These cusp structures, the result of temporal vari-ations of the reconnection rate at the magnetopause, are also discussed by Boudouridis et al. (2001). This model is based on the combination of the Bursty Single X-line Reconnec-tion Model, together with the Multiple X-line ReconnecReconnec-tion Model, to explain overlapping cusp steps observed by two DMSP spacecraft.
Flux tubes on open field lines with precipitating magne-tosheath ions could also be spatially separated, emanating from multiple X-lines. Crossing the boundary into such a spatially separated different flux tube would also appear as a step in the ion energy dispersion, due to the different time history since reconnection for field lines within the two flux tubes (Lockwood et al., 1995). However, this step would not be convected with the solar wind but would appear as a stand-ing feature in the cusp. Independent of the time delay be-tween the cusp crossings or the satellite velocities, the satel-lites should encounter unchanged cusp structures at about the same latitude, observing a spatial feature. Such an observa-tion would indicate that the reconnecobserva-tion rate at the magne-topause is rather stable and not highly variable, or even stops entirely for a limited period of time.
The appearance of spatial structures has been recently dis-cussed by Wing et al. (2001), who modeled cusp precipi-tation characteristics for periods with a dominant IMF By
component. For these conditions they found that a character-istic “double cusp” signature was not only predicted but also observed in DMSP satellite data.
Also using DMSP observations, Onsager et al. (1995) showed two cusp crossings of the high-altitude Dynamic Ex-plorer 1 (DE 1) and low-altitude DE 2 spacecraft separated by 20 min. A similar step in the ion dispersion signature at both spacecraft was interpreted as a spatial structure rather than a temporal variation of the reconnection rate. This event is especially interesting since the low-orbiting satellite en-countered an upward step. A temporal convecting cusp struc-ture would require the satellite to move along the open-closed field line boundary, to allow the convecting structure to over-take the low-altitude fast moving satellite. However, the ob-serving satellite was in a meridional orbit.
To avoid the ambiguity of single satellite observations in distinguishing between spatial and temporal effects, Trattner et al. (1999, 2002a, b) have used pairs of Interball-Polar and FAST-Polar satellites to investigate the temporal or spatial nature of the cusp structure. They found that stepped ion distributions during stable solar wind and IMF conditions are not consistent with the pulsed reconnection model. Two magnetic conjunctions in the cusp by Interball and Polar re-vealed complicated cusp structures that appeared to be stable and unchanged for 1.5 h (Trattner et al., 1999). In a subse-quent study, Trattner et al. (2002a) compared four cusp
cross-ings of Polar and FAST, separated in universal time (UT) and magnetic local time (MLT) of up to 5 h and up to 3 h, re-spectively. While individual cusp crossings for different so-lar wind conditions are very different, cusp crossings by two satellites during stable solar wind conditions are remarkably similar. Based on these observations Trattner et al. (2002a) concluded that the major cusp structures they examined are not the signature of pulsed reconnection but the result of spa-tially separated flux tubes, most probably emanating from multiple reconnection lines.
Futhermore, Trattner et al. (2002b) discussed three Polar and FAST cusp crossings at about the same MLT which took place during nearly the same stable solar wind and IMF con-ditions. They found not only cusp ion energy dispersions with three distinctive steps (step-down) similar on both satel-lites but also similar for all three cusp events. They con-cluded that the cusp exhibits not only a spatial profile but also similar cusp structures for similar IMF conditions when observed at about the same MLT position. Further evidence that cusp ion steps can be produced in a steady state by spatial variations has also been discussed by, for example, Newell and Meng (1991), Phillips et al. (1993), Lockwood and Smith (1994), Lockwood and Davis (1996) and Weiss et al. (1995).
Ambiguity between spatial and temporal variations is a common problem in interpreting any sequence of data from an orbiting satellite. Multi-spacecraft observations have proven their usefulness in distinguishing between spatial and temporal phenomenon. Previous studies by, for example, Trattner et al. (2002a) have been limited to events during sta-ble solar wind and IMF conditions, to ensure that changes in the cusp ion energy dispersion are not caused by changes in the location of the X-line. With the launch of the Cluster spacecraft we are now able to investigate cusp structures with 3 identically instrumented spacecraft under any solar wind conditions. Three satellites operating on nearly the same al-titude will eliminate alal-titude ambiguities and also allow for direct flux comparison.
Ground-based information offer an opportunity for global remote sensing of a convection pattern in a given region over a prolonged period. Such measurements also distinguish be-tween temporal and spatial structures but suffer from a lower resolution. In addition, transient signatures in the cusp ob-served from the ground by radar cannot unambiguously de-fine the structures as being caused by precipitating ions (e.g. Lockwood et al., 1993).
In this study we will combine multi-spacecraft observa-tions from three Cluster spacecraft with SuperDARN radar observations. With three high-resolution measurement points along the magnetic ground tracks of the satellites embed-ded in the simultaneous observations of global convection patterns by the SuperDARN radar network in the Northern Hemisphere, we have the tools to investigate cusp structures in unprecedented detail. We have selected a Cluster cusp crossing on 25 July 2001, and found that major cusp struc-tures can be explained as spatial feastruc-tures. In agreement with Trattner et al. (2002a) two of the Cluster spacecraft crossed
into a second spatially separated flux tube and observed a significant jump in their ion energy dispersion signature.
2 Instrumentation and data selection
Four identical Cluster satellites were launched in pairs on 15 July and 9 August 2000, into an orbit with a perigee of
∼4 RE, an apogee of ∼19.7 RE and an inclination of 90◦.
The Cluster satellites carry the Cluster Ion Spectrometers (CIS) (R`eme et al., 2001) that provide high-precision 3-D distributions for the major ion species at energies up to about 40 keV/e every 4 s (1 spin period) in best mode. The CIS instruments consist of two different analyzers, the Hot Ion Analyzer (HIA) and the time-of-flight Composition and Dis-tribution Function Analyzer (CODIF). This study will focus on observations by the CODIF instrument, which is a high-time resolution mass-resolving spectrometer capable of pro-viding full 3-D distributions of the major ion species (H+,
He2+, He+and O+) in the energy range from about 20 eV/e
to 40 keV/e. CIS data are available on three spacecraft for this study.
The cusp observations presented in this study will only in-clude H+ CIS/CODIF data from SC1, SC3 and SC4. We have selected a Cluster cusp crossing on 25 July 2001, from 23:00 UT to 26 July 2001, 00:25 UT, with relatively stable IMF conditions for the cusp crossing of SC1 and SC4, and with a significant change in IMF conditions for the cusp crossing of SC3. As in earlier studies (e.g. Trattner et al., 1999, Trattner et al., 2002a, b) we will investigate ion energy dispersions of multi-spacecraft cusp crossings and analyze the location and temporal changes of the cusp structures, i.e. major jumps in the cusp ion energy dispersion. Earlier obser-vations with the FAST and Polar spacecraft (e.g. Trattner et al., 2002a) had the advantage of a large altitude separation between the observing satellites, resulting in significantly different satellite velocities while crossing the cusp and sub-sequently different observation times of structures inside the cusp. Spatial cusp structures would appear unchanged when observed by satellites at different altitudes and different ve-locities, but the nature of temporal structures would result in characteristic changes in appearance of cusp structures (step-up versus step-down). The Cluster satellites cross the cusp at about the same altitude that eliminates this advantage. How-ever, this will be compensated for by using three identical instruments on board three satellites, crossing through the cusp with a time delay of up to 45 min and a spatial separa-tion in MLT of about 50 min. The Cluster observasepara-tions are supplemented with simultaneous radar observations by the 8 operating Northern Hemisphere SuperDARN radars which were running in a Cluster support mode for the selected cusp crossing.
In addition, Wind magnetic field and solar wind plasma data (MFI and SWE) are used as solar wind context mea-surements (Lepping et al., 1995; Ogilvie et al., 1995). These data are provided by the ISTP key parameter web page.
2 4 6 8 N (cm-3)
Data convected to MP: 8min 15sec WIND/SWE,MFI 25-JUL-2001 -200 -400 -600 -800 Vx (km/sec) 23:00 23:15 23:30 23:45 00:00 00:15 -10 -5 0 5 10 Bx ,By ,Bz (GSM) (nT) Time (UT) SC4 SC1 SC3
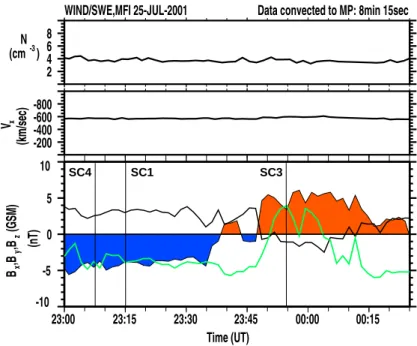
Fig. 1. Solar wind parameter mea-surements by Wind/SWE, MFI on 25 July 2001. The data have been prop-agated by about 8 min, to account for the travel time from the Wind spacecraft to the magnetopause. Plotted are so-lar wind density N , soso-lar wind velocity Vx and the magnetic field components
Bx(black line), By(green line) and Bz
(shaded area). Vertical black lines in-dicate the times when Cluster satellites crossed into the cusp, to illustrate the temporal separation of the spacecraft.
3 Observations
Figure 1 shows solar wind conditions for the Cluster cusp crossing on 25 July 2001, observed by the Wind solar wind analyzer (SWE) and the magnetic field investigation (MFI). The Wind spacecraft was located at about X(GSE)=
45 RE, Y(GSE) = 264 RE and Z(GSE) = 18 RE. The solar
wind data have been propagated by about 8 min to account for the travel time from the Wind spacecraft to the topause. We have used the actual bow shock and the magne-topause locations in the travel time calculation by using the measured solar wind conditions with the Farris and Russell (1994) bow shock model and the Petrinec and Russell (1996) magnetopause model. The location of the Wind spacecraft (upstream, but far in the afternoon sector) is not ideal for the calculation of an accurate convection time of solar wind structures to the magnetopause. No ACE spacecraft tions were available to cross check the solar wind observa-tions for this time interval. Figure 1 shows a solar wind den-sity N of about 4 cm−3(top panel) and a solar wind velocity
Vxof about 560 km/s (middle panel). The IMF components
Bx (black line), By (green line) and Bz (colored area) are
shown in the bottom panel. At the beginning of the Cluster cusp crossing until about 23:40 UT, the IMF had a typical Parker spiral configuration with a positive Bxof about 3 nT,
a negative Byof about −4 nT and a negative Bzof also about
−4 nT (blue colored area). At about 23:35 UT the Bz
com-ponent decreased in strength to about 0 nT before increasing in strength and changing northward to about 4 nT (red col-ored area) at 23:47 UT. The Bycomponent changes direction
from negative to positive for 15 min at about the same time as the Bzcomponent changed to northward. The Bx
compo-nent also switched from positive to negative for about 15 min during this time. Vertical black lines indicate the times when
Cluster satellites crossed into the cusp to illustrate the tem-poral separation of the spacecraft. SC4 and SC1 entered the cusp at 23:08 UT and 23:15 UT, respectively, during which the IMF was southward and stable for an extended period of time. SC3 entered the cusp 7 min after the IMF switched northward.
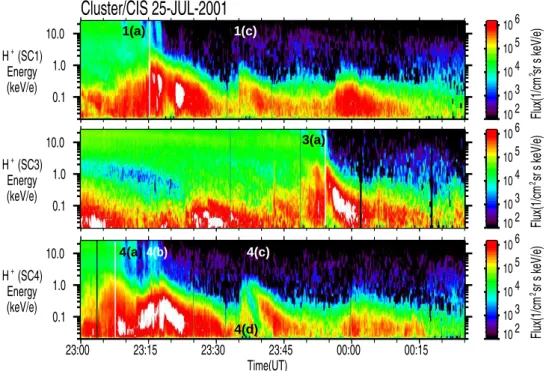
Plate 1 shows omnidirectional H+ flux measurements (1/(cm2s sr keV/e)) observed by the CIS instruments on three Cluster satellites for the cusp crossings on 25 July 2001. Fluxes from satellite SC1 (top panel), SC3 (middle panel) and SC4 (bottom panel), observed in an MLT range from 14:00 to 11:00, and invariant latitude (INVLAT) range from 76.8◦to 86◦and a geocentric distance from 4.8 R
E to 6 RE,
are shown. White regions in the color-coded plot indicate regions with flux levels above the maximum indicated flux level in the color bars. SC1 enters the cusp at about 23:15 UT, marked by a sudden flux drop for the H+ions above 1 keV/e and a significant increase in ion energy and flux intensity be-low 1 keV/e (see white line 1a). SC1 subsequently observes the typical cusp ion energy dispersion for a southward inter-planetary magnetic field, with lower energy ions arriving at higher latitudes (e.g. Reiff et al., 1977; Smith and Lockwood, 1996). The ion energy distribution decreases smoothly, in-dicating a constant magnetospheric reconnection rate at the magnetopause. At about 23:37 UT SC1 encounters a sudden increase in the ion energy dispersion (1c), consistent with a typical step-up ion signature that can occur if the satellite crossed onto magnetic field lines that were reconnected more recently. The ion energy of the precipitating ions again de-creases until about 23:45 UT, where a new low is reached. Pitch-angle analysis of this low energy distribution shows that it is composed entirely of H+ion outflow onto field lines that form the plasma mantel.
0.1 1.0 10.0 H+ (SC1) Energy (keV/e) Flux(1/cm 2 sr s keV/e)
Cluster/CIS 25-JUL-2001
10 2 10 3 10 4 10 5 10 6 0.1 1.0 10.0 H+ (SC3) Energy (keV/e) Flux(1/cm 2 sr s keV/e) 10 2 10 3 10 4 10 5 10 6 23:00 23:15 23:30 23:45 00:00 00:15 0.1 1.0 10.0 H+ (SC4) Energy (keV/e) Time(UT) Flux(1/cm 2 sr s keV/e) 10 2 10 3 10 4 10 5 10 6 4(a)4(b) 4(c) 3(a) 1(a) 1(c) 4(d)Plate 1. Cluster/CIS observation for the cusp crossings on 25 July 2001. Plotted are H+ omnidirectional flux measurements (1/(cm2s sr keV/e)) for satellite SC1, SC3 and SC4. All satellites encounter distinctive structures, sudden jumps in the ion energy dispersion that are similar on SC1 and SC4 but different on the later arriving SC3 satellite.
white line in the color spectrogram (3a). SC3 also observes a decreasing ion energy dispersion typical for a stable rate of reconnection with no further cusp structures later on.
The first Cluster satellite to enter the cusp on 25 July 2001, is SC4 at 23:08 UT (4a). The cusp encounter is also followed by a decreasing ion energy dispersion which is reversed at about 23:13 UT. The precipitating ion energy reaches a new maximum at 23:15 UT (4b), the same time as SC1 enters the cusp. The ion energy starts again to decrease before a sudden brief rise at 23:35 UT. A detailed pitch-angle analysis showed that this signature is caused by ionospheric H+outflow (4d) and not ion precipitation from the magnetosheath. A pitch-angle analysis of the proton distribution for the same time interval revealed that such an localized ion outflow distribu-tion was also present at the posidistribu-tion of SC1 but not as clearly separated from the immediately following downward precip-itating ions, as at the location of SC4. SC4 encounters this second sudden increase in ion energy about 23:37 UT (4c), similar to the increase observed by SC1 at about the same time. This step-up structure is also followed by a decrease in ion energy until about 23:45 UT, where a constant low-energy flux is reached, typical for high-latitude ion outflow.
Figure 2 shows the spatial separation of the Cluster space-craft. Plotted are the magnetic footpoints of the Cluster satel-lites (SC1 blue, SC3 green, SC4 red) during their cusp cross-ing at 25 July 2001. Also shown are convection cells (black lines) derived from SuperDARN radar observations, aver-aged over the time interval from 23:00 UT to 23:30 UT. A larger separation of the contour lines indicates a slower flow
velocity. Symbols along the magnetic footpoints of the Clus-ter satellites mark 15-min time segments. SC1 and SC4 are not only close together on the temporal scale (see Plate 1 and Fig. 1), entering the cusp within minutes of each other, but also have a small spatial separation, bringing their magnetic footpoints almost on top of each other. All Cluster magnetic footpoints are inside the dusk clockwise-rotating ionospheric convection cell (solid black lines) that covers the northern edge of North America, including Alaska and Greenland. The magnetic footpoints are also in the vicinity of an equator-ward directed bulge in the dusk convection cell, where they finally cross into the dawn counterclockwise convection cell (dashed black lines) at high latitudes.
For orientation purposes, the white ellipsoids in Fig. 2 rep-resent the average location of the auroral oval for the time of the Cluster cusp crossing on 25 July 2001. The location of the auroral oval is based on the model by Hardy et al. (1987) for Kp = 3. The white dashed line in Fig. 2 represents the
terminator. Both convection cells are located on the dayside. From the form of the clockwise convection cell we expect the location of the open-closed field line boundary to follow closely the location of the auroral oval.
Figure 3 presents color-coded line-of-sight velocity data (blue for flow towards, red for flow away) from the 8 oper-ating Northern Hemisphere SuperDARN (Greenwald et al., 1995) radars, for the time interval 23:30–23:31 UT. The Su-perDARN data coverage is especially good in the region of the equatorward directed bulge in the dusk convection cell, where the Cluster footpoints are located (compare with
Cluster 1: Cluster 3: Cluster 4: -33 -27 -21 -21 -15 -15 -15 -9 -9 -9 -3 -3 -3 -3 -3 -3 3 3 3 3 9 9 15 15
Fig. 2. Magnetic footpoints of the Cluster satellites (SC1 blue, SC3 green, SC4 red) during their cusp crossing at 25 July 2001, to il-lustrate their spatial separation. Also shown are convection cells derived from SuperDARN radar observations for the time period from 23:00 UT to 23:30 UT.
Fig. 2). Each radar of the SuperDARN network was running a cluster support mode, comprising a 16 beam scan, with each beam sounding 70 range gates, each of 45 km, start-ing at a range of 180 km. The dwell time for each beam was 3 s, with scans synchronised to start at 1 min intervals. In ad-dition to the line-of-sight data, the ionospheric equipotential flow streamlines have been calculated using the technique of Ruohoniemi and Baker (1998), and are presented as contour lines. Here the fit to the line-of-sight data is made to a 6th spherical harmonic expansion, with the fit stabilized by a sta-tistical pattern keyed to the upstream IMF data from the Wind satellite, delayed by 8 min, to allow for the propagation time from the spacecraft to the magnetopause (Ruohoniemi and Greenwald, 1996). Such an equipotential map represents a best estimate of the global ionospheric flow response to the magnetopause processes sensed by the in situ spacecraft.
Figure 4 is a composite plot that combines the temporal and spatial separations of the Cluster spacecraft into one plot. The Cluster magnetic footpoints and the ionospheric convec-tion stream lines for 25 July 2001 are shown, at 23:08 UT. Overlayed on the magnetic footpoints are 14-min wide sec-tions of the Cluster/CIS flux measurements presented in Plate 1, which are centered on the actual position of the Clus-ter satellites at 23:08 UT. This representation shows the ac-tual Cluster measurements in time at their proper spatial loca-tion where they have been observed. All satellites are in the dusk convection cell, with SC1 and SC4 close to an equator-ward bulge of this cell. At 23:08 UT SC4 (red foot point line) crossed the ion open-closed field line boundary and entered
40°N 50°N 50°N 195°E 210°E 225°E 240°E 255°E 270°E 40°N 50°N 50°N 195°E 210°E 225°E 240°E 255°E 270°E 40°N 50°N 50°N 195°E 210°E 225°E 240°E 255°E 270°E 40°N 50°N 50°N 195°E 210°E 225°E 240°E 255°E 270°E 40°N 50°N 50°N 195°E 210°E 225°E 240°E 255°E 270°E 40°N 50°N 50°N 195°E 210°E 225°E 240°E 255°E 270°E 40°N 50°N 50°N 195°E 210°E 225°E 240°E 255°E 270°E 40°N 50°N 50°N 195°E 210°E 225°E 240°E 255°E 270°E -33 -21 -9 -9 3 3 15 -800 -600 -400 -200 0 200 400 600 800 Velocity (m/s)
Fig. 3. Color-coded line-of-sight velocity data (blue for flow to-wards, red for flow away) from the 8 operating Northern Hemi-sphere SuperDARN radars for the time interval 23:30–23:31 UT. This information is used to calculate ionospheric equipotential flow streamlines by using the technique of Ruohoniemi and Baker (1998) which are presented as contour lines. Actual data coverage includes the region where the Cluster magnetic footpoints are located.
the cusp where it encounters downward precipitating magne-tosheath ions. The position of SC4 and the ion open-closed field line boundary is marked with a white triangle on SC4’s red magnetic foot point line. SC1, slightly delayed in space and time to SC4, was still on closed field lines as was SC3. Based on the center and form of the SuperDARN convection cell and the known location of the ion open-closed field line boundary, where SC4 crossed into the cusp, the most likely position of the ion open-closed field line boundary is indi-cated with a black dashed line. Note that the location of the ion open-closed field line boundary is based on the arrival of downward precipitating ions at Cluster. These ions need time to travel from the reconnection site to the observing satellite. The boundary is, therefore, located somewhat poleward of where such a boundary would have been placed from using electron precipitation or the examination of the SuperDARN data.
SuperDARN radars provide information on the open-closed field line boundary in two ways. The cusp region is known to be characterized by high spectral widths, and the boundary between high and low radar spectral width mea-surements can then act as a proxy for the open-closed field line boundary (e.g. Baker et al., 1990, 1995). In addition, the radar determination of the convection reversal boundary acts as a similar proxy. In this study the data coverage pre-vents a good determination of the spectral width boundary (although higher latitude data from Kodiak does show higher widths), but the convection reversal boundary can be deter-mined from the map potential contours, essentially following a curve from the voltage minimum (for example, the region within the smallest closed contour shown by a solid line in Fig. 4) through the contour regions of maximum curvature.
Cluster 1: Cluster 3: Cluster 4: -25 -21 -21 -21 -17 -17 -17 -17 -17 -17 -13 -13 -13 -13 -13 -13 -9 -9 -9 -9 -9 -9 -5 -5 -5 -5 -5 -5 -5 -1 -1 -1 3 7 11
2001-07-25
23:08:00
➤
➤
A
B
Fig. 4. Composite plot of Cluster magnetic footpoints and iono-spheric convection streamlines for 25 July 2001, at 23:08 UT. Over-layed on the magnetic footpoints are 14 min wide sections of the Cluster/CIS flux measurements presented in Plate 1, which are cen-tered on the actual position of the Cluster satellites at 23:08 UT. Also indicated by a dashed line is the most likely position of the ion open-closed field line boundary based on the location of the Cluster SC4 satellite position, which entered the cusp at that time, and the SuperDARN convection pattern.
Such a boundary may be displaced from the actual open-closed field line boundary (for example, by viscous coupling effects) but does give the overall boundary shape and motion. Combined with the in situ spacecraft data from Cluster, how-ever, the location and shape of the ion open-closed field line boundary may then be estimated.
In Fig. 4, the open-closed field line boundary determined from the convection cell method would closely follow the average location of the auroral oval (white line), while the “ion” open-closed field line boundary, depicted with a dashed black line and determined by the Cluster spacecraft crossing into the downward precipitating ion region, is located (as ex-pected) poleward of this boundary.
Geomagnetic field lines reconnected at the magnetopause will start their convection cycle along the open-closed field line boundary. Following the convection lines evaluated from the SuperDARN radar data, a magnetic field line which starts a cycle at Point A will need to convect to B, to intersect the SC4 Cluster satellite. For this specific configuration, SC4 will travel only a short distance to higher latitudes (from the entry point into the cusp to point B) to intersect mag-netic field lines that have been open for a rapidly increasing amount of time. Due to this rapidly increasing distance be-tween the observing satellite and the ion open-closed field line boundary along the convection lines, this should result
Cluster 1: Cluster 3: Cluster 4: -29 -25 -25 -25 -21 -21 -21 -21 -21 -17 -17 -17 -17 -17 -17 -13 -13 -13 -13 -13 -9 -9 -9 -9 -9 -5 -5 -5 -5 -5 -5 -1 -1 -1 -1 3 7 11
2001-07-25
23:15:00
➤ ➤A
B
4(b)Fig. 5. Composite plot of Cluster magnetic footpoints and iono-spheric convection streamlines for 25 July 2001, at 23:15 UT. Over-layed on the magnetic footpoints are 14-min wide sections of the Cluster/CIS flux measurements presented in Plate 1, which are cen-tered on the actual position of the Cluster satellites at 23:15 UT. Also indicated by a dashed line is the most likely position of the ion open-closed field line boundary based on the location of the Cluster SC1 satellite position, which entered the cusp at that time, and the SuperDARN convection pattern. This representation revealed that SC1 enters the cusp at about the same position as SC4 7 min earlier.
in a significant decrease in the energy of precipitating ions observed by SC4 with increasing invariant latitude. Plate 1 shows that this is indeed the case.
Figure 5 is a composite plot with the same format as Fig. 4, but for a later time. The Cluster magnetic footpoints and ionospheric convection streamlines for 25 July 2001 are plot-ted, at 23:15 UT. Overlayed on the magnetic footpoints are again 14-min wide sections of the Cluster/CIS flux measure-ments presented in Plate 1, centered on the actual position of the Cluster satellites at 23:15 UT. All Cluster satellites are still magnetically connected to the dusk ionospheric convec-tion cell with SC4 inside the cusp, SC1 at the ion open-closed field line boundary and SC3 on closed field lines. The loca-tion of SC1 at the boundary is marked with a star along the blue magnetic foot point line that coincides with the position of the triangle where SC4 entered the cusp. Between the time when SC4 and SC1 crossed the ion open-closed field line boundary, the boundary did not move significantly. Based on this new position measurement of the equatorward position of the cusp and the center and form of the convection cell, the estimated position of the ion open-closed field line boundary is again marked with a dashed line. The equatorward bulge in the convection cell is less prominent at 23:15 UT com-pared to six minutes before when SC4 entered the cusp. This change caused the convection streamlines to severely shorten
Cluster 1: Cluster 3: Cluster 4: -25 -17 -17 -17 -17 -9 -9 -9 -9 -9 -9 -1 -1 -1 -1 -1 -1 -1 3 3 11 11
2001-07-25
23:37:00
1(c) 4(c)Fig. 6. Composite plot of Cluster magnetic footpoints and iono-spheric convection streamlines for 25 July 2001, at 23:37 UT. Over-layed on the magnetic footpoints are 14-min wide sections of the Cluster/CIS flux measurements presented in Plate 1, which are cen-tered on the actual position of the Cluster satellites at 23:37 UT. The original entry point of SC1 and SC4 into the cusp are marked with a star and a triangle along the tracks of their magnetic foot-points. SC1 and SC4 are deep inside the cusp and have just entered the dawn convection cell, which resulted in an almost simultaneous sudden increase in the ion energy dispersion on both satellites, as expected from a spatial interpretation of the cusp structures. At that time SC3 was still on closed field lines.
between the ion open-closed field line boundary and the mag-netic footpoints of the Cluster spacecraft. While position B along the magnetic footpoints of SC4 remained unchanged, position A at the boundary has moved considerable closer. Newly-opened magnetic field lines will not have to convect far to intersect the Cluster satellites, which, in turn, will allow precipitating ions with higher energies to be observed at the satellite. While SC1 has just entered the cusp, encountering precipitating ions injected onto the open magnetic field line with the highest energies, the initially decreasing ion energy dispersion profile for SC4 has turned around and increased in energy, forming a new maximum at 23:15 UT (4b in Plate 1 and Fig. 5). The new maximum in the ion energy dispersion profile observed at SC4 is in agreement with the observed shortening of the convection distance derived from the Su-perDARN radar data.
Figure 6 shows the composite plot of Fig. 4 at 23:37 UT. SC1 and SC4 are deep inside the cusp, while SC3 is still on closed field lines. The original entry point of SC1 and SC4 into the cusp are marked with a star and a triangle along the tracks of their magnetic footpoints. At 23:37 UT the IMF shows a strong decrease in the value of Bz, which will
sub-sequently result in a reversal from negative to positive Bz.
Fig. 7. Composite plot of Cluster magnetic footpoints and iono-spheric convection streamlines for 25 July 2001, at 23:54 UT. Over-layed on the magnetic footpoints are 14-min wide sections of the Cluster/CIS flux measurements presented in Plate 1, and centered on the actual position of the Cluster satellites at 23:54 UT. SC1 and SC4 observe low energy ion outflow typical for the high-latitude re-gion poleward of the cusp. SC3 has finally reached the cusp and encounters the typical cusp ion energy dispersion with higher en-ergy ions arriving at subsequently higher latitudes.
The dusk convection cell has been elongated, lengthening the convection path again. The equatorward directed bulge has reasserted itself, moved rapidly equatorward, which, in turn, allowed for the dawn convection cell to move equatorward as well. At 23:37 UT SC1 and SC4 have progressed far enough poleward to be overtaken by the equatorward moving dawn convection cell. The transition from one convection cell to another resulted in an almost simultaneous sudden increase in the ion energy dispersion (structures 1c and 4c in Plate 1) on both satellites, indicating that the ion open-closed field line boundary in the dawn convection cell is much closer to the SC1 and SC4 magnetic footpoints than in the dusk con-vention cell. The satellite positions at 23:37 UT, which are also the positions of the sudden increase in the ion energy dispersion, are marked with a small star (SC1) and a small triangle (SC4).
The sudden increase in the ion energy dispersion that co-incides with a satellite moving into a neighbouring and spa-tially separated flux tube (or convection cell) was discussed by Trattner et al. (2002a, b) based on Polar and FAST precip-itating ion observations of stable, unchanging cusp structures during stable solar wind conditions. Figure 6 shows not only that such a scenario can take place, but also that it occurs during dynamic solar wind IMF conditions. The change in IMF conditions most likely caused a change in the location of
the reconnection site and the associated convection pattern, which, in turn, caused a shift in the positions of the spatially separated flux tubes emanating from these reconnection sites. Figure 7 shows the ionospheric convection streamlines and flux measurements for 25 July 2001, at 23:54 UT. SC1 and SC4 observe low energy ion precipitation, typical for plasma entering the open field lines at high magnetic latitudes pole-ward of the cusp. SC3 has finally reached the cusp and en-counters the typical cusp ion energy dispersion, with higher energy ions arriving at subsequently higher latitudes. Us-ing the position of the equatorward boundary of the cusp from SC3, and the center and form of the convection cell, we have estimated the location of the ion open-closed field line boundary. At 23:54 UT, the IMF has turned northward. The dawn convection cell was almost completely annihilated by this IMF change. The dusk convection cell is about to break up into smaller cells (not shown here), but at 23:54 UT the outlines of the original cell from the beginning of the Cluster cusp event are still visible. The estimated ion open-closed field line boundary also crosses the position of the boundary encountered by SC1 and SC4 almost 45 min earlier. These positions are marked with a white star and triangle symbols along their respective magnetic footpoints. Additional sym-bols along the magnetic footpoints of SC1 and SC4 at higher latitudes mark the position where the sudden step-up was en-countered.
4 Summary and conclusion
Combining the observations of several satellites to separate spatial and temporal effects has proven to provide new in-sights into old ambiguities and is becoming increasingly more exploited since the launch of the Cluster spacecraft. Earlier studies were relying on chance conjunctions of of-ten very different satellites in the cusps to study the tempo-ral and spatial nature of cusp structures (e.g. Onsager et al., 1995; Trattner et al., 2002a). For cusp structures the use of satellites operating on vastly different altitudes is considered to be an advantage, since temporal features would appear dif-ferently compared to spatial features on the observing satel-lites. These earlier studies indeed revealed that, during stable solar wind conditions, structures in the cusp appear to be spa-tial features, most probably related to spaspa-tially separated flux tubes like, for example, different convection cells.
However, if the above conclusions are correct, then cusp structures should be spatial, even during changing solar wind and IMF conditions. The shift in the location of the recon-nection line (or reconrecon-nection lines for multiple X-lines) at the magnetopause would certainly cause a change in the convec-tion pattern in the ionosphere. New flux tubes will be opened or existing flux tubes moved to different locations. Even if these flux tubes are changing in time and location, cusp steps should be observed when satellites cross the boundaries be-tween them. Therefore, we would have a temporally chang-ing cusp, with temporally changchang-ing locations of the bound-aries between spatially separated flux tubes/convection cells.
Note, in the classical pulsating cusp model (e.g. Lock-wood and Smith, 1989), where cusp structures are caused by variations in the reconnection rate at the magnetopause, the convecting flux tubes originating from different reconnec-tion pulses are also spatially separated. Cusp structures are always encountered by satellites when boundaries between such flux tubes are crosses. The difference in spatial cusp structures is that these spatial structures represent boundaries between, for example, convection cells (which can change position over time), while temporal structures are flux tubes convecting within a convection cell.
In this study we have analyzed Cluster cusp crossings on 25 July 2001, together with simultaneous observations by the SuperDARN radar network. With three operating ion com-position instruments providing detailed measurements in the cusp, together with ground-based observations providing a global view of the convection region, the investigation of cusp structures is no longer limited to stable solar wind and IMF conditions.
In the initial phase of the 25 July cusp crossing, the IMF was in a Parker spiral configuration with a negative By and
Bz component. For such IMF conditions with a significant
By component we can expect anti-parallel merging regions
in the Northern and Southern Hemispheres (e.g. Crooker et al., 1985; Luhmann et al., 1984). These two X-lines will map into the cusps, forming two different flux tubes/convection cells with independent magnetic field line histories since re-connection. SC4 and SC1 entered the cusp within 7 min of each other, at about the same position along their magnetic ground tracks. Several sudden steps in the ion energy disper-sion were encountered by the Cluster spacecraft and could be explained as:
1. The result of temporal changes in the convection pat-tern which drastically shortened the convection length of magnetic field lines from the ion open-closed field line boundary to the position where they are intercepted by the satellites, therefore allowing precipitating ions with higher energies to reach the satellite.
2. The entry into a different spatially separated convec-tion cell, where the locaconvec-tion of the ion open-closed field line boundary was significantly closer to the observing satellite compared to the original cell, which resulted in a sudden step-up of the ion energy dispersion. For the case of the Cluster cusp crossing on 25 July 2001, the entry into the spatially separated convection cell was achieved by a temporal reorganization of the convection pattern, moving the boundary between the convection cells over the location of two of the observing satellites. These observations are in agreement with the spatial in-terpretation of cusp structures by Trattner et al. (2002a), but also show a temporal component in the generation of cusp structures. The event does not show convecting features con-sistent with the widely used pulsating cusp model (e.g. Lock-wood and Smith, 1989, 1990, 1994; LockLock-wood et al., 1998). However, it does not rule out the existence of such cusp
struc-tures caused by the temporal variation of the reconnection rate. As mentioned above, the signature of such temporal reconnection pulses should show up as moving structures within one convection cell and would be in agreement with the observation of poleward moving transients in radar data. In this study we have successfully linked satellite ob-servations with an ionospheric convection pattern derived from SuperDARN radar observations. The combination of temporal and spatial scale lengths into one composite pic-ture showed a remarkably good correlation between the en-counter of cusp structures by the Cluster satellites and the motion of large-scale convection cells. The cusp structures observed during the 25 July 2001 Cluster cusp crossing are consistent with encountering variations of the location of spatially separated flux tubes.
Acknowledgements. We acknowledge the use of ISTP KP database.
Solar wind observations were provided by K. Ogilvie at NASA/GSFC (Wind/SWE), magnetic field observations were pro-vided by R. Lepping at NASA/GSFC (Wind/MFI). The work at Lockheed Martin was supported by NASA contracts NAS5-30302, NAG5-3596 and NAG5-12218. The work at the Max-Planck-Institut f¨ur Aeronomie was supported by DLR under contract 50 OC 8903 0 (Cluster-CIS). We would like to thank the SuperDARN PIs (W. A. Bristow, P. Dyson, R. A. Greenwald, T. Kikuchi, M. Lester, M. Pinnock, N. Sato, G. Sofko, J.-P. Villain and A. D. M. Walker) for providing the coordinated cluster support radar modes which were running during this spacecraft conjunction.
Topical Editor T. Pulkkinen thanks K. Kauristie and another ref-eree for their help in evaluating this paper.
References
Baker, K. B., Greenwald, R. A., Ruohoniemi, J. M., Dudeney, J. R., Pinnock, M., Newell, P. T., Greenspan, M. E., and Meng, C.-I.: Simultaneous HF radar and DMSP observations of the cusp, Geophys. Res. Lett., 17, 1869, 1990.
Baker, K. B., Dudeney, J. R., Greenwald, R. A., Pinnock, M., Newell, P. T., Rodger, A. S., Mattin, N., and Meng, C.-I.: HF radar signatures of the cusp and low-latitude boundary layer, J. Geophys. Res., 100, 7671, 1995.
Boudouridis, A., Spence, H. E., and Onsager, T. G.: Investigation of magnetopause reconnection models using two co-located, low-altitude satellites: A unifying reconnection geometry, J. Geo-phys. Res., 106, 29 451, 2001.
Cowley, S. W. H.: The cause of convection in the Earth’s Magne-tosphere: A Review of developments during the IMS, Rev. Geo-phys. Res., 20, 531, 1982.
Cowley, S. W. H., Freeman, M. P., Lockwood, M., and Smith, M. F.: The ionospheric signatures of flux transfer events, in CLUSTER: Dayside Polar Cusp, edited by Barron, C. I., European Space Agency Spec. Publ., ESA SP-330, 105, 1991.
Cowley, S. W. H. and Lockwood, M.: Excitation and decay of so-lar driven flows in the magnetosphere-ionosphere system, Ann. Geophysicae, 10, 103, 1992.
Crooker, N. U., Luhmann, J. G., Spreiter, J. R., and Stahara, S. S.: Magnetopause merging site asymmetries, J. Geophys. Res., 90, 341, 1985.
Escoubet, C. P., Smith, M. F., Fung, S. F., et al.: Staircase ion sig-nature in the polar cusp: A case study, Geophys. Res. Lett., 19, 1735, 1992.
Escoubet, C. P., Bosqued, J. M., Hoffman, R. A., Berthelier, A., and Anderson, P. C.: Opposite ion dispersions observed quasi-simultaneously in the polar cusp by the DE-2 and Aureol-3 satel-lites, Geophys. Res. Lett., 24, 2487, 1997.
Farris, M. H. and Russell, C. T.: Determining the standoff distance of the bowshock: Mach number dependence and use of models, J. Geophys. Res., 99, 17 681, 1994.
Fuselier, S. A., Klumpar, D. M., and Shelley, E. G.: Ion reflec-tion and transmissions during reconnecreflec-tion at the Earth’s subso-lar magnetopause, Geophys. Res. Lett., 18, 139, 1991.
Fuselier, S. A., Trattner, K. J., and Petrinec, S. M.: Cusp observa-tions of high- and low-latitude reconnection for northward inter-planetary magnetic field, J. Geophys. Res., 105, 253, 2000. Greenwald, R. A., Baker, K. B., Dudeney, J. R., et al.:
DARN/SUPERDARN A global view of the dynamics of high-latitude convection, Space Sci. Rev., 71, 761, 1995.
Hardy, D. A., Gussenhoven, M. S., Raistrick, R., and McNeil, W. J.: Statistical function and representations of the pattern of auroral energy flux, number flux and conductivity, J. Geophys. Res., 92, 12 275, 1987.
Lepping, R. P., Acuna, M. H., Burlaga, L. F., et al.: The Wind mag-netic field instrument, in: The Global Geospace Mission, edited by Russell, C. T., pp. 207, Kluwer Academic Press, The Nether-lands, 1995.
Lockwood, M.: Location and characteristics of the reconnection X-line deduced from low-altitude satellite and ground-based ob-servations, I-Theory, J. Geophys. Res., 100, 21 791, 1995. Lockwood, M., Dening, W. F., Farmer, A. D., Davda, V. N., Cowley,
S. W. H., and L¨uhr, H.: Ionospheric signatures of pulsed recon-nection at the Earth’s magnetopause, Nature, 361, 424, 1993. Lockwood, M. and Smith, M. F.: Low-altitude signatures of the
cusp and flux transfer events, Geophys. Res. Lett., 16, 879, 1989. Lockwood, M. and Smith, M. F.: Reply to Comment by P. T. Newell on “Low-altitude signatures of the cusp and flux transfer events” by M. Lockwood and M. F. Smith, Geophys. Res. Lett., 17, 305– 306, 1990.
Lockwood, M. and Smith, M. F.: Low- and mid-altitude cusp parti-cle signatures for general magnetopause reconnection rate varia-tions, I Theory, J. Geophys. Res., 99, 8531, 1994.
Lockwood, M., Cowley, S. W. H., and Smith, M. F.: Comment on: “Byfluctuations in the magnetosheath and azimuthal flow
veloc-ity transient in the dayside ionosphere” by Newell and Sibeck, Geophys. Res. Lett., 21, 1819, 1994.
Lockwood, M., Davis, C. J., Smith, M. F., Onsager, T. G., and Denig, W. F.: Location and characteristics of the reconnection X-line deduced from low-altitude satellite and ground-based obser-vations, Defense Meteorological Satellite Program and European Incoherent Scatter data, J. Geophys. Res., 100, 21 803, 1995. Lockwood, M. and Davis, C. J.: On the longitudinal extend of
magnetopause reconnection pulses, Ann. Geophysicae, 14, 865, 1996.
Lockwood, M., Davis, C. J., Onsager, T. G., and Scudder, J. D.: Modeling signatures of pulsed magnetopause reconnection in cusp ion dispersion signatures seen at middle altitudes, Geophys. Res. Lett., 25, 591, 1998.
Luhmann, J. R., Walker, R. J., Russell, C. T., Crooker, N. U., Spre-iter, J. R., and Stahara, S. S.: Patterns of potential magnetic field merging sites on the dayside magnetopause, J. Geophys. Res., 89, 1739, 1984.
McWilliams, K. A., Yeoman, T. K., and Cowley, S. W. H.: Two-dimensional electric field measurements in the ionospheric foot-print of a flux transfer event, Ann. Geophysicae, 18, 1584, 2001. Milan, S. E., Lester, M., Cowley, S. W. H., and Brittnacher, M.: Convection and auroral response to a southward turning of the IMF: Polar UVI, CUTLASS and IMAGE signatures of transient magnetic flux transfer at the magnetopause, J. Geophys. Res., 105, 15 741, 2000.
Neudegg, D. A., Yeoman, T. K., Cowley, S. W. H., Provan, G., Haerendel, G., Baumjohann, W., Auster, U., Fornac¸on, K.-H., Georgescu, E., and Owen, C. J.: A Flux transfer event observed at the magnetopause by the Equator-S spacecraft and in the iono-sphere by the CUTLASS HF radar, Ann. Geophysicae, 17, 707, 1999.
Newell, P. T. and Meng, C.-I.: Ion acceleration at the equatorward edge of the cusp: Low-altitude observations of patchy merging, Geophys. Res. Lett., 18, 1829, 1991.
Newell, P. T. and Meng, C.-I.: Cusp low-energy ion cutoffs: A sur-vey and implications for merging, J. Geophys. Res., 100, 21 943, 1995.
Newell, P. T. and Sibeck, D. G.: Upper limits on the contribution of FTE’s to ionospheric convection, Geophys. Res. Lett., 20, 2829, 1993.
Ogilvie, K. W., Chornay, D. J., Fritzenreiter, R. J., et al.: SWE: A comprehensive plasma instrument for the Wind spacecraft, in: The Global Geospace Mission, edited by Russell, C. T., pp. 55, Kluwer Academic Press, Norwell, Mass., 1995.
Onsager, T. G., Kletzing, C. A., Austin, J. B., and MacKiernan, H.: Model of magnetosheath plasma in the magnetosphere: Cusp and mantle particles at low altitudes, Geophys. Res. Lett., 20, 479, 1993.
Onsager, T. G., Chang, S.-W., Perez, J. D., Austin, J. B., and Jano, L. X.: Low-altitude observations and modeling of quasi-steady magnetopause reconnection, J. Geophys. Res., 100, 11 831, 1995.
Paschmann, G., et al.: Plasma Acceleration at the Earth’s magne-topause: Evidence for magnetic field reconnection, Nature, 282, 243, 1979.
Petrinec, S. M. and Russell, C. T.: Near-Earth magnetotail shape and size as determined from the magnetopause flaring angle, J. Geophys. Res., 101, 137–152, 1996.
Phillips J. L., Bame, S. J., Elphic, R. C., Gosling, J. T., Thomson, M. F., and Onsager, T. G.: Well-resolved observations by ISEE 2 of ion dispersion in the magnetospheric cusp, J. Geophys. Res., 98, 13 429, 1993.
Reiff, P. H., Hill, T. W., and Burch, J. L.: Solar wind plasma
injec-tions at the dayside magnetospheric cusp, J. Geophys. Res., 82, 479, 1977.
R`eme, H., Aoustin, C., Bosqued, J. M., et al.: First multispace-craft ion measurements in and near the Earth’s magnetosphere with indentical Cluster ion spectrometry (CIS) experiment, Ann. Geophysicae, 19, 1303, 2001.
Rosenbauer, H., Gr¨unwaldt, H., Montgomery, M. D., Paschmann, G., and Sckopke, N.: Heos 2 plasma observations in the distant polar magnetosphere: The plasma mantle, J. Geophys. Res., 80, 2723, 1975.
Ruohoniemi, J. M. and Greenwald, R. A.: Statistical patterns of high latitude convection obtained from Goose Bay HF radar ob-servations, J. Geophys. Res., 101, 21 743, 1996.
Ruohoniemi, J. M. and Baker, K. B.: Large-scale imaging of high latitude convection with Super Dual Auroral Radar Network HF radar observations, J. Geophys. Res., 103, 20 797, 1998. Shelley, E. G., Sharp, R. D., and Johnson, R. G.: He++and H+
flux measurements in the day side cusp: Estimates of convection electric field, J. Geophys. Res., 81, 2363, 1976.
Smith, E. J., Lockwood, M., and Cowley, S. W. H.: The statistical cusp: The flux transfer event model, Planet. Space Sci., 40, 1251, 1992.
Smith, M. F. and Lockwood, M.: Earth’s magnetospheric cusp, Rev. Geophys., 34, 233, 1996.
Sonnerup, B. U. ¨O, Paschmann, G., Papamastorakis, I., et al.: Ev-idence for magnetic field reconnection at the Earth’s magne-topause, J. Geophys. Res., 86, 10 049, 1981.
Trattner, K. J., Fuselier, S. A., Peterson, W. K., Sauvaud, J.-A., Ste-nuit, H., and Dubouloz, N.: On spatial and temporal structures in the cusp, J. Geophys. Res., 104, 28 411, 1999.
Trattner, K. J., Fuselier, S. A., Peterson, W. K., B¨ohm, M., Klumpar, D., Carlson, C. W., and Yeoman, T. K.: Temporal versus spatial interpretation of cusp ion structures observed by two spacecraft, J. Geophys. Res., 107(A10), 1287, doi: 10.1029/2001JA000181, 2002a.
Trattner, K. J., Fuselier, S. A., Peterson, W. K., and Carlson, C. W.: Spatial features observed in the cusp under steady so-lar wind conditions, J. Geophys. Res., 107(A10), 1288, doi: 10.1029/2001JA000262, 2002b.
Weiss, L. A., Reiff, P. H., Carlson, H. C., Weber, E. J., and Lock-wood, M.: Flow-alignment jets in the magnetospheric cusp: Re-sults from the Geospace Environment Modeling Pilot program, J. Geophys. Res., 100, 7649, 1995.
Wing, S., Newell, P. T., and Rouhoniemi, J. M.: Douple Cusp: Model prediction and observational verification, J. Geophys. Res., 106, 25 571, 2001.